A deep learning method using computed tomography scout images for estimating patient body weight
←
→
Page content transcription
If your browser does not render page correctly, please read the page content below
www.nature.com/scientificreports
OPEN A deep‑learning method using
computed tomography scout
images for estimating patient body
weight
1,2
Shota Ichikawa , Misaki Hamada2 & Hiroyuki Sugimori 3*
Body weight is an indispensable parameter for determination of contrast medium dose, appropriate
drug dosing, or management of radiation dose. However, we cannot always determine the accurate
patient body weight at the time of computed tomography (CT) scanning, especially in emergency
care. Time-efficient methods to estimate body weight with high accuracy before diagnostic CT scans
currently do not exist. In this study, on the basis of 1831 chest and 519 abdominal CT scout images
with the corresponding body weights, we developed and evaluated deep-learning models capable of
automatically predicting body weight from CT scout images. In the model performance assessment,
there were strong correlations between the actual and predicted body weights in both chest (ρ = 0.947,
p < 0.001) and abdominal datasets (ρ = 0.869, p < 0.001). The mean absolute errors were 2.75 kg and
4.77 kg for the chest and abdominal datasets, respectively. Our proposed method with deep learning
is useful for estimating body weights from CT scout images with clinically acceptable accuracy and
potentially could be useful for determining the contrast medium dose and CT dose management in
adult patients with unknown body weight.
Body weight is an important parameter in the field of radiology as the dose of contrast m edium1, management
of radiation d ose2, 3, or selection of reduced tube v oltage4 is strongly related to body weight. However, we can-
not always determine the accurate body weight at the time of computed tomography (CT) scanning, especially
in emergency care. Patients in emergency care are often unresponsive and unable to state their body weight.
Additionally, body weight measurement using a calibrated floor scale is limited in emergency settings. Visual
estimation of body weight by medical staff is unreliable5–7, even though it is the most accessible method. A bed-
side method8 with anthropometric measurements to estimate body weight was reported; however, this method
yields moderate accuracy and may be time-consuming.
A more accurate estimation of body weight that uses CT scan data has been shown in previous s tudies9, 10.
These methods might be useful in the management of radiation dose or accurate drug dosing; however, their
use in the determination of the contrast medium dose is limited as these methods require diagnostic CT scan
data. Contrast-enhanced CT is frequently performed without pre-acquisition of non-contrast CT images. Time-
efficient methods to estimate body weight with high accuracy before diagnostic CT currently do not exist.
In a typical CT examination, the patient is initially scanned with a “scout” or “localizer” acquisition, which
is a 2D planner image acquired before diagnostic CT. If body weight can be predicted from CT scout images,
radiologists or technologists could determine the appropriate dose of contrast medium before diagnostic CT.
Recently, deep learning has shown many encouraging results in the field of medical image processing and analy-
sis. Particularly, a convolutional neural network (CNN) has been shown to be well suited for object detection11,
12
, semantic s egmentation13, 14, image c lassification15, 16, and p
rediction17, 18 tasks in radiological research. This
study aimed to develop a CNN-based method using chest and abdominal CT scout images for predicting body
weight and to evaluate the correlation between actual and predicted body weights.
There are two main contributions from this study. First, we propose a new time-efficient CNN-based approach
for predicting body weight with clinically acceptable accuracy. Second, we demonstrate that body weight can be
estimated from CT scout images even without diagnostic scan data.
1
Graduate School of Health Sciences, Hokkaido University, Kita‑12, Nishi‑5, Kita‑ku, Sapporo 060‑0812,
Japan. 2Department of Radiological Technology, Kurashiki Central Hospital, 1‑1‑1 Miwa, Kurashiki,
Okayama 710‑8602, Japan. 3Faculty of Health Sciences, Hokkaido University, Kita‑12, Nishi‑5, Kita‑ku,
Sapporo 060‑0812, Japan. *email: sugimori@hs.hokudai.ac.jp
Scientific Reports | (2021) 11:15627 | https://doi.org/10.1038/s41598-021-95170-9 1
Vol.:(0123456789)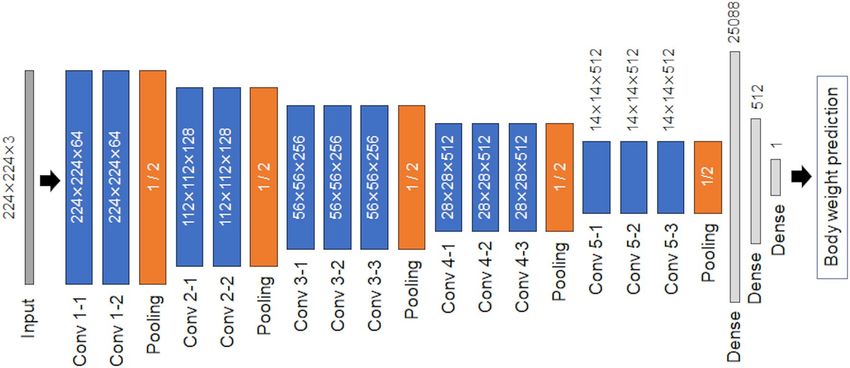
www.nature.com/scientificreports/
The rest of this paper is arranged as follows. We briefly review related studies in Sect. 2, the details of our
CNN-based method and its evaluation are provided in Sect. 3, experimental results are described in Sect. 4, and
we discuss and conclude our paper in Sects. 5 and 6, respectively.
Related studies
Body weight estimation has attracted a lot of attention for a long time in emergency care. Here we discuss the
publications that are relevant to our work and briefly compare these publications with our work.
Buckley et al. proposed equations for estimating actual body weight by measuring the abdominal circum-
ference and thigh c ircumference8. Unfortunately, their method only showed moderate accuracy, with devia-
tions > ± 10 kg in 15% of male patients and 27% of female patients. Furthermore, anthropometric measurements
are a burden to medical staff and time-consuming. A few publications have presented more accurate equations
for estimating body weight by using diagnostic CT scan data. For instance, Geraghty et al. generated the predic-
tive equation for men that included age, L1 cross-sectional area, spinal canal area, subcutaneous fat area, and
the transverse body diameter, whereas the equation for women included only age, body circumference, and the
anteroposterior diameter of L19. However, manual measurements of the parameters are technically challeng-
ing and time-consuming. Gascho et al. developed a linear regression equation based on effective mAs from CT
dose modulation on whole-body scans10. However, as they mentioned, their approach is limited to polytrauma
patients who undergo whole-body CT scans and experiences variances in dose modulation strategies between
vendors. Furthermore, these two methods require diagnostic CT data, and their use for determining the dose
of contrast medium is limited.
In our work, we used CT scout images as input for the deep-learning approach because it was certainly
acquired at the time of the CT scan, and no time-consuming measurement is required for body-weight estimation.
Materials and methods
This retrospective study was approved by the institutional review board of Kurashiki Central Hospital, which
granted permission to use pre-acquired anonymized data, and the requirement for individual informed consent
was waived. All methods were carried out by following the principles of the Declaration of Helsinki.
Subjects and CT acquisition. We retrospectively reviewed all patients who underwent chest CT between
June 2019 to October 2020 (n = 1868) and abdominal CT between June 2019 to December 2020 (n = 526) for
medical checkup. The inclusion criterion were accurate height and weight measured by using a calibrated scale
on the same day. Thirty-seven subjects with chest datasets and seven subjects with abdominal datasets were
excluded due to missing data on height and weight measured on the same day. Consideration was not taken for
metallic prostheses or implantable devices. Thus, for chest datasets, the final study population consisted of 1831
(1330 men, 501 women) subjects who underwent chest CT for lung cancer screening with ages ranging from 24
to 92 years. For abdominal datasets, the final study population consisted of 519 (291 men, 228 women) subjects
who underwent abdominal CT for visceral fat area measurement with ages ranging from 25 to 92 years.
CT images were acquired with an 80-detector row CT scanner (Aquilion Prime; Canon Medical Systems,
Otawara, Japan). The frontal scout view of the chest and abdomen was obtained by using 120 kVp and 10 mA.
Datasets and preprocessing. Figure 1 shows a block diagram of our CNN-based method for body-
weight estimation. In this study, supervised training of a CNN was performed using chest and abdominal CT
scout images as input data and the corresponding body weights as reference data. The performance of our mod-
els was evaluated with other datasets that were excluded in the training datasets.
Therefore, the constructed datasets were randomly divided into training and validation sets (80%) and testing
sets (20%). Of 1831 chest scout images, 1464 images were used for training and validation, and the remaining 367
images were used for testing. Of 519 abdominal scout images, 415 images were used for training and validation,
and the remaining 104 images were used for testing. The data augmentation technique was not used.
The scout images were converted from a Digital Imaging and Communications in Medicine (DICOM) format
to Joint Photographic Experts Group format for use in the training. The window width and level of the DICOM
images were used to preset values in the DICOM tag. The first step of the preprocessing was to normalize image
size before feeding them to the CNN. All scout images had a constant width of 552 pixels, but image height
considerably varied. Accordingly, we resized the image height to 552 pixels through a combination of preserv-
ing their aspect ratios and using zero-padding. Then, these images were resized to 224 × 224 pixels for a transfer
learning of the CNN.
Deep convolutional neural network structure and training. A regression model to predict body
weight was generated based on the VGG16 architecture19, which was pretrained with the ImageNet database20.
VGG16 consists of 13 convolutional layers and three fully connected layers, including rectified linear unit
(ReLU) function and dropout. In this study, the fully connected layer of the original VGG16 was removed; then,
the following three layers were added: (1) flatten layer, (2) fully connected dense layer with activation function
“ReLU,” and (3) final fully connected dense layer with an output size of 1 (Fig. 2). Only the added fully connected
layers were trained for creating the model. The loss function used was mean square error, and the Adam21 opti-
mizer was used for adjusting model weights. The initial learning rate was 0.001. The learning rate was dropped
by one-tenth following every three epochs of training. The maximum number of training epochs was 40, and
the batch size was 32.
Scientific Reports | (2021) 11:15627 | https://doi.org/10.1038/s41598-021-95170-9 2
Vol:.(1234567890)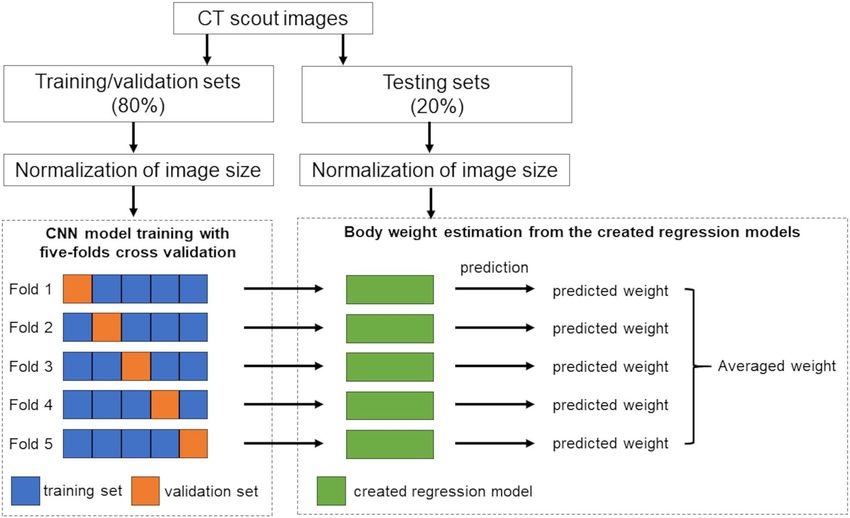
www.nature.com/scientificreports/
Figure 1. Block diagram of a convolutional neural network-based method for body-weight estimation.
Figure 2. Convolutional neural network (CNN) architecture based on the VGG16 architecture. Only the fully
connected layer of the original VGG16 was modified as output shape was fit to 1 for the regression model.
A k-fold cross-validation method with k = 5 was utilized for the training and validation of the CNN model.
Subsequently, the model was trained five times, where four of the five sets were used for training and the remain-
ing set was used for validation.
The CNN models were trained under the following environment: CPU, Intel Core i7-9700F; GPU, NVIDIA
GeForce RTX 2070 Super 8 GB; Framework, Keras 2.3.1 with TensorFlow backend (ver.2.0.0); Language, Python
3.7.10.
Evaluation of the created models. The created regression models were used to predict the body weights
of the testing sets. The average body weight derived from the five created models was calculated for each sub-
ject. Scatter plots of the actual and predicted body weights were generated. The differences between the actual
and predicted body weights were calculated. The number (%) of subjects within acceptable error was counted.
According to previous reports8, the acceptable error was defined as 5 kg and 10 kg increments, as these seemed
to be the most clinically meaningful and practical breakpoints. Then, the mean absolute error (MAE) was calcu-
lated for the chest and abdominal datasets, respectively, according to the following equation:
Scientific Reports | (2021) 11:15627 | https://doi.org/10.1038/s41598-021-95170-9 3
Vol.:(0123456789)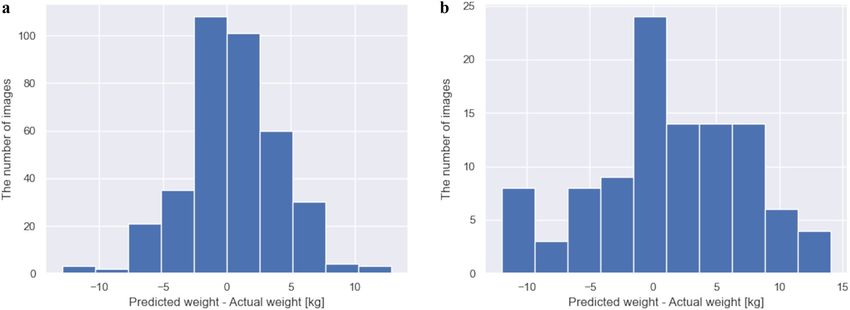
www.nature.com/scientificreports/
Region Characteristics Training/validation sets Testing sets P
n 1464 367 –
Sex, male/female 1059/405 271/96 0.608
Age, median (IQR) years 61 (52–69) 61 (52–69) 0.852
Chest
Weight, median (IQR) (kg) 64.5 (57.2–72.0) 64.0 (57.2–72.1) 0.691
Height, median (IQR) (cm) 166.8 (160.2–172.0) 166.5 (159.8–172.0) 0.514
BMI, median (IQR) (kg/m2) 23.3 (21.4–25.3) 23.3 (21.4–25.6) 0.643
n 415 104 –
Sex, male/female 232/183 59/45 0.967
Age, median (IQR) years 57 (48–68) 60 (52–69) 0.019
Abdomen
Weight, median (IQR) (kg) 63.8 (56.8–72.3) 65.3 (57.4–73.8) 0.228
Height, median (IQR) (cm) 164.4 (155.8–171.6) 163.2 (154.5–171.3) 0.378
BMI, median (IQR) (kg/m2) 23.8 (21.8–25.9) 24.9 (22.9–26.3) 0.006
Table 1. Summary of baseline characteristics of study subjects. BMI, body mass index; IQR, interquartile
range.
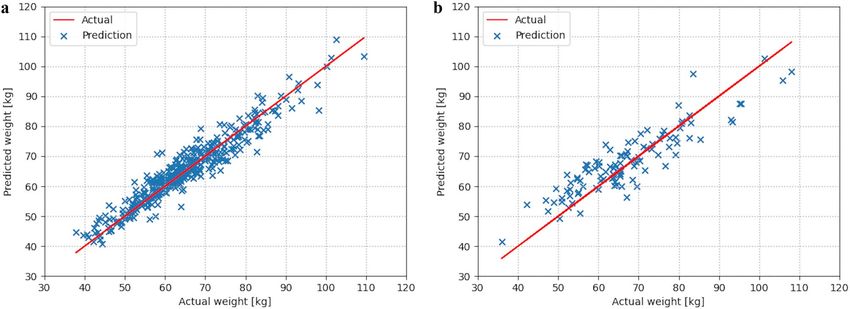
Figure 3. Scatterplots comparing the actual and predicted body weights in (a) chest and (b) abdominal
datasets.
N
1
MAE = |yi −
yi | (1)
N
i=1
where N is the total number of subjects, yi is the actual body weight, and ^yi is the predicted body weight.
Statistical analysis. Statistical analysis was performed using a free statistical software (R version 3.5.1,
The R Foundation for Statistical Computing, Vienna, Austria). The baseline characteristics of the study subjects
were expressed as the median (interquartile range) because the data were not normally distributed according to
the Shapiro–Wilk test. The baseline characteristics were compared between training/validation data and testing
data subsets by using the Mann–Whitney U-test for continuous variables. The chi-square test was used for cat-
egorical variables. The correlation between the actual and predicted body weights was evaluated by calculating
Spearman’s rank correlation coefficient. The Kruskal–Wallis test was used to compare the actual body weights
between the underestimated (error > − 5 kg), acceptable (error ≤ ± 5 kg), and overestimated (error > 5 kg) cases
for the actual body weight, and pairwise comparisons were made by performing the Steel–Dwass test. The level
of significance was as a two-sided α ≤ 0.05.
Results
Table 1 shows the baseline characteristics of the study subjects for chest and abdominal datasets. Of note, there
are no pediatric subjects in our datasets as all subjects are aged at least 24 years for chest datasets or 25 years for
abdominal datasets. This restricts the domain of our models to an adult population. The study subjects in the
two subsets showed similar demographics in both chest and abdominal datasets, even though the subjects in the
test abdominal datasets appeared to be slightly older (p = 0.019) and showed higher body mass index (p = 0.006).
We evaluated the created models using the testing sets for predicting body weight from CT scout images.
Figure 3 shows scatterplots comparing the actual and predicted body weights in testing sets. There were strong
correlations between the actual and predicted body weights (ρ = 0.947, p < 0.001 for chest; ρ = 0.869, p < 0.001
for abdomen). Figure 4 shows histograms of the value of the differences between the actual and predicted body
Scientific Reports | (2021) 11:15627 | https://doi.org/10.1038/s41598-021-95170-9 4
Vol:.(1234567890)www.nature.com/scientificreports/
Figure 4. Histograms of the value of the differences between the actual and predicted body weights in (a) chest
and (b) abdominal datasets.
Region Group n Actual body weight, median (IQR) (kg) P
Underestimated 26 76.5 (71.7–83.4) < 0.001
Chest Acceptable 302 63.8 (57.0–70.8)
Overestimated 39 59.5 (55.0–66.5)
Underestimated 16 81.1 (71.0–93.8) < 0.001
Abdomen Acceptable 59 65.3 (61.5–72.6)
Overestimated 29 56.9 (52.2–61.7)
Table 2. Comparisons of actual body weights between underestimated, acceptable, and overestimated cases.
IQR, interquartile range. The underestimated group was defined as the subjects with > − 5 kg from their actual
body weight. The acceptable group was defined as the subjects within ± 5 kg from their actual body weight.
The overestimated group was defined as the subjects > 5 kg from their actual body weight. The p-values were
calculated by performing the Kruskal–Wallis test.
Region Pair t p
Underestimated versus acceptable 4.990 < 0.001
Chest Underestimated versus overestimated 4.533 < 0.001
Acceptable versus overestimated 1.776 0.178
Underestimated versus acceptable 4.359 < 0.001
Abdomen Underestimated versus overestimated 4.767 < 0.001
Acceptable versus overestimated 3.764 < 0.001
Table 3. Pairwise comparisons of actual body weights between underestimated, acceptable, and overestimated
cases. The underestimated group was defined as the subjects with > − 5 kg from their actual body weight. The
acceptable group was defined as the subjects within ± 5 kg from their actual body weight. The overestimated
group was defined as the subjects with > 5 kg from their actual body weight. The p-values were calculated by
performing the Steel–Dwass test.
weights. We counted the number (%) of subjects within acceptable error defined as 5 kg and 10 kg increments
from actual body weight. The number (%) of subjects within ± 5 kg from the actual body weight were 302/367
(82.3%) for chest and 59/104 (56.7%) for abdominal datasets. The number (%) of subjects within ± 10 kg from
the actual body weight were 361/367 (98.4%) for chest and 95/104 (91.3%) for abdominal datasets. To evaluate
the performance of the regression models, we calculated the MAE for chest and abdominal datasets. The MAEs
were 2.75 kg and 4.77 kg for chest and abdominal datasets, respectively.
To analyze underestimated and overestimated subjects, we compared the actual body weights between the
underestimated (error > –5 kg), acceptable (error ≤ ± 5 kg), and overestimated (error > 5 kg) subjects (Tables 2
and 3). The underestimated subjects showed higher actual body weights than the acceptable subjects in both
the chest and abdominal datasets (p < 0.001 for both), whereas the overestimated subjects showed lower actual
Scientific Reports | (2021) 11:15627 | https://doi.org/10.1038/s41598-021-95170-9 5
Vol.:(0123456789)www.nature.com/scientificreports/
Figure 5. Representative cases of our CNN-based approach for predicting body weight in chest datasets. The
upper row shows the actual body weight, and the lower row shows the predicted body weight from our CNN-
based method.
body weights than the acceptable subjects in the abdominal datasets (p < 0.001). No statistically significant dif-
ference was observed between the acceptable cases and the overestimated cases in the chest datasets (p = 0.178).
Representative cases of our CNN-based approach for predicting body weight from CT scout images are shown
in Figs. 5 and 6. The implementation time was very short, which was only 6.7 s for an image from image reading
to providing predicted body weight.
Discussion
Body weight is an indispensable parameter for determination of contrast medium dose, appropriate drug dos-
ing, or management of radiation dose. In this study, the predicted body weight, by applying a deep-learning
technique to chest and abdominal CT scout images, was found to be highly correlated with the actual body
weight. Our models showed the MAE within 5.0 kg in both chest and abdominal datasets, even with a relatively
modest training dataset size.
To the best of our knowledge, this is the first attempt to predict the body weight from CT scout images by
applying a deep-learning technique. In contrast, previous studies have required diagnostic abdominal CT i mages9
or effective mAs from whole-body scan data10 for body-weight estimation. This indicates that our CNN-based
method can predict the patient body weight, even when non-contrast CT images do not exist. In clinical radiol-
ogy, we frequently perform contrast-enhanced CT immediately after the first “scout” or “localizer” acquisition
without acquiring non-contrast CT images. Thus, our method could be applicable to more cases than previous
proposed methods.
Fernandes et al. reported that patients’ own weight estimates are likely to be more accurate than those of physi-
cians or nurses, if weight measurement on an accurate scale is impractical7. However, patients in emergency care
often have difficulty in reporting their own body weight. A bedside method using supine thigh and abdominal
circumference measurements by Buckley et al. yielded greater accuracy than visual body weight estimates made
by physicians and nurses, but deviations > ± 10 kg from the measured body weight were still noted in 15% of
male patients and 27% of female patients8. An equation based on effective mAs by Gascho et al. revealed strong
correlation (r = 0.969) between measured and predicted body weights for both women and men, with a post-
mortem interval of < 4 d ays10. The present study showed that deviations > ± 10 kg from the actual body weight
were noted in only 1.6% of the subjects for the chest and 8.7% for the abdomen. The correlations between the
actual and predicted body weights were strong in both the chest and abdomen. These results indicate that our
CNN-based method shows potential use in predicting patient body weight accurately in an adult populations
with unknown bodyweights.
In this study, better correlation was observed in chest scout images than in abdominal scout images. One
possible reason was that the dataset size was smaller for the abdominal scout images than for the chest scout
images. Generally, the accuracy of a deep-learning neural network model is largely dependent on the size of
high-quality initial training datasets22–24. Conversely, a previous study by Fukunaga et al. has shown a similar
Scientific Reports | (2021) 11:15627 | https://doi.org/10.1038/s41598-021-95170-9 6
Vol:.(1234567890)www.nature.com/scientificreports/
Figure 6. Representative cases of our CNN-based approach for predicting body weight in abdominal datasets.
The upper row shows the actual body weight, and the lower row shows the predicted body weight from our
CNN-based method.
tendency to the present study, in which a better correlation between body weight and effective diameter was
found in chest CT compared to abdominal CT2. Boos et al. also revealed that the effective diameter had a signifi-
cantly better correlation with weight than with body mass index in chest CT scans, whereas it had a significantly
better correlation with body mass index than with weight in abdominal CT s cans3. Surprisingly, it seems that
body weight should therefore be estimated not from the abdominal region but from the chest region, if the scan
range includes the chest region.
To analyze underestimated and overestimated subjects, we compared actual body weights between the under-
estimated (error > − 5 kg), acceptable (error ≤ ± 5 kg), and overestimated (error > 5 kg) cases. As the results,
the underestimated cases showed higher actual body weights than the acceptable cases in both the chest and
abdominal datasets, whereas the overestimated cases showed lower actual body weights than the acceptable cases
in the abdominal datasets. These results mean that the overweight cases tended to be underestimated in both
chest and abdominal datasets, whereas the underweight cases tended to be overestimated only in abdominal
datasets. These phenomena would imply that there was an insufficient overweight or underweight population in
the training/validation sets. Further training with large datasets, including overweight and underweight popula-
tions, should improve the model performance22–24.
There were several limitations in our study. First, sex was not considered in creating models to not reduce
the size of training sets. Small training sets would cause decreased accuracy of the deep-learning neural network
model, as mentioned above. Although an adequate number of datasets to train a medical image deep-learning
system has been previously e xplored22, 25, the current study consisted of hundreds of thousands of images as many
prior studies d id11–14, 17. An equation by Gascho et al. considered sex in body weight estimation using effective
mAs from CT dose modulation, according to the multivariate linear regression analysis10. We found that attenu-
ation characteristics in scout images also appeared to be affected by sex due to the different body compositions,
even among subjects with the same body weight. Therefore, the performance of our models could be improved
by considering sex. Second, we only trained and tested our models on CT scout images of medical checkup
subjects, and our results may not generalize to some clinical settings. For instance, arm raising is occasionally
omitted for trauma patients in emergency care. Moreover, some patients have metallic implants in their bodies,
such as the arms, heart, and spine. These variations were not included in the supervised training datasets, and
therefore, the performance of our models is unclear. Finally, this was a retrospective study using training and
testing sets from a single institution, and the ability of the models to generalize to CT scout images obtained at
external institutions with other machines is unknown. For instance, tube current, reconstruction kernel, and
window settings for scout images vary across institutions with CT scanners made by different manufactures.
Generally, the performance of deep-learning models worsens when applied to previously unseen images. How-
ever, inter-vendor performance of deep learning might be enhanced via fine-tuning the model by using a small
sample of the images from a different m anufacturer26.
Scientific Reports | (2021) 11:15627 | https://doi.org/10.1038/s41598-021-95170-9 7
Vol.:(0123456789)www.nature.com/scientificreports/
Even with these limitations, our study has contributed to development of a time-efficient method for pre-
dicting body weight from CT scout images. In emergency care, such a method can be used to determine the
contrast medium dose for patients who are unresponsive and unable to state their body weight. In practical
terms, deployment of our method in clinical use could be achieved by integrating it as an additional module on
the CT scanner. As soon as a CT scout image is acquired, this module would generate the patient’s body weight
for review by the radiologist or radiological technologist. The radiologists or radiological technologists could
then decide to determine the contrast medium dose. Furthermore, by deploying our method as independent
software, we could retrospectively obtain the patient’s body weights from previously acquired CT images. Such
software could support CT dose management of individual patients. Thus, future research in this area will test
the possibility of building the CNN-based method into a software application with a user-friendly interface.
Conclusion
In this study, we developed and evaluated a CNN-based method using chest and abdominal CT scout images
for predicting body weight. This method demonstrated acceptable accuracy for body-weight estimation and was
highly time efficient. Our CNN-based method has the potential to be deployed in clinical settings in the future
and potentially could be useful for determining the contrast medium dose and CT dose management in adult
patients with unknown body weight.
Data availability
The code generated during the current study is available from the corresponding author on reasonable request.
However, the image datasets presented in this study are not publicly available due to ethical reasons.
Received: 2 May 2021; Accepted: 22 July 2021
References
1. Bae, K. T. Intravenous contrast medium administration and scan timing at CT: Considerations and approaches. Radiology 256,
32–61 (2010).
2. Fukunaga, M. et al. CT dose management of adult patients with unknown body weight using an effective diameter. Eur. J. Radiol.
135, 109483 (2021).
3. Boos, J. et al. Does body mass index outperform body weight as a surrogate parameter in the calculation of size-specific dose
estimates in adult body CT?. Br. J. Radiol. 89, 20150734 (2016).
4. Ghafourian, K. et al. Scout view x-ray attenuation versus weight-based selection of reduced peak tube voltage in cardiac CT angi-
ography. JACC Cardiovasc. Imaging 5, 589–595 (2012).
5. Hall, W. L., Larkin, G. L., Trujillo, M. J., Hinds, J. L. & Delaney, K. A. Errors in weight estimation in the emergency department:
Comparing performance by providers and patients. J. Emerg. Med. 27, 219–224 (2004).
6. Menon, S. & Kelly, A. M. How accurate is weight estimation in the emergency department?. Emerg. Med. Australas. 17, 113–116
(2005).
7. Fernandes, C. M. B., Clark, S., Price, A. & Innes, G. How accurately do we estimate patients’ weight in emergency departments?.
Can. Fam. Phys. 45, 2373–2376 (1999).
8. Buckley, R. G. et al. Bedside method to estimate actual body weight in the Emergency Department. J. Emerg. Med. 42, 100–104
(2012).
9. Geraghty, E. M. & Boone, J. M. Determination of height, weight, body mass index, and body surface area with a single abdominal
CT image. Radiology 228, 857–863 (2003).
10. Gascho, D. et al. A new method for estimating patient body weight using CT dose modulation data. Eur. Radiol. Exp. 1, 23 (2017).
11. Thian, Y. L. et al. Convolutional neural networks for automated fracture detection and localization on wrist radiographs. Radiol.
Artif. Intell. 1, e180001 (2019).
12. Sugimori, H. & Kawakami, M. Automatic detection of a standard line for brain magnetic resonance imaging using deep learning.
Appl. Sci. 9, 3849 (2019).
13. Arab, A. et al. A fast and fully-automated deep-learning approach for accurate hemorrhage segmentation and volume quantifica-
tion in non-contrast whole-head CT. Sci. Rep. 10, 19389 (2020).
14. Duong, M. T. et al. Convolutional neural network for automated FLAIR lesion segmentation on clinical brain MR imaging. AJNR.
Am. J. Neuroradiol. 40, 1282–1290 (2019).
15. Fang, X., Harris, L., Zhou, W. & Huo, D. Generalized radiographic view identification with deep learning. J. Digit. Imaging 34,
66–74 (2021).
16. Sugimori, H., Hamaguchi, H., Fujiwara, T. & Ishizaka, K. Classification of type of brain magnetic resonance images with deep
learning technique. Magn. Reson. Imaging 77, 180–185 (2021).
17. Yasaka, K., Akai, H., Kunimatsu, A., Kiryu, S. & Abe, O. Prediction of bone mineral density from computed tomography: Applica-
tion of deep learning with a convolutional neural network. Eur. Radiol. 30, 3549–3557 (2020).
18. Halabi, S. S. et al. The RSNA pediatric bone age machine learning challenge. Radiology 290, 498–503 (2019).
19. Simonyan, K. & Zisserman, A. Very deep convolutional networks for large-scale image recognition. In Proc. International Confer-
ence on Learning Representations. http://arxiv.org/abs/1409.1556 (2014).
20. Krizhevsky, A., Sutskever, I. & Hinton, G. E. ImageNet classification with deep convolutional neural networks. Commun. ACM
60, 84–90 (2017).
21. Kingma, D. P. & Ba, J. Adam: a method for stochastic optimization. In 3rd International Conference on Learning Representations.
https://arxiv.org/abs/1412.6980 (2015).
22. Cho, J., et al. How much data is needed to train a medical image deep learning system to achieve necessary high accuracy? http://
arxiv.org.abs/1511.06348 (2015).
23. Larson, D. B. et al. Performance of a deep-learning neural network model in assessing skeletal maturity on pediatric hand radio-
graphs. Radiology 287, 313–322 (2018).
24. Sugimori, H. Evaluating the overall accuracy of additional learning and automatic classification system for CT images. Appl. Sci.
9, 682 (2019).
25. Figueroa, R. L. et al. Predicting sample size required for classification performance. BMC Med. Inform. Decis. Mak. 12, 1–10 (2012).
26. Alis, D. et al. Inter-vendor performance of deep learning in segmenting acute ischemic lesions on diffusion-weighted imaging: a
multicenter study. Sci. Rep. 11, 1–10 (2021).
Scientific Reports | (2021) 11:15627 | https://doi.org/10.1038/s41598-021-95170-9 8
Vol:.(1234567890)www.nature.com/scientificreports/
Acknowledgements
The authors would like to thank Enago (www.enago.jp) for the English language review.
Author contributions
S.I. contributed to the study design, data collection, algorithm construction, and the writing and editing of
the article; M.H. carried out the data collection, and the reviewing and editing of the article; H.S. performed
supervision, project administration, and reviewing and editing of the article. All authors read and approved the
final manuscript.
Competing interests
The authors declare no competing interests.
Additional information
Correspondence and requests for materials should be addressed to H.S.
Reprints and permissions information is available at www.nature.com/reprints.
Publisher’s note Springer Nature remains neutral with regard to jurisdictional claims in published maps and
institutional affiliations.
Open Access This article is licensed under a Creative Commons Attribution 4.0 International
License, which permits use, sharing, adaptation, distribution and reproduction in any medium or
format, as long as you give appropriate credit to the original author(s) and the source, provide a link to the
Creative Commons licence, and indicate if changes were made. The images or other third party material in this
article are included in the article’s Creative Commons licence, unless indicated otherwise in a credit line to the
material. If material is not included in the article’s Creative Commons licence and your intended use is not
permitted by statutory regulation or exceeds the permitted use, you will need to obtain permission directly from
the copyright holder. To view a copy of this licence, visit http://creativecommons.org/licenses/by/4.0/.
© The Author(s) 2021
Scientific Reports | (2021) 11:15627 | https://doi.org/10.1038/s41598-021-95170-9 9
Vol.:(0123456789)You can also read