A novel control technique for a single-phase grid-tied inverter to extract peak power from PV-Based home energy systems
←
→
Page content transcription
If your browser does not render page correctly, please read the page content below
AIMS Energy, 9(3): 414–445.
 DOI: 10.3934/energy.2021021
 Received: 04 November 2020
 Accepted: 06 February 2021
 Published: 06 April 2021
http://www.aimspress.com/journal/energy

Research article

A novel control technique for a single-phase grid-tied inverter to
extract peak power from PV-Based home energy systems

Hari Charan Nannam* and Atanu Banerjee

Department of Electrical Engineering, National Institute of Technology, Meghalaya, Shillong,
Meghalaya, India, 793003

* Correspondence: Email: haricharan@nitm.ac.in.

Abstract: In this paper, a single-phase full-bridge grid-tied inverter is considered for home-based
photovoltaic applications. The dc-dc converter is inevitable in boosting the voltage and tracking the
maximum power from the photovoltaic source. As a result, the size and cost of the home-based
photovoltaic grid-tied systems increases. A dc-dc converter is eliminated in this work, and the PV
voltage is considered as the input voltage to a single-phase full-bridge inverter system. Also, to
overcome the demerits of traditional peak power techniques, a fuzzy logic-based peak power
controller is proposed. A fuzzy logic-based dc-link voltage controller is also proposed to overcome
the conventional PI-based dc-link voltage controller's demerits. Primarily the theoretical concept is
validated by using the MATLAB/SIMULINK tool for simulation analysis. The Spartan-6 FPGA
control board is used to implement the controller program. A laboratory prototype is fabricated in
the experimental laboratory to verify the theoretical and simulation analysis. Different case studies
are comprehended in this work to present the robustness of the recommended control scheme.

Keywords: dc-link voltage control; fuzzy logic controller; maximum power tracking; photovoltaics;
single-phase inverter

Abbreviations: PV = Photovoltaic; Lg = Grid-side inductor; SPFBI = single-phase full-bridge
inverter; S1,S2,S3,S4 = Semiconductor switches of the SPFBI; MPPT = Maximum power point
tracking; P&O = Perturb and observe; SPFBI = single-phase full bridge inverter; NL = Negative
large; NS = Negative small; Z = zero; PS = Positive small; PL = positive large; ΔP = crisp value of
the output; K = weight factor; ΔPi = membership value corresponding to ΔP; NH = Negative high;
NL = Negative low; Z = zero; PH = Positive high; PL = Positive low

415

1. Introduction

 The increase in electricity demand, environmental effects, limited reserves, and the price hikes
of non-renewable energy sources made the entire world explore alternative energy sources. The
power generated from renewables became more popular due to their omnipresence and eco-
friendliness. Amidst clean energy sources, photovoltaic (PV) based electric power generation
became more popular due to its availability, no environmental ramifications, less cost of operation
and maintenance. PV systems' applications can be broadly categorized into two divisions: Grid-tied
systems and stand-alone power generators [1]. The autonomous systems are applicable for small
power applications with battery bank assistance, where grid-tied systems are suitable for high-power
applications without any battery assistance [1]. The PV systems are connected to the grid using the
single-stage and two-stage architectures [2]. The choice of the single- or two-stage design depends
on the availability of the PV panels. The two-stage architecture consists of PV panels, dc-dc
converter, dc-ac converter, and the grid with all the necessary accessories. Due to a boost/buck
converter and inverter system, a system is called a two-stage approach. The conventional grid-tied
two-stage system comprises the maximum power point tracking controller on the source side, the
current controller that deals with power factor correction on the grid side, and the dc-link voltage
regulator that balances the source and grid power.
 On the other hand, the single-stage converter consists of a PV system, a single-phase inverter,
and the grid, as shown in Figure 1. The capacitor ‘c’ supports the PV voltage, and the switches S1, S2,
S3, S4 are triggered by the pulses generated by an internal control scheme. The entire system is
integrated into the grid using the grid-side inductor (Lg). The advantages of the single-stage system
over the two-stage system are enhanced efficiency, less size, and cost. Especially in home-energy
based PV systems, the primary concern is the size and the price, so a single-stage system is more
beneficial than the two-stage method. In the single-stage system, the inverter itself has to tackle peak
power, dc-link voltage regulation, and power factor correction.

 Figure 1. A single-stage grid-tied PV system.

AIMS Energy Volume 9, Issue 3, 414–445.
416

 Table 1. The table of comparison between the traditional and fuzzy logic controller.

Peak power technique Dependence on PV A/D Speed of convergence Complexity Sensors
Perturb and observe × A&D Depends Less V,I
Incremental conducance × D Depends Moderate V,I
Fractional open circuit voltage √ A&D Moderate Less V
Fractional Short circuit current √ A&D Moderate Moderate C
Fuzzy logic √ D Speeder More Depends
Neural Network √ D Speeder More Depends
Sliding mode control × D Speeder Moderate V, I

 The hill-climbing MPPT algorithm tracks the peak power by perturbing the duty ratio [4–9],
while the P&O algorithm perturbs the voltage[10–12]. The hill-climbing MPPT algorithm and P&O
can fail when the atmospheric conditions are changing rapidly. These MPPT techniques require two
sensors to sense the voltage and current from the PV panel. The need for sensors also depends on the
topology implemented; for instance, a voltage sensor is enough for the system prescribed in [13].
The incremental conductance states that the peak power may be obtained when the power vs. voltage
curve slope is zero [14,15]. The swiftness of the peak power tracking depends on the size of the
incremental parameter. But the larger size of the incremental parameter may lead the peak power
point to oscillate around it. The incremental conductance concept requires a sensor to sense the
voltage and another to trace PV panels' current. The fractional open circuit voltage emerged due to
the linear coordination between the voltage at peak power and open-circuit voltage [16–18]. One of
the demerits of the system is power loss for a moment. This demerit can be overpowered by the pilot
cells, which have to be cautiously incorporated to safeguard the PV characteristics [16]. Since it is an
approximation technique, technically speaking, it cannot steadfastly trace the peak power. It also
adds complexity in control along with unnecessary loss in power. The fractional short circuit concept
is based on the linear coordination between the current at the peak power and the short circuit current
at variable climatic conditions[19,20]. An auxiliary switch is required to short the array to calculate
the short circuit current, which increases the component number and price of the system. The
flexibility and the incorporation of micro-controllers made fuzzy logic acquire a popular position
over the other controllers[21–28]. The non-requirement of exact mathematical modeling,
implementation with vague inputs, and capability to deal with nonlinearities made fuzzy control
acquire high popularity among the controllers. It was proven to work accurately during rapidly
changing climatic situations. The optimum performance of the fuzzy logic controller depends on the
expertise of the user. The fuzzy logic control implemented in [22] reflects the convergence's
swiftness with limited oscillations around the peak powerpoint. The neural network-based peak
power controller is an adaptive technique developed along with a fuzzy logic controller [29–31]. It is
a three-layered network that outputs a duty cycle to rigger the semiconductor switch in dc-dc
converters. The performance of the neural network based-peak power control algorithm depends on
the hidden layers and its training. A sliding mode observer concept [32] is proposed in the literature,
and its controller state equations consist of uncertainty, which increases the system's complexity. The
table of comparison between different peak power algorithms is presented in Table 1. In this paper, a
fuzzy logic controller-based peak power controller and dc-link voltage controller are designed to
track the PV source's peak power and to regulate the voltage across the capacitor. The traditional

AIMS Energy Volume 9, Issue 3, 414–445.

417

capacitor voltage regulator embraces a traditional proportional and integral (PI) controller and gives
rise to direct-axis reference current.
The main contributions of the paper are:
1. A fuzzy rule-based regulator is modeled, and the rules are framed to track the peak power and
control the dc-link voltage.
2. The steady-state and transient analysis is investigated to prove the robustness of the control
scheme.
3. The bidirectional operation of the inverter is investigated to facilitate the usage of the dc load.
4. The effects of the load and the grid on the PV system and the effects of the PV system variations
on the load and the grid are analyzed.
 The work's organization is as follows: the mathematical modeling of the single-phase inverter,
the modeled control design, results and discussion, conclusion, acknowledgment, nomenclature, and
references.

2. Mathematical modelling of a single phase inverter

 In this paper, a full bridge hybrid inverter is implemented. It was designed by a renowned
engineer, Mcmurray [33]. A single-phase full-bridge inverter (SPFBI) can be contemplated as a
combination of two half bridge single phase inverters that share a common dc voltage source. This
topology overcomes the demerits of a single-phase half-bridge inverter (SPHBI), which incorporates
a dual dc source. The SPFBI consists of four power electronic switches (S1–S4), as shown in Figure 2.
When switches S1, S2 are turned-on, SPFBI generates +Vdc, and switches S3, S4 generates -Vdc. The
switches in the same leg should not operate simultaneously, which leads to a short circuit across the
portion. Unipolar, bipolar, and hybrid modulation schemes are the three different kinds of schemes
available for a single phase's full bridge inverter. In this paper, a unipolar modulation scheme is
implemented. SPFBI comprises Vao and Vbo as pole voltages, which will be in the form of a square
waveform, but consists of a phase difference. The pole voltage Vao and Vbo can be written as

 ∑ , , , …∞ sin (1)

where n = order of harmonic

 ∑ , , , …∞ sin (2)

 The difference between two pole voltages gives the line voltage of a single-phase full-bridge
inverter (SPFBI). The circuit diagram of a conventional SPFBI has shown in Figure 2.
 The merits of implementing the SPFBI when compared with single-phase half-bridge
inverter (SPHBI) are:
1. Single dc source whereas the SPHBI consists of two sources
2. An enhanced output voltage with dual gain
3. An increased efficiency and quadrupled power transfer
 The demerits of the SPFBI are the usage of more passive components and an increased
switching loss.

AIMS Energy Volume 9, Issue 3, 414–445.
418

 Figure 2. A Conventional SPFBI (a) circuit diagram (b) pulse generation.

3. Proposed control structure for a SPFBI in homemade energy applications

 The proposed structure, along with the internal control strategy, is shown in Figure 3. The
proposed control strategy comprises an MPPT controller, dc voltage, and current regulator. A
perturb and observe (P&O) MPPT is conventionally employed due to its independence on the PV
array, the possibility of implementation on digital and analog test benches, but it suffers from many
disadvantages. The main demerits of the P&O algorithm can be listed as:
1. The peak power point oscillates around the peak power [34]
2. The P&O algorithm fails to track the peak power at abrupt changes in atmospheric conditions [34]
3. P&O algorithm is inaccurate [34]
4. Decreased system efficiency [35]
 A fuzzy logic-based controller is implemented to track the PV source's maximum power to
overcome the demerits mentioned above. The detailed analysis of the proposed fuzzy logic peak
power controller and voltage regulator across the dc-link capacitor is provided in the subsequent
sections.

AIMS Energy Volume 9, Issue 3, 414–445.
419

 (a)

 (b)

 Figure 3. (a) The complete architecture of the proposed system (b) A proposed adaptive
 control techniques to regulate the dc-link voltage controller.

3.1. Fuzzy logic based peak power controller

 The proposed control scheme implements the concept of a conventional and straightforward
P&O MPPT algorithm adaptively to overcome the undesired oscillations at the peak power point.
The fuzzy logic control algorithm perturbs the PV voltage to acquire the preferred performance.
According to the application, the main advantage of the recommended fuzzy logic-based MPPT is its
adaptiveness in adjusting the reference voltage of the dc-link voltage across the dc-link capacitor or
the duty cycle. The fuzzy logic controller reduces the error during the steady-state and the erroneous
operation at rapid atmospheric conditions. Though the adaptive fuzzy logic controller possesses
many advantages, it suffers from the demand for a considerable memory-based, very high-speed

AIMS Energy Volume 9, Issue 3, 414–445.

420

processing system, and complexity. The block diagram of the fuzzy-based controller to follow the
peak power is presented in Figure 4. The fuzzy logic controller consists of the input E(n), the change
in the input ΔE(n), which is obtained by the difference of the information and its delay E(n-1). The
inputs E(n) and the deviation in the input ΔE(n) are considered as the inputs to the fuzzy system. The
output of the fuzzy system is P(n), which is obtained from the summation of deviation in the output
ΔP(n) and the delay P(n-1). The formulae governing the variations of inputs and outputs are given as
below:
 ∆ 1 (3)
 ∆ 1 (4)
 The fuzzy logic control works in a three-step manner. (i) Fuzzification (ii) Rule-based fuzzy
control algorithm and (iii) Defuzzification. The detail analysis of the important steps included in the
fuzzy logic controller is elucidated below:
(i) Fuzzification: The fuzzy logic control process requires the control algorithm to be designed by
the implication of fuzzy set theory that consists of linguistic variables. The linguistic variables,
along with the membership functions, are presented in Figure 5. Based on the consideration of the
small steady-state error, the assigned membership function reduces the struggle to deduce the
output.
(ii) Rule-based fuzzy control algorithm: A set of rules bounds the fuzzy-based algorithm to trace the
required response. Table 2 provides an insight for the rule base to track the peak power for
corresponding solar radiation. The variables E and ΔE represent the error and change in error for
PV power and voltage. In contrast, NL variable represents a negative large, NS Represents a
negative small, Z for zero, PS for a positively small, and PL represents a positive large. The
linguistic variables are arranged in IF-THEN statements to form the rules. For instance,
Rule-1: IF E is NL and ΔE is Z, THEN ΔP is NL
Rule-2: IF E is PS and ΔE is PS, THEN ΔP is Z.
(iii) Defuzzification: The final stage of the fuzzy logic system is defuzzification, which calculates a
crisp value for the fuzzy logic processor's output. Traditionally, two methods are being used to trace
the production's crisp value, namely the center of area method and the mean of the maximum
method. In this paper, the center of area method is used to achieve high accuracy.
 The center of area method can be computed as:
 ∑ ∆
 ∆ ∑
 5

where ΔP = crisp value of the output; K = weight factor; ΔPi = membership value corresponding to ΔP.
 The working principle of the proposed fuzzy logic controller is elucidated as:
Step-1: Measure the values of PV voltage, current at all irradiations and compute the generated PV
power.
Step-2: compute the change in power (∆PPV) and PV voltage (∆VPV) at the present iteration and
previous iteration.
Step-3: Then calculate the change in power and voltage that serves as inputs for the fuzzy logic
system to generate the reference dc-link voltage.
Step-4: Three membership-based fuzzy interface system (FIS) with triangular shape is used to
formulate the rules.

AIMS Energy Volume 9, Issue 3, 414–445.

421

Step-5: Defuzzify the system for the duty cycle and finally update the PV voltage. Continue the
process until the peak power point is reached.
 The entire process of operation is presented in the flow chart as Figure 6 for better
understanding.

 Figure 4. The control design of the fuzzy based peak power tracking controller.

 Figure 5. The linguistic variables along with the membership function.

AIMS Energy Volume 9, Issue 3, 414–445.
422

 Figure 6. The algorithm of proposed Fuzzy based MPPT controller.

 Table 2. The table of rules for the proposed Fuzzy based MPPT controller.

 ∆E NL NS Z PS PL
E
 NL Z Z NL NL NL
 NS Z Z NS NS NS
 Z NS Z Z Z PS
 PS PS PS PS Z Z
 PL PL PL PL Z Z

AIMS Energy Volume 9, Issue 3, 414–445.
423

3.2. Fuzzy logic based dc-link voltage controller

 The dc-link voltage regulator's primary objective is to maintain a constant voltage across the dc-
link capacitor to maintain a proper power balance between the mains and the grid [36]. The block
diagram for the conventional voltage regulator to control the capacitor voltage is presented in Figure 7.
The major drawback of the traditional PI regulator demands preciseness in mathematical modeling,
making the system more complicated and inaccurate. In contrast, the fuzzy logic controller is an
intelligent controller that doesn’t require a complete system model as it is dependent on the set of
rules to govern the system. The block diagram of the fuzzy-based capacitor voltage controller is
demonstrated in Figure 8. The reference dc voltage generated from the MPPT controller is compared
with the measured dc-link voltage, and the generated error is considered to be the input for the fuzzy
system. The error is the delay for t = 1 sec. The difference between the error E(k) and the delayed
error E(k-1) generates the deviation in error ΔE(k), and the same is considered an input to the fuzzy
system. The rules mentioned in Table 3 are used to generate the consistent dc-link voltage even in
the transients' condition. The defuzzification process developed the output's crisp value to finally
provide the reference direct-axis current to control the current controller.

 Figure 7. The conventional dc-link capacitor voltage controller.

 Figure 8. The fuzzy based capacitor voltage controller.

AIMS Energy Volume 9, Issue 3, 414–445.
424

 Table 3. The table of rules for the proposed Fuzzy based dc-link voltage regulator.

 ∆E NH NL Z PH PL
E
 NH NH NH NH NL Z
 NL NH NH NL Z PL
 Z Z NH Z PL PH
 PH NS Z PL PH PH
 PL Z PL PH PH PH

where NH is negative high, NL is negative low, Z = zero, PH = Positive high, PL = Positive low

4. Results and discussion

 The results and discussion is carried in two categories: (i) simulation analysis (ii) experimental
analysis

(i) Simulation analysis:

(a) Analysis of variable irradiance at the no-load condition:
 The entire simulation is implemented using MATLAB/SIMULINK, and the obtained results
prove the working of a robust controller. The parameters used in the simulation were tabulated in
Table 4. The variable irradiance condition is presented in Figure 9. In this paper 1000 W/sq.mt, 750
W/sq.mt, 500 W/sq.mt, 250 W/sq.mt are considered.

 Figure 9. Irradiance Vs Time.

 As the solar radiation changes, the generated PV current and the PV voltages vary, as seen in
Figure 10. The irradiance is made to change at time t = 2 sec., 4 sec., 6 sec., and 8 sec. The voltage

AIMS Energy Volume 9, Issue 3, 414–445.
425

across the PV panels are connected directly to the SPFBI. As a result, the voltage across the
capacitor needs to be regulated, and the same is the PV voltage. The PV voltage remained stable
during transients, whereas the PV current underwent rigorous transitions during the irradiance
change, and it is presented in Figure 10. During solar radiation change, the voltage across the
capacitor experiences a voltage undershoot, decreasing irradiance and overshoot at the sudden
increase in irradiance.
 The transitions in the capacitor voltage s presented in Figure 11. During times t = 4 sec., 6 sec.,
and 8 sec., the transients are presented in the zoomed format for straightforward elucidation. The
constant voltage across the capacitor is due to the fuzzy logic control's robust and adaptive nature
and the created rule base. Since the voltage across the capacitor is constant, the inverter generates a
voltage waveform of the same magnitude with a square shape. The filters that are used at the grid-
side converts into sinusoidal quantity, as shown in Figure 12. The voltage generated by the inverter
and the filtered voltage should be in the same phase. According to Figure 12, the filtered voltage and
inverter voltage are in existed in the same phase. The modulation index at variable irradiance is
presented in Figure13. According to the irradiance change, the modulation index waveform remained
changed and provided the inverter's necessary pulses.

 Figure 10. PV voltage (V) and current (I) Vs Time.

AIMS Energy Volume 9, Issue 3, 414–445.
426

 Figure 11. Dc-link voltage Vs Time.

 Figure 12. Phase voltage of the inverter Vs Time.

 The reference waveform generated out of the modulation index is presented in Figure 14. The
modulation waveform is compared with the carrier waveform of frequency 3750 Hz to generate the
pulses shown in Figure 15.

AIMS Energy Volume 9, Issue 3, 414–445.
427

 Figure 13. Modulation index Vs Time.

 Figure 14. Modulation waveform Vs Time.

AIMS Energy Volume 9, Issue 3, 414–445.
428

 Figure 15. Pulse train Vs Time.

 The internal control analysis waveforms are also presented for the beer investigation and the
control scheme's robustness. The direct axis current waveform (reference) generated out of dc-link
voltage regulator, and the actual direct axis current is presented in Figure 16. The fuzzy logic control
regulated the voltage across the capacitor and generated the direct axis reference current, where the
actual current is the direct axis component of grid current. The currents are compared and tuned
perfectly by using a PI controller in the current controller. As a result, the error between the
reference and the actual became zero, as shown in Figure 17. Similarly, the current reference and the
actual current of the quadrature axis are compared and tuned using a PI tuner to obtain a zero error,
as shown in Figure 18.

 Figure 16. The direct axis reference waveform and the actual waveform Vs time

AIMS Energy Volume 9, Issue 3, 414–445.
429

 Figure 17. The quadrature axis reference waveform and the actual waveform Vs time.

 The grid voltage and the grid currents are presented in Figures 18 and 19.

 Figure 18. Vgrid Vs Time.

AIMS Energy Volume 9, Issue 3, 414–445.
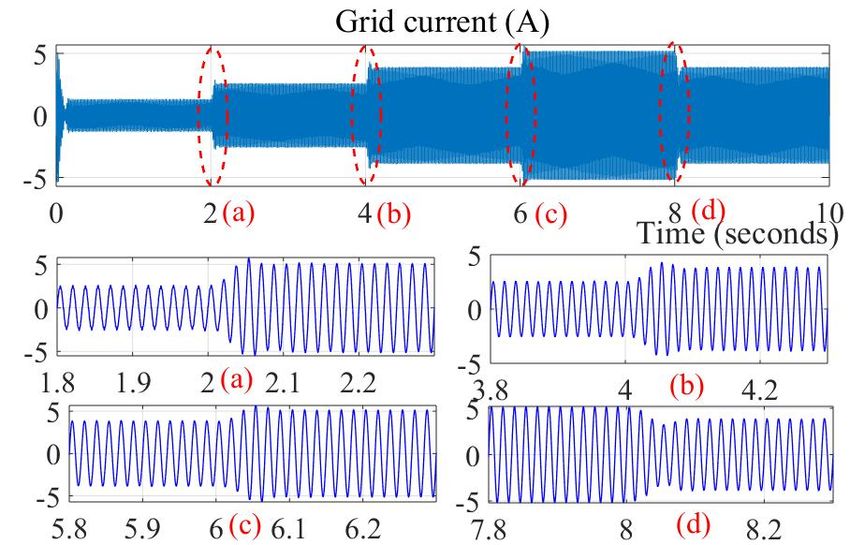
430

 Figure 19. The transition in grid current during the change in irradiance.

 The grid current underwent the transitions at time t = 2 sec., 4 sec., 6 sec., and 8 sec. At these
time instants, the irradiance is varied. A constant current flow into the grid has to be maintained by
the current controller and the internal control strategy waveforms presented in Figure 16, and Figure
17 is responsible for maintaining it. The dc-link voltage controller has to bear the constant dc-link
voltage so that irradiance change will be reflected on the current contrtoller and the waveform in
Figure 19 is due to its phenomenon. The zoomed version of the transitions are represented in Figure
19 as (a), (b), (c), (d) for better discretion.
(b) The analysis of variable irradiance along with dc load:
 A dc load 500 W and 100 W are connected across the capacitor, and they turned-on at
time t = 3 sec., and t = 5 sec. The voltage across the capacitor experienced transients during the load
change but was controlled by the fuzzy logic controller to remain stable, as presented in Figure 20.

AIMS Energy Volume 9, Issue 3, 414–445.
431

 Figure 20. Transients in capacitor voltage during dc load transient.

 Figure 21. Transients in grid current during dc load transient.

 Since the dc-link voltage regulator's effect has to be compensated by the current regulator, it
controls the grid current to maintain constant power flow. As a result, the grid's current experiences a
transient during the load transient and retains to its normal position once it is removed, as shown in
Figure 21.

AIMS Energy Volume 9, Issue 3, 414–445.
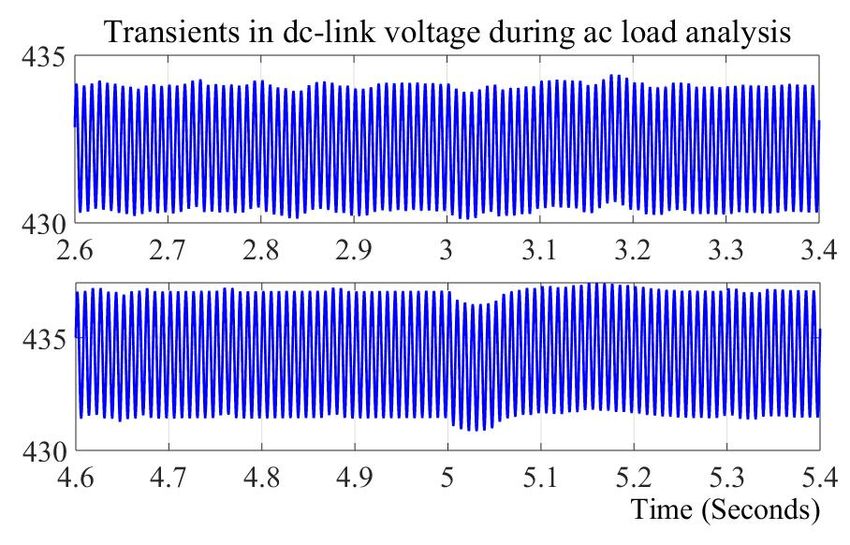
432

(c) The analysis of variable irradiance along with ac load:
 A variable ac load is connected across the grid terminals and are switched on at t = 3 sec. and =
5 sec.

 Figure 22. Transients in capacitor voltage during ac load transient.

 Figure 23. Transients in grid current during ac load transient.

 The ac load is turned on at t = 3 sec and 5 sec. The dc-link voltage experiences transients at the
instant of load turned on, and it is brought to its normal position by an adaptive fuzzy logic controller.
Since the power has to be maintained constant and the grid voltage is stable, the current controller

AIMS Energy Volume 9, Issue 3, 414–445.
433

regulates the grid current, as shown in Figure 23.
(d) The analysis of variable irradiance along with grid disturbances:
 The study of grid disturbances on the adaptive fuzzy logic dc-link voltage regulator is presented
in this section. The voltage is decreased by 20% by its nominal value, representing the voltage sag at
time t = 2.5 sec. Its nominal value is increased by 20%, representing voltage swell at time t = 5 sec.
The zoomed version of the voltage sag and swelled at the time instants are presented in Figure 24.

 Figure 24. Analysis of voltage sag and swell on grid voltage.

 The effect of grid disturbances on the voltage across the capacitor is presented in Figure 25. The
voltage across the capacitor is perturbed at the time instants t = 2.5 sec., 5 sec., and 7.5 sec. The
voltage experiences voltage overshoot at the instant of voltage sag and voltage undershoot shoot at
the moment of a voltage swell, as shown in Figure 25. The adaptive fuzzy logic controller addresses
the source side's issues and the grid side disturbances efficiently. Similarly, the grid frequency is
increased by three times (150 Hz), as shown in Figure 26 and the voltage across the capacitor during
this disturbance is analyzed in Figure 27.

AIMS Energy Volume 9, Issue 3, 414–445.
434

 Figure 25. The analysis of voltage across the capacitor during voltage sag and swell.

 Figure 26. The analysis of grid voltage during third harmonic injection.

AIMS Energy Volume 9, Issue 3, 414–445.
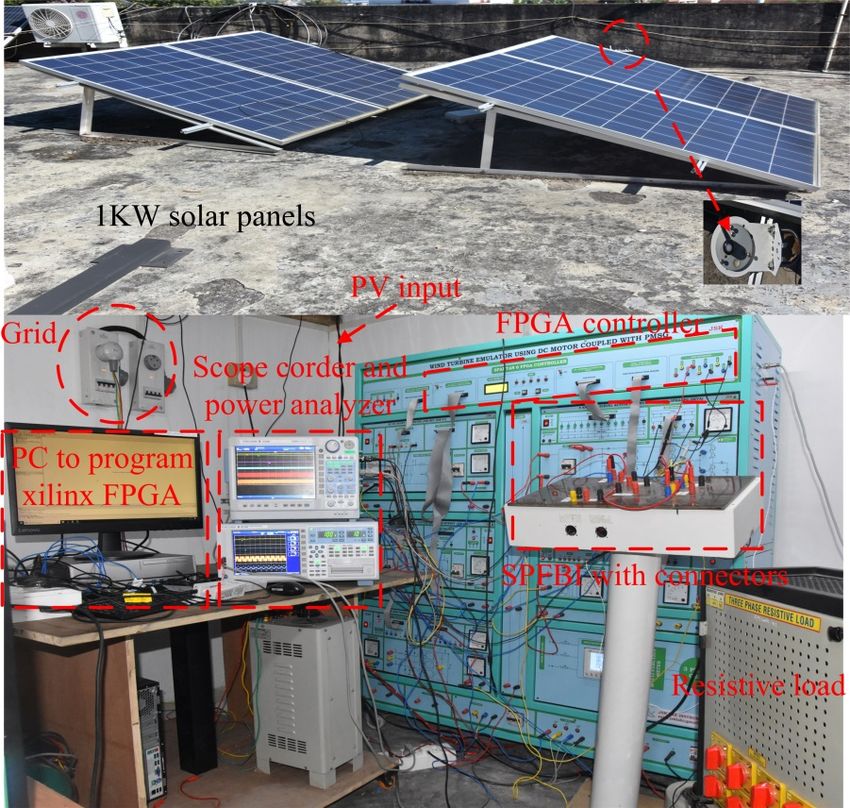
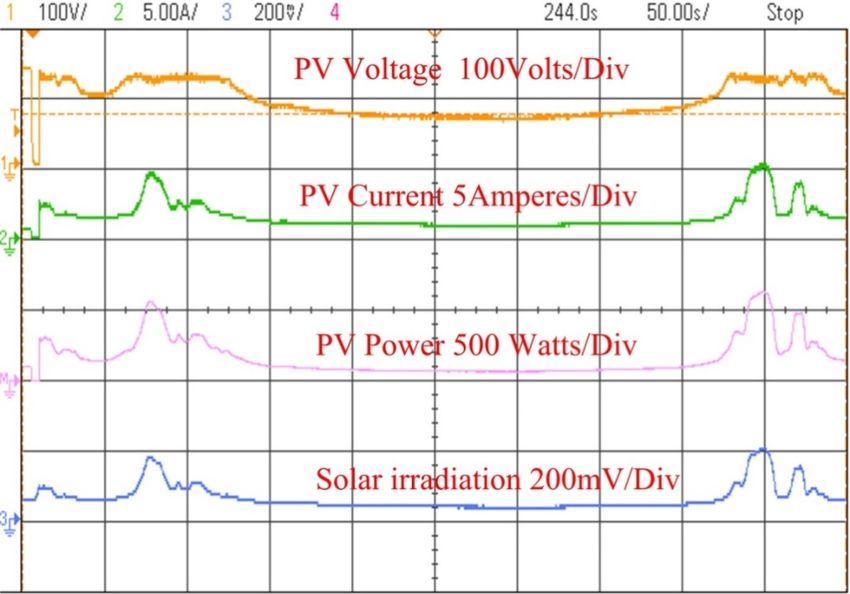
435

 Figure 27. The analysis of voltage across the capacitor during the third harmonic injection.

 Figure 28. Power output from PV array Vs Time.

 The power generated by the PV panels at variable irradiance is presented in Figure 28. The
adaptive fuzzy logic controller employed to track the peak power improved the system's efficiency
by transferring the maximum power to the grid with reduced power loss.

(ii) Experimental analysis:

 A laboratory design is fabricated to analyze the theoretical results is shown in Figure 29. The
experimental prototype consists of 1KW PV panels with an SP-110 pyranometer made from the
apogee instruments, as shown in Figure 29. SP-110 is a self-powered, heater less pyranometer
designed to calibrate the amount of radiation available in the atmosphere. Its sensitivity is 0.2 mV/Wm-2,

AIMS Energy Volume 9, Issue 3, 414–445.
436

and its factor of calibration is 5 Wm-2/mV, which is the reciprocal of sensitivity. The range of
calibrated output is 0–400 mV, and the time of response is less than a millisecond. It can view 180
degrees, and the content of the spectrum is 360–1120 nm. An industrial socket of 440 V and 10 A
current is used to interconnect the SPFBI to the grid. A grid voltage of 240 V RMS is used to transfer
the power generated from the PV source. A personal computer with Xilinx software is used to
provide the necessary coding for Spartan-6 FPGA to trigger the semiconductor switches. The WT800
Yokogawa power analyzer and DL850E scope corder are used to extract the data or the results. The
IGBTs of the model number SKM100GB12T4 are used to design the SPFBI and the necessary
connectors and auxiliaries.

 Figure 29. A laboratory model designed in the lab.

 The PV voltage and current at the corresponding solar irradiation is demonstrated in Figure 30.
As solar radiation varies, the PV cell's current varies due to the photo-electric effect; as a result, the
PV voltage also varies. The fuzzy logic-based peak power controller tracks the accurate peak power
at all irradiations, and it can be seen in Figure 30. Different case studies are analyzed to trace out the
superior performance of the control design.
 Case-1: In this section, the steady-state analysis of the system is calibrated. Constant solar
irradiation of 1000 W/m2 is considered for the evaluation. As the irradiation is stable, the PV
system's voltage and currents remained unchanged and can be observed from Figure 30. Due to the
unvaried solar radiation, the voltage across the capacitor and corresponding load currents have also
remained unvaried. The voltage and current of the distribution system also remained undisturbed due
to the steady solar radiation. The practical case opposes this condition because the irradiance is
intermittent.

AIMS Energy Volume 9, Issue 3, 414–445.
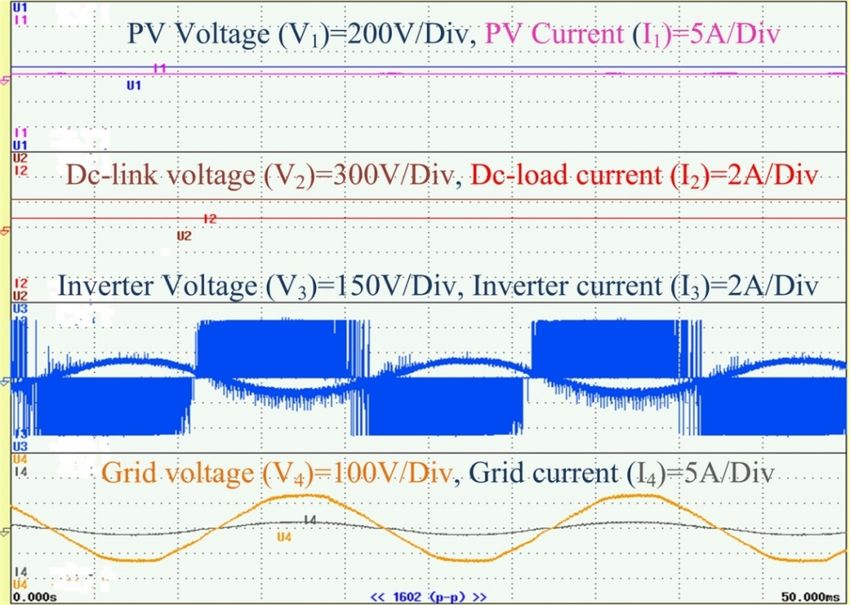
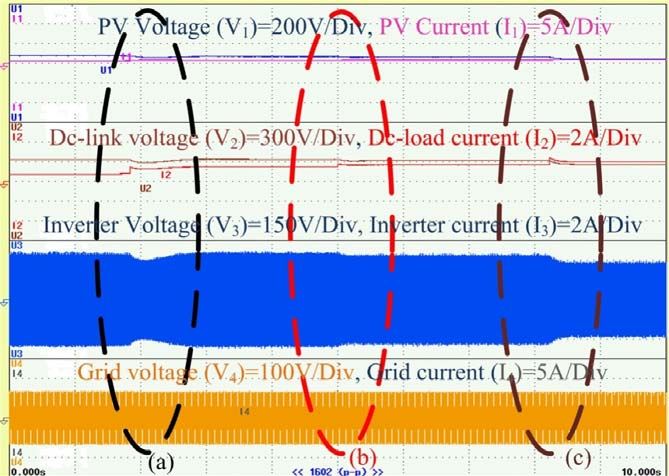
437

 Figure 30. The analysis voltage, current and peak power of PV system at variable irradiation.

 The unfiltered voltage or the two-level voltage of the SPFBI is also presented in Figure 31. Due
to the robust current controller and the perfect sine pulse width modulation analysis, the inverter's
current output remains distorted less. It is an evidence of the robustly designed controller.

 Figure 31. The analysis of voltage and current of PV system, voltage across the
 capacitor, inverter voltage and current, voltage and current of grid at constant irradiation.

AIMS Energy Volume 9, Issue 3, 414–445.
438

 Figure 32. The analysis of voltage and current of PV system, voltage across the
 capacitor, inverter voltage and current, voltage and current of the grid at variable
 irradiation.

 Case-II: In this case study, variable solar irradiation at a constant load is considered. As seen
from Figure 32, as soon the PV circuit breaker is switched on, the PV current (CH2) rises
immediately; thus, the voltage across the PV panel (CH1) also increases. Due to sudden transient in
the solar radiation, the voltage across the capacitor (CH3) experienced the overshoot in the voltage
and retained to set value. When the capacitor voltage remains the same, the SPFBI (CH5) phase
voltage remained constant. Still, the current controller experiences the effect of change in irradiation,
and to compensate for its impact, the magnitude of the inverter current (CH6) is enhanced, as shown
in Figure 32.
 Case-III: In this case, the variable solar radiation and the variable dc load and ac load on the PV
system and on distribution lines are analyzed. The effect of the abrupt rise in the dc resistor bank
current disturbs the PV voltage and current [(CH1) &(CH2)] as is evident from Figure 33(a). The
sudden rise in the current through the dc resistor bank (CH4) introduces the transients in capacitor
voltage, at that instant, the robust capacitive voltage controller regulates the voltage across the
capacitor (CH3) and remains it in the constant state even after a slight disturbance. The inverter
output voltage (CH5) also remained constant except at the load change condition as it underwent a
voltage undershoot due to dc-link voltage (CH3). When the controller is removed, the dc-link voltage
regulator loses its control; as a result, the dc-link voltage and the inverter voltage remained
uncontrollable, as it is evident from the Figure 33(c). When the ac load is turned on, the ac load
current (CH4) is suddenly increased in magnitude; as a result, the dc-link voltage is also increased
for a moment, and it settled to its reference value due to fuzzy logic controller. Since capacitor
voltage is unchanged, the converter (CH5) phase voltage has also remained constant, as shown in
Figure 33. The grid current (CH6) magnitude is raised to ensure the proper power balance. Similarly,

AIMS Energy Volume 9, Issue 3, 414–445.
439

the effect of ac load off is presented in Figures 34 and 35.
 Case-IV: The effect of grid disturbances on the source and on the grid is analyzed in this
section. The grid voltage is reduced to 15% of the standard value by using a voltage matching
transformer to create the voltage sag, as shown in Figure 36. At the instant of the voltage sag, the
capacitor voltage (CH3) confronted a transient and returned to the nominal value, which is evident
from Figure 36.

 Figure 33. The analysis of voltage and current of PV system, capacitor voltage, inverter
 voltage and current, voltage and current of grid at the condition of variable dc load.

 Figure 34. The analysis of voltage and current of PV system, capacitor voltage, inverter
 voltage and current, voltage and current of the grid at the condition of ac load on.

AIMS Energy Volume 9, Issue 3, 414–445.
440

 Figure 35. The analysis of voltage and current of PV system, capacitor voltage, inverter
 voltage and current, voltage, and current of grid at the ac load condition.

 Figure 36. The analysis of voltage and current of PV system, capacitor voltage, inverter
 voltage and current, voltage and current of the grid at the voltage sag condition.

 To compensate for voltage sag effect, the magnitude of the grid current (CH6) is increased in
the magnitude due to the current controller. Similarly, the impact of voltage swell is also presented in
Figure 37. The voltage of the grid is increased by 15% to create the voltage swell. The magnitude of
the current is reduced to compensate for the effect of voltage swell and to ensure the power balance
between the PV source and grid. The comparative analysis between the different control schemes
and the proposed control scheme is presented in Table 5.

AIMS Energy Volume 9, Issue 3, 414–445.
441

 Figure 37. The analysis of voltage and current of PV system, capacitor voltage, inverter
 voltage and current, voltage and current of the grid at the voltage swell condition.

 Table 4. Simulation and experimental parameters and its values.

Parameters Value
 PV system (Experimental and simulation)
Voc (V) (open circuit voltage) 30.8
Isc (A) (short circuit current) 8.23
Vp (V) (Peak voltage) 24.6
Ip (A) (Peak current) 7.7
Coefficient of voltage −0.1
Coefficient of current 0.004
Series modules 6
Parallel modules 1
 Grid parameters
Grid voltage (VRMS) (V) 240
Grid current (IRMS) (A) 5
 DC voltage controller
Reference DC voltage 435 volts
 Current controller
Kp (PI) 0.15
KI (PI) 6.6
Rff 0.002
Lff 0.20
Carrier frequency 3780 HZ

AIMS Energy Volume 9, Issue 3, 414–445.
442

 Table 5. Comparative analysis of Fuzzy-based and Incremental conductance MPPT.

Performance index Fuzzy logic Incremental conductance
Overshoot (%) 0.3089 1.2345
Damping factor (ξ) 0.7685 0.5236
Rise Time 0.1254 0.1856
Error (%) 6.2 16
Fluctuations in voltage Very low high
Duty cycle operation 0.55–0.65 0.3–0.7
Peak power point oscillations (%) 3.2 1.2
Handling capabi;ity of non-linearity Comparatively low Highly appreciable
In terms of cost Comparatively high quite low

5. Conclusions

 In this paper, the PV based home based grid-tied energy is investigated using adaptive
technology. The mathematical modeling of a single-phase grid-tied full bridge inverter with
necessary mathematical formulae is also expounded in this paper. To overcome the disadvantages of
the conventional peak power controller and PI-based dc-link voltage regulator, a fuzzy logic
controller is proposed with a definite set of rules. The effect of the variable solar radiation on the
distribution line parameters, the impact of the dc load and the ac load on the line and PV parameters,
the effect of grid disturbances like voltage sag and swell, and third harmonics are analyzed in this
work. The impact of disorders in grid parameters on the connected loads and PV source is elucidated
with simulation and experimental results. This control topology's implementation can assure the
drastic reduction in the financial burden to invest in dc/dc converter in a PV powered grid-tied home
energy applications. It also reduces the complexity of tuning the PI parameters to achieve better peak
power tracking capability and transient stability of dc-link voltage. In the future, the fuzzy-based
approach can be replaced by most adaptive techniques to reduce complexity and to increase
efficiency with reduced cost.

Acknowledgements

 The author’s want to thank DST-SERB, statutory body established through an act of parliament:
SERB Act 2008, Government of India for their financial assistance for the undergoing project under
project reference no. SERB-SB/S3/EECE/090/2016 and also the management of NIT, Meghalaya
(An institute of National Importance) for their constant support to carry out the work.

Conflict of interest

 All authors declare no conflict of interest in this paper.

AIMS Energy Volume 9, Issue 3, 414–445.
443

References

1. Kim IS, Kim MB, Youn MJ (2006) New maximum power point tracker using a sliding-mode
 observer to estimate solar array current in the grid-connected photovoltaic system. IEEE Trans
 Ind Electron 53: 1027–1035.
2. Femia N, Petrone G, Spagnuolo G, et al. (2009) A technique for improving p&o mppt
 performances of double-stage grid-connected photovoltaic systems. IEEE Trans Ind Electron 56:
 4473–4482.
3. Kollimalla SK, Mishra MK (2014) Variable perturbation size adaptive p&o mppt algorithm for
 sudden changes in irradiance. IEEE Trans Sustain Energy 5: 718–728.
4. Killi M, Samanta S (2015) Modified Perturb and Observe MPPT Algorithm for Drift Avoidance
 in Photovoltaic Systems. IEEE Trans Ind Electron 62: 5549–5559.
5. Elgendy MA, Zahawi B, Atkinson DJ (2012) Assessment of perturb and observe MPPT
 algorithm implementation techniques for PV pumping applications. IEEE Trans Sustain Energy
 3: 21–33.
6. Sera D, Teodorescu R, Hantschel J, et al. (2008) Optimized maximum power point tracker for
 fast-changing environmental conditions. IEEE Trans Ind Electron 55: 2629–2637.
7. Gules R, Pacheco JDP, Hey HL, et al. (2008) A maximum power point tracking system with
 parallel connection for PV standalone applications. IEEE Trans Ind Electron 55: 2674–2683.
8. Nannam HC, Banerjee A, Guerrero JM (2021) Analysis of an interleaved control scheme employed
 in split source inverter based grid‐tied photovoltaic systems. IET Renew Power Gener, 1–14.
9. Koutroulis E, Kalaitzakis K, Voulgaris NC (2001) Development of a microcontroller-based,
 photovoltaic maximum power point tracking control system. IEEE Trans Pow Electron 16: 46–54.
10. Piegari L, Rizzo R (2010) Adaptive perturb and observe algorithm for photovoltaic maximum
 power point tracking. IET Renew Power Gen 4: 317–328.
11. Femia N, Petrone G, Spagnuolo G, et al. (2005) Optimization of perturb and observe maximum
 power point trackingmethod. IEEE Trans Pow Electron 21: 963–973.
12. Jain S, Agarwal V (2004) A new algorithm for rapid tracking of approximate maximum power
 point in photovoltaic systems. IEEE Power Electron Letters 2: 16–19.
13. Kasa N, Iida T, Chen L (2005) Flyback inverter controlled by sensorless current MPPTfor
 photovoltaic power system. IEEE Trans Ind Electron 52: 1145–1152.
14. Veerachary M, Senjyu T, Uezato K (2001) Analytical investigations for maximum power
 tracking of PV supplied IDB converter. 2001 IEEE 32nd Annual Power Electronics Specialists
 Conference, Vancouver, BC, Canada 1: 205–209.
15. Boehringer AF (1968) Self-adapting dc converter for solar spacecraft power supply. IEEE Trans
 Aerosp Electron Syst 4: 102–111.
16. Kuo YC, Liang TJ, Chen JF (2001) Novel maximum-power-point tracking controller for
 photovoltaic energy conversion systems. IEEE Trans Ind Electron 48: 594–601.
17. Hart GW, Branz HM, Cox CH (1984) Experimental tests of open loop maximum-power-point
 tracking techniques. Sol Cells 13: 185–195.
18. Masoum MAS, Dehbonei H, Fuchs EF (2002) Theoretical and experimental analyses of
 photovoltaic systems with voltage and current-based maximum power-point tracking. IEEE
 Trans Energy Conver 17: 514–522.

AIMS Energy Volume 9, Issue 3, 414–445.
444

19. Kobayashi K, Matsuo H, Sekine Y (2004) A novel optimum operating point tracker of the solar
 cell power supply system. 2004 IEEE 35th Annual Power Electronics Specialists Conference 3 :
 2147–2151.
20. Mutoh N, Matuo T, Okada K, et al. (2002) Prediction-data-based maximum-power-point-
 tracking method for photovoltaic power generation systems. 2002 IEEE 33rd Annual IEEE
 Power Electronics Specialists Conference. Proceedings 3: 1489–1494.
21. Yuvarajan S, Xu S (2003) Photo-voltaic power converter with a simple maximum-power-point-
 tracker. Proceedings of the 2003 International Symposium on Circuits and Systems, ISCAS '03,
 Bangkok, Thailand, 399–402.
22. Won CY, Kim DH, Kim SC, et al. (1994). A new maximum power point tracker of photovoltaic
 arrays using fuzzy controller. Proceedings of 1994 Power Electronics Specialist Conference—
 PESC'94 Taipei, Taiwan 1: 396–403.
23. Senjyu T, Uezato K (1994). Maximum power point tracker using fuzzy control for photovoltaic
 arrays. Proceedings of 1994 IEEE International Conference on Industrial Technology—ICIT '94,
 Guangzhou, China, 143–147.
24. Yu GJ, Jung MW, Song J, et al. (1996) Maximum power point tracking with temperature
 compensation of photovoltaic for air conditioning system with fuzzy controller. Conference
 Record of the Twenty Fifth IEEE Photovoltaic Specialists Conference, Washington, DC, USA,
 1429–1432.
25. Simoes MG, Franceschetti NN, Friedhofer M (1998) A fuzzy logic based photovoltaic peak
 power tracking control. IEEE International Symposium on Industrial Electronics, Proceedings,
 Pretoria, South Africa 1: 300–305.
26. Mahmoud AMA, Mashaly HM, Kandil SA, et al. (2000) Fuzzy logic implementation for
 photovoltaic maximum power tracking. IEEE International Conference on Industrial Electronics,
 Control and Instrumentation. 21st Century Technologies, Nagoya, Japan 1: 735–740.
27. Patcharaprakiti N, Premrudeepreechacharn S (2002) Maximum power point tracking using
 adaptive fuzzy logic control for grid-connected photovoltaic system. IEEE Power Engineering
 Society Winter Meeting, New York, NY, USA,1: 372–377.
28. Ravikumar N, Kohila J (2013) Tracking maximum power point from photovoltaic system using
 fuzzy logic technique. IEEE Conference on Information & Communication Technologies,
 Thuckalay, India, 93–97.
29. Veerachary M, Senjyu T, Uezato K (2003) Neural-network-based maximum-power-point
 tracking of coupled-inductor interleaved-boost converter-supplied PV system using fuzzy
 controller. IEEE Trans Ind Electron 50: 749–758.
30. Hiyama T, Kouzuma S, Imakubo T (1995) Identification of optimal operating point of PV
 modules using neural network for real time maximum power tracking control. IEEE Trans
 Energy Convers 10: 360–367.
31. Ro K, Rahman S (1998) Two-loop controller for maximizing performance of a grid-connected
 photovoltaic-fuel cell hybrid power plant. IEEE Trans Energy Convers 13: 276–281.
32. Xing C, Xi X, He X, et al. (2020) Research on the MPPT Control Simulation of Wind and
 Photovoltaic Complementary Power Generation System. IEEE Sustainable Power and Energy
 Conference (iSPEC), Chengdu, China, 1058–1063.

AIMS Energy Volume 9, Issue 3, 414–445.
445

33. Zhang M, Wu J, Zhao H (2004) The application of slide technology in PV maximum power
 point tracking system. Fifth World Congress on Intelligent Control and Automation, Hangzhou,
 China, 6: 5591–5594.
34. Teodorescu R, Liserre M, Rodrıguez P (2011) Grid converters for Photovoltaic and Wind power
 systems, New Jersey, USA, Wiley-IEEE Press, 5–42.
35. Esram T, Chapman PL (2007) LCL Comparison of photovoltaic array maximum power point
 tracking techniques, filter design and performance analysis for grid-interconnected systems.
 IEEE Trans Energy Convers 22: 439–449.
36. Nabulsi AA, Dhaouadi R (2012) Efficiency Optimization of a DSP-Based Standalone PV
 System Using Fuzzy Logic and Dual-MPPT Control. IEEE Transactions Ind Inform 8: 573–584.
37. Nannam HC, Babu C, Banerjee A (2020) Control and analysis of a 3-level diode-clamped split
 source inverter in the applications of grid-tied photovoltaic systems. Int Trans Electr Energy
 Syst 30: 1–30.

 © 2021 the Author(s), licensee AIMS Press. This is an open access
 article distributed under the terms of the Creative Commons
 Attribution License (http://creativecommons.org/licenses/by/4.0)

AIMS Energy Volume 9, Issue 3, 414–445.
You can also read