A predic on model of the coefficient of fric on for runway using ar ficial neural network
←
→
Page content transcription
If your browser does not render page correctly, please read the page content below
A predic on model of the coefficient of fric on for
runway using ar ficial neural network
Modelo de previsão do coeficiente de atrito para pista de pouso e
decolagem com uso de redes neurais ar ficiais
José Breno Ferreira Quariguasi1, Francisco Heber Lacerda de Oliveira2, Saulo Davi Soares e Reis3
1Federal University of Ceará, Ceará – Brazil, brenoquariguasi@det.ufc.br
2Federal University of Ceará, Ceará – Brazil, heber@det.ufc.br
3Federal University of Ceará, Ceará – Brazil, saulo@fisica.ufc.br

 Recebido:                                 ABSTRACT
 24 de junho de 2020                       Runway surface condi3ons are fundamental to ensure safety during landing and takeoff
 Aceito para publicação:                   opera3ons of aircra7s. In this manner, airport operators are required to monitor the
 13 de outubro de 2020                     coefficient of fric3on and macrotexture of runways to maintain its safety and plan
 Publicado:                                maintenance and rehabilita3on strategies when appropriate, since both these parame-
 21 de agosto de 2021                      ters get deteriorated with 3me. Thus, to assist aerodrome operators and regulatory
 Editor de área:                           agencies in the decision-making process for conserva3on and monitoring of airfield
 Kamilla Vasconcelos                       pavements, this study aimed to develop a predic3on model for runway fric3on using
                                           Ar3ficial Neural Network. Our results were sa3sfactory and may contribute to the
 Keywords:                                 decision-making process in the context of the Airport Pavement Management System.
 Pavements.
 Airports.                                 RESUMO
 Opera3onal safety.                        As condições superficiais de uma pista de pouso e decolagem (PPD) são fundamentais
 Maintenance.                              para a garan3a da segurança das operações das aeronaves que a u3lizam. Nesse sen3do,
                                           operadores de aeródromos devem manter atenção especial ao coeficiente de atrito e à
 Palavras-chave:                           macrotextura, para que possam promover uma PPD segura, planejar estratégias de ma-
 Pavimentos.                               nutenção e reabilitação em momentos oportunos, à medida que esses parâmetros se
 Aeroportos.                               deterioram. Dessa forma, com o intuito de auxiliar operadores de aeródromo e a agên-
 Segurança operacional.                    cia reguladora na tomada de decisão acerca do monitoramento e dos serviços de con-
 Manutenção.                               servação de pavimentos aeroportuários, este trabalho tem o obje3vo de desenvolver
                                           um modelo de previsão do coeficiente de atrito medido numa PPD, por meio de Redes
 DOI:10.14295/transportes.v29i2.2401
                                           Neurais Ar3ficiais. Os resultados apresentaram-se sa3sfatórios e, assim, tem-se poten-
                                           cial de aplicação do modelo para contribuir na tomada de decisão no contexto de um
                                           Sistema de Gerência de Pavimentos Aeroportuários.

1. INTRODUCTION
The tire-pavement adherence – represented by the macrotexture and by the coef icient of
friction – are essential for the safety of the operations on the runways. They make it possible for
the aircraft to slow down after landing as they allow the airplane tire to roll until it reaches the
speed to takeoff (Fwa et al., 1997) and also, they act in the draining of the water on the runway.
Therefore, the importance of their monitoring in order to help making decisions regarding
maintenance measures taken by the airport operators and the inspection of the National Civil
Aviation Agency of Brazil (ANAC) are highlighted.

TRANSPORTES | ISSN: 2237-1346                                                                                                  1
Quariguasi, J.B.F.; et al.                                                     Volume 29 | Número 2 | 2021

    In Brazil, ANAC (2019), establishes that the airport operators should keep the runway in con-
dition to operate safely in order to guarantee: (i) skid resistance, (ii) the directional control of
the airplanes, and (iii) the integrity of the aeronautical equipment. Hence, among the aspects
that must be monitored, the ones in evidence are the coef icient of friction, the macrotexture,
and the rubber accumulation from the airplane tires. So, the frequency for monitoring the pa-
rameters mentioned above is established according to the average number of daily landings.
Consequently, the more landings, the more measurements should be made, and therefore, as
these measurements are made, more data that composes the Pavement Management System
(PMS) are generated, which is one of the main characteristics of a modern PMS for
Haas et al. (2015).
    Nevertheless, according to Federal Aviation Administration (FAA) (2014), airport operators
do not always make the best rational decisions regarding pavement maintenance and rehabili-
tation using an approach that allows them to evaluate alternative strategies and lead to an ef i-
cient usage of the resources available. Many times, decisions are based on an immediate need
or in the experience of past services, in a subjective way (Fwa et al., 1997; Chen et al., 2008).
    It is fundamental for a PMS to have tools that are capable of foreseeing the surface conditions
of the pavements with the objective of helping the airport operators and the regulatory agencies
in decision making in order to guarantee the safety of the operations and the ef iciency to allo-
cate resources. Thus, Arti icial Neural Networks (ANN) can be useful for this purpose because
they are able to detect nonlinear patterns in data bases. Moreover, the ANNs are tools that have
been successfully used in various areas, including Transportation Engineering.
    According to the aforementioned, this paper has the objective of developing a prediction
model using Arti icial Neural Networks, for the coef icient of friction measured in a runway.
The International Airport of Fortaleza, in the state of Ceará , Brazil, was used as the study case
and for applying the model in focus.

2. FACTORS INFLUENCING THE COEFFICIENT OF FRICTION
The tire-pavement adherence is fundamental, besides other factors, for the landing or taking off
to happen safely, and it is strongly affected by the quality of the contact area. Therefore, the
presence of contaminants, such as water, is an important aspect to be taken into consideration.
It is possible to reach a good tire-pavement interaction due to macrotexture and adequate
draining, since a wet runway facilitates hydroplaning, or aquaplaning, a phenomenon in which
there is the loss of traction, resulting in an inef icient breaking, with the possibility of losing the
directional control and causing accidents (Silva, 2008).
   The microtexture is responsible for breaking the water ilm that is present in the surface and
consequently, for allowing the reestablishment of the tire-pavement contact. This parameter
depends, basically, on the roughness or smoothness of the super icial aggregates. So, it is
desirable, according to Aps (2006), that the surface is composed of aggregates that are rough
enough to break the water ilm. In spite of this, ANAC (2019) does not require the microtexture
of the runways be measured in the airports of Brazil. The reason for this may be substantiated
in Bernucci et al. (2008), when they af irm that this parameter, despite being a very important
characteristic to promote the tire-pavement contact, acts at low speed, of up to 40km/h.
   The macrotexture is one of the main characteristics of the tire-pavement adherence, mostly
for speeds higher than 50km/h, being one of the factors that predominantly interfere in friction
(Bernucci et al., 2008). Due to the importance of macrotexture in the maintenance of the
TRANSPORTES | ISSN: 2237-1346                                                                           2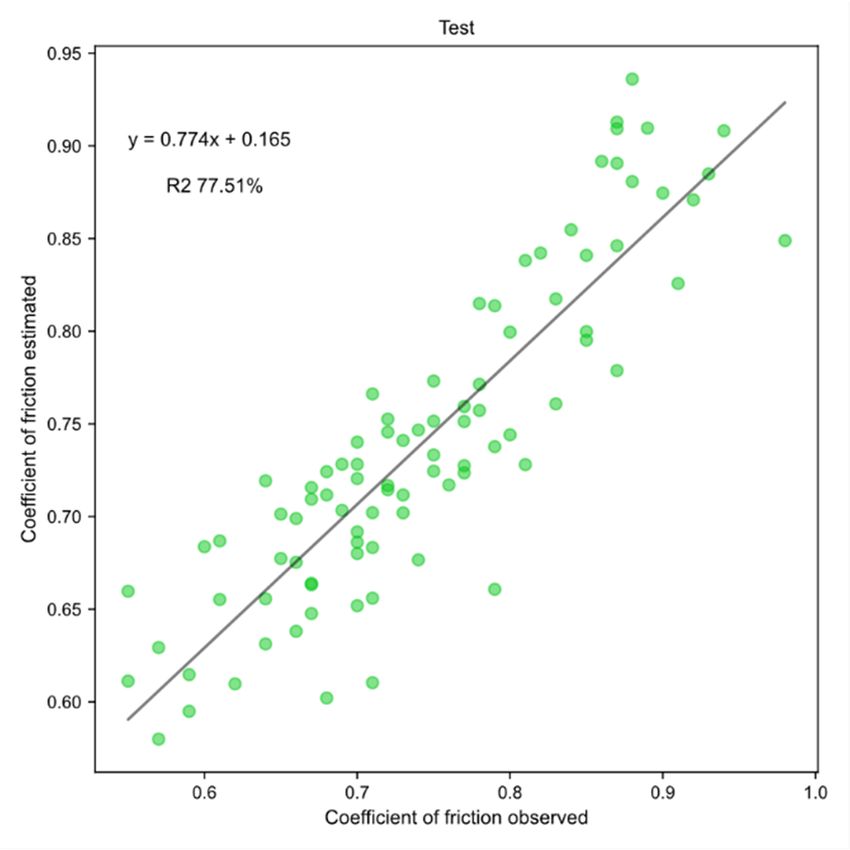
Quariguasi, J.B.F.; et al.                                                  Volume 29 | Número 2 | 2021

tire-pavement adherence, the ANAC (2016) determines that the macrotexture depth on the
pavement must be of at least 0,60mm and measured by the volumetric sand patch test.
The measurements are one-off events that take place three meters away from the runway cen-
terline, and alternately every 100 meters, to the left and to the right of the centerline
(ANAC, 2019).
   Like the macrotexture, the friction forces between the tire and the pavement are also im-
portant for the safety of the airplane, especially in smaller runways, in which the extension avail-
able is close to the necessary amount for braking. The friction forces form the main way to stop
the airplane after the takeoff or the landing is interrupted because the engine reversal is con-
sidered a mere complement, although it may contribute signi icantly considering low friction
runways (Rodrigues Filho, 2006).
   Although macrotexture is an important factor for airplanes to brake, for it helps draining the
water from the surface of the pavement, this feature was not used in this paper for two main
reasons: (i) its measurements are isolated, whereas the measurements of the coef icient of fric-
tion are done continuously; and (ii) the initial results have shown a weak correlation between
the values of macrotexture measured using the sand patch method and the values of the coef i-
cient of friction using the Grip Tester, according to what has been observed by Bezerra Filho and
Oliveira (2013) and Ramos et al. (2015).
   As for the ways of measuring the coef icient of friction, ANAC (2019) establishes a classi ica-
tion of equipment, speeds, water depth and measurement frequencies that aerodrome opera-
tors can adopt. The results are reported in 100-meter segments and the limit values, according
to the type of equipment and measurement speed. In this paper, a Grip Tester equipment was
used, with a speed of 65 km/h, whose maintenance planning level of the coef icient of friction
value is 0.53 and the minimum level of the coef icient of friction value is 0.43.
   Besides this, the measurements of the coef icient of friction always take place within a 1,0mm
water level layer in order to simulate a situation of wet pavement, a condition in which the fric-
tion between the airplane tire and the pavement is reduced. Regarding the frequency of the
measurements, it is established according to the average of landing of ixed-wing aircrafts with
reaction engines per day, on the predominant threshold, during the past year. This way, the fre-
quency of the measurements of the coef icient of friction, de ined by the ANAC (2019), may vary
from 15 to 360 days.
   Several characteristics and factors in luence the coef icient of friction on a pavement, namely:
the types of surface layer, texture, traf ic, time, the presence of contaminants, the weather con-
ditions, among others. Regarding the type of pavement, Aps (2006) compared the coef icients
of friction measured in different kinds of asphalt surfaces: a draining one (Porous Friction
Course – PFC), a cold premix asphalt, and an asphaltic concrete. It has been noticed that, in
general, the PFC has shown the best results of coef icient of friction, and the asphaltic concrete,
the worst results.
   McDanniel et al. (2010) also investigated the performance of the coef icient of friction in
some parts of North American roads, which were composed of three types of surfaces: the con-
ventional asphalt concrete, Stone Matrix Asphalt (SMA), and PFC. The monitoring began when
the runway started operating and continued for ive years. It has been noticed that, after the
action of traf ic, the asphalt concrete section has shown the lowest friction values among the
surfaces being investigated.

TRANSPORTES | ISSN: 2237-1346                                                                        3
Quariguasi, J.B.F.; et al.                                                    Volume 29 | Número 2 | 2021

    Regarding the in luence of traf ic and time on pavements, Skerrit (1993) af irms that friction
on new pavements noticeably comes from macrotexture, since the aggregates are still covered
by an asphalt binder coating. Nevertheless, as vehicles move, this coating disappears and the
aggregates become exposed to polishing. Occasionally, all the aggregates on the surface abrade
until they reach a condition of balance. This usually happens after the traf ic of one to ive mil-
lion passenger vehicles, or after a period of two years.
    Therefore, the polishing of the aggregates is directly associated to traf ic intensity and com-
mercial vehicles contribute the most in this process. However, the geometry of the pavement
also represents another factor that contributes for the polishing to happen. Consequently,
regions with a high number of vehicles demand more attention concerning friction (Chelliah et
al., 2002).
    Another important factor that also in luences the friction available on runways is the amount
of rubber accumulated on the surface of the pavement originated from the airplane tires during
operations, mainly landings. This rubber accumulated on the touchdown zone of the runways
can be very extensive and ill all the texture of the pavement surface, leading to the loss of
braking capacity and the directional control when the runway is wet. Hence, the main reason of
attention to the accumulation of rubber is the safety of the landing and takeoff operations on
the runway (Chen et al., 2008).
    Chen et al. (2008) studied the effect of rubber accumulation on a runway of the International
Airport of Kaohsiung. According to the authors, after the initial 200m, from the threshold end,
it is already possible to observe the presence of rubber deposits. However, it is between the
500m and 1,000m stretches that the biggest rubber accumulation can be noticed and, as a re-
sult, the lowest friction coef icient values. Besides this, Chen et al. (2008) also observe that, in
general, each landing contributes for the increase of 0,05 µm in the thickness of the rubber de-
posited. This accumulated rubber goes through a compaction process as a result of the heat and
weight of the airplanes during their landing, thus becoming a layer of rubber that covers the
runway surface, impairing the contact between the tire and the pavement reducing the
coef icient of friction.
    Finally, the pavement surfaces also suffer the in luence of the weather conditions. Regarding
friction, there are different patterns of seasonal variations on the skidding resistance levels.
This variation is more noticeable during the summer months, according to Masad et al. (2009),
because these are times of higher temperatures when the lower levels of skidding resistance
are observed, mainly due to the accumulation of a large quantity of small particles and detritus.
Consequently, there is a faster polishing of the surface of the pavement and for this reason, the
skidding resistance is reduced. Chelliah et al. (2002) observed an alteration of approximately
30% of the friction between a minimum in summer and a peak during winter.
    Anupam et al. (2013) studied the in luence of temperature of the pavements, of the air and
of the air inside the tire, on the friction, in three different types of asphaltic pavements: draining
pavement, SMA and ultra-thin surface. The results have shown that friction is inversely propor-
tional to temperature, no matter the type of pavement surface.
    Several studies have been developed with the objective of estimating the pavement surface
conditions. These models use variables that in luence them or are related to these
parameters, such as data related to the type of pavement, to the aggregates, to the road geome-
try, to traf ic and to the weather conditions (Cerezo et al., 2012; Santos et al., 2014;
Beckley, 2016; Oliveira, 2017; Susanna et al., 2017; Hossain et al., 2019; Yao et al., 2019).
TRANSPORTES | ISSN: 2237-1346                                                                          4
Quariguasi, J.B.F.; et al. Volume 29 | Número 2 | 2021
In these models, several techniques were employed to predict, from multiple linear regression,
nonlinear regression to Arti icial Neural Networks. This last technique outstands the others and
will be approached in this article due to its ef icient capacity of data processing and patterns
detection in big amounts of data.
3. ARTIFICIAL NEURAL NETWORKS
ANN are techniques inspired by the functioning of the human brain. For this reason, distributed
parallel systems composed by simple processing units are used, known as nodes or neurons,
that calculate certain mathematical functions, that are usually nonlinear. These units are dis-
posed in one or more layers and are interconnected by a signi icant amount of connections
(Ribeiro, 2013).
A neuron, according to Haykin (2009), is an information processing unit that is fundamental
for the operation of a neural network. Multilayer Perceptrons (MLP) networks are some of the
most employed and best-known models. This type of network consists of a set of sensorial units
that form an input layer, one or more hidden – or intermediate – layers and an output layer.
The input signals are propagated layer after layer through the network in a positive
direction, that is, from input to output, as illustrated in Figure 1 (Bocanegra, 2002).
Figure 1. Process of Positive Propagation (input-output)
The neuron, according to Haykin (2009), can be mathematically represented by equations 1,
2 and 3:
zj = ∑wij × xi (1)
vj = zj + bj (2)
y(x) = f(vj) (3)
where: zj is the addition of the outputs, xi are the input signals, wij are the respective synaptic
weights of neuron j, y(x) is the signal for the output neuron, f(.) is a nonlinear activation function
and bk is bias.
In order to go from one layer to the next, a set of neurons calculates the sum of the weights
of the previous layer and the result comes out from a nonlinear function. In previous decades,
the neural networks used to use the sigmoid activation functions or the hyperbolic tangent
functions. However, nowadays, one of the most popular nonlinear activation functions is the
TRANSPORTES | ISSN: 2237-1346 5Quariguasi, J.B.F.; et al. Volume 29 | Número 2 | 2021
recti ied linear function (ReLU), because, in general, ReLU learns faster in networks with many
layers (Lecun et al., 2015).
After propagating the input signals in a positive direction the algorithm analyzes the errors
in the output and veri ies how much each neuron, in the previous hidden layer, contributed to
the error in the output and so on and so forth, until the algorithm reaches the input layer. Gé ron
(2017) synthesizes this process the following way: for every training example, the backpropa-
gation algorithm makes a prediction, checks the error and passes by every layer in the opposite
direction to analyze the contribution of the error of each connection and, inally, makes small
adjustments on the weights of the connection to minimize the error, Figure 2.
Figure 2. Backpropagation process (from the output to the input)
The backpropagation algorithm can be summarized by the following steps: (i) irst, a vector
with input data is applied in the network and propagated through the network in order to ind
the activation of all hidden and output neurons; (ii) next, the errors that were obtained between
the desired and estimated values are evaluated; (iii) so, the error is propagated in the inverse
direction to analyze the error in each neuron; (iv) and last, the weights are adjusted by the deri-
vates of the neuron activation functions (Bishop, 2006).
In this paper, an Arti icial Neural Network of Multilayer Perceptron type with the use of the
backpropagation algorithm was used.
3.1. ANN applica on in the Management of Pavements
Flintsch et al. (1996) elaborated a model using ANN to help in the choice of road sections that
were to go under maintenance, and reduce the subjectivity in this process. For this, data related
to the pavement condition, the location, and the costs of maintenance services were used.
The authors obtained as outcome a model capable to correctly predict 76% of the output for
the testing examples.
Regarding the Airport Pavement Management System, Fwa et al. (1997) developed an ANN
model to de ine the necessity or not of maintenance services on runways and to decide if a
rubber removal operation should be done. Concerning the results, the model reached a success
rate of 90.0% during the testing phase. As the Fwa et al. (1997) model, the model developed in
TRANSPORTES | ISSN: 2237-1346 6Quariguasi, J.B.F.; et al. Volume 29 | Número 2 | 2021 this article tried to develop a tool using ANN to estimate the coef icient of friction, as of envi- ronmental variables, number of operations, rubber removal operations, among others, thus contributing to decision making process related to the runway maintenance. Two models of ANN were created by Bosurgi and Tri irò (2005) to collaborate in decision making regarding the choice of maintenance services and to determine the most economical solution with the highest coef icient of friction. The results of the model for predicting the coef icient of friction presented a Mean Squared Error (MSE) of 0.072 in the testing phase. Concerning the second model, which was developed to estimate the number of accidents on the selected roads, it reached MSE of 0.063 in the testing phase. Ribeiro et al. (2018) presented a low-cost methodology for geotechnical mapping applied to paving with the use of ANN. The model developed by the authors showed a precision of 0.98 hence, being a potential tool to be used in infrastructure projects. Yang et al. (2018) built a prediction model using ANN for the coef icient of friction based on data about the pavement texture, and as a consequence, better understand the relation between these two parameters. Yao et al. (2019), in their turn, elaborated models to predict the deterio- ration of the pavement conditions, among which the coef icient of friction is highlighted and the Coef icient of Determination (R2) was of 86.1% during the testing phase. An alternative model for retroanalysis of Resilient Modulus (RM) of pavements, an important mechanical property of the paving material, was developed by Celeste and Oliveira (2019). The results of this module reached a R² of 99.9% among the RM observed and estimated values. 4. RESEARCH METHOD The methodology used in this paper can be divided into ive stages. The irst stage regards the choice of the airport to be used; in the second stage, data was collected; in the third stage this data was treated; in the fourth stage a model of Arti icial Neural Network was trained; and last, in the ifth stage the results of the model, Coef icient of Determination (R2), and errors were analyzed. When choosing the airport, the International Airport of Fortaleza was chosen with a 2,545m runway of asphalt concrete and with no grooving. This was the airport that had the biggest amount of data available for the authors during the period from 2015 to 2019. The following features were collected: coef icient of friction, rubber removal, number of op- erations (landings and takeoffs), relative humidity, and the age of the runway. The data related to the coef icient of friction were obtained from technical reports provided by the Superintend- ency of Airport Infrastructure from the National Civil Aviation Agency (SIA/ANAC). The data related to the coef icient of friction was taken from 19 technical reports measured from 21/02/2015 to 14/08/2019. The measurements of the coef icient of friction were made using a Grip Tester, three meters away from the centerline at 65 km/h, and the acceleration distance was 100 meters. It is important to point out that the measurements of the coef icient of friction are made on a water ilm of 1.0 mm. Besides this, some pieces of information related to the maintenance of the pavement conditions were also included in the aforementioned re- ports, such as the date of the last rubber removal on the runway. It should be pointed out that the measurements of the coef icient of friction were discriminated every 100 m of segment measured. In general, 2,300 m to 2,400 m of the runway is measured, considering the length of the International Airport of Fortaleza. This way, about 46 values of coef icient of friction per TRANSPORTES | ISSN: 2237-1346 7
Quariguasi, J.B.F.; et al.                                                 Volume 29 | Número 2 | 2021

measurement were found, considering a report of 2,300 m and both the right and left sides of
the runway.
    Regarding the climatic data, these were acquired on the website of the climatological data
base of the Institute of Air Space Control (ICEA). The information collected at ICEA refers to the
monthly hour average. The reports of the coef icient of friction measurement also contain in-
formation on the relative humidity of the air at the time the measurements were taken.
    Regarding the age of the pavement surface of the runway, on its turn, it was gotten from
the Brazilian Airport Infrastructure Company (INFRAERO).
    The information concerning landings and takeoffs came from the SIA/ANAC. The number of
operations was calculated by the amount of operations, considering all the landings and takeoffs
that happened in between the procedures of rubber removal and the moment when the coef i-
cient of friction was measured. Since more than 98% of the operations in the International Air-
port of Fortaleza take place on the predominant threshold, considering the average of the period
from 2015 to 2018, the option was for considering all the operations that occurred on this
threshold.
    Categoric features were also used to indicate (i) the side of the runway where the coef icient
of friction was measured and (ii) proceeding or not of the rubber removal process. For this mat-
ter, 0 indicates no rubber removal was done since the last measurement and 1, indicates the
opposite. It is observed that going through this procedure was considered only for the irst one-
third of the runway, a section where there is predominance of landings and takeoffs; regarding
the side on which the coef icient of friction was measured, 0 was determined for the left side
and 1, for the right side.
    Next, the data was normalized, that is, each value was subtracted from its average and then,
divided by their standard deviation. When applying this method, the features present average
0 and variance 1. This is a common procedure for an ANN; otherwise, it may present unsatis-
factory results, mainly if the individual features bear no similarity to the standard data that is
normally distributed. So, it points out all resources are centralized around 0 and have their
variation in the same order or are between [0, 1] or [-1, 1].
    For training the model, which was written in the Python programming language, the
Scikit-Learn library were used to test several parameters simultaneously. Among the parame-
ters that were tested, the ones highlighted were: ANN architectures with up to two hidden
layers; of 1 to 100 neurons; activation functions: sigmoid, hyperbolic tangent and recti ied
linear; alpha, a regularization term to prevent excessive adjustments, from 0.001 to 1; number
of iterations between 200 and 1.0000; two ways of optimizing weights, using the Stochastic
Gradient Descent and the L-BFGS, an optimizer of the quasi-Newton family.
    As for the data set, two proportions were tested: 80% / 20% and 90% / 10%; the irst portion
of the proportion relating to training and the second, to the test. The data were, then, randomly
divided without repetition. It was noticed that the division 90%/10% was the one that showed
the most relevant results. Finally, the model that was analyzed by its success rate, measured by
the Coef icient of Determination (R2) among the observed and estimated values. In order to
measure the errors, we used the Mean Squared Error (MSE) and the Mean Absolute Error
(MAE).

TRANSPORTES | ISSN: 2237-1346                                                                       8
Quariguasi, J.B.F.; et al. Volume 29 | Número 2 | 2021
5. RESULTS AND DISCUSSION
The 19 technical reports on measurements of the coef icient of friction resulted in 894 obser-
vations, from which 804 were used in the training phase and 90 in the testing phase.
The ANN architecture that reached the best results is formed by two hidden layers with 94 and
73 neurons; Recti ied Linear Unit (ReLU); L-BFGS weight optimizer; alpha equal to 0.1; and a
maximum of 600 iterations.
The input features adopted were (i) distance of measurement; (ii) side of measurement; (iii)
rubber removal; (iv) age of the pavement surface; (v) relative humidity; and (vi) number of
operations between removals. In relation to the output feature of the model, this is an estimate
of the coef icient of friction measured by the equipment Grip Tester at the speed of 65km/h,
three meters away from the runway centerline.
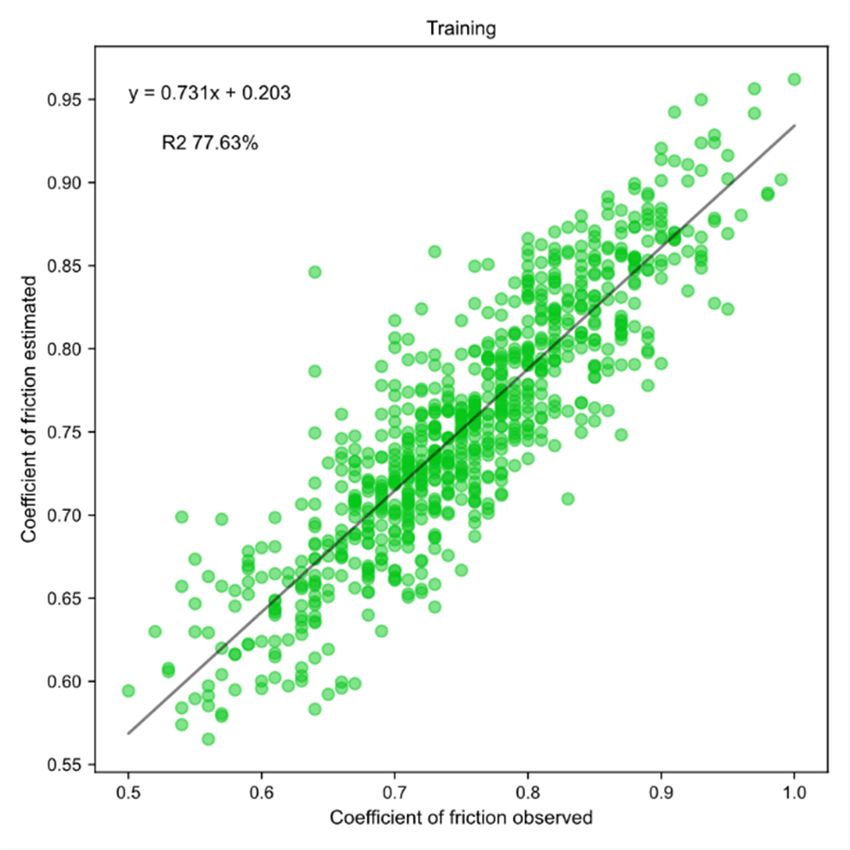
The success rates, Coef icient of Determination (R²), and the errors measured by the Mean
Squared Error (MSE) and the Mean Absolute Error (MAE) are shown on Table 1.
Table 1 – Model Results
Phase Coefficient of Determination MSE MAE
Training 77.63% 0.0018 0.0327
Test 77.51% 0.0021 0.0364
The input variable “distance of measurement” was the one that in luenced the model the
most. There are sections on the runway that are more used than others, such as the touchdown
zone of the airplanes during the landing operations, where there is more rubber accumulation
due to the fact that the tire-pavement contact happens more intensely in this area. The results
of the Coef icient of Determination (R²) were similar on the training and testing phases (Table
1). Regarding the errors, both phases have also shown similar MSE and MAE, although the
training phase slightly superior to the testing phase. Figure 3 shows the scatter plot between
the coef icient of friction observed and the coef icient of friction estimated by the model for the
training and testing phases.
Figure 3. Scatter plots of the coefficient of friction in the training and testing phases
TRANSPORTES | ISSN: 2237-1346 9Quariguasi, J.B.F.; et al. Volume 29 | Número 2 | 2021
Although the graphs in Figure 3 show signi icant dispersion in both phases, it should be
emphasized that the coef icients of friction show the same tendency to dispose the values close
to the diagonal, that is, to the trendline. A summary of the results of the testing phase is
presented in Table 2. Therefore, the importance of analyzing the errors histogram, shown in
Figure 4, is highlighted, to better check these results.
Table 2 – Summary of the accuracy score of the testing phase
Observed Coefficient of Friction
Estimated Coefficient of Friction
0.5 0.6 0.7 0.8 0.9 1
0.5 2 0 0 0 0 0
0.6 4 13 9 0 0 0
0.7 0 9 25 4 0 0
0.8 0 0 2 12 5 0
0.9 0 0 0 4 1 0
1 0 0 0 0 0 0
Error histogram (training phase) Error histogram (testing phase)
Error (observed - estimated) Error (observed - estimated)
Figure 4. Error histograms in the training and testing phases
It is noticeable that, in the training phase, most of the errors are in the gap between -0.05
and +0.05, mainly between -0.025 and 0.0. Moreover, the average of errors in the training phase
is 0.0 and the standard deviation is of 0.04. We found that 50.87% of the results had values
below 0, that is, the model estimated the coef icient of friction above the observed rates. This
situation, under the perspective of operational safety, would be the most unwanted, since it
could transmit to the National Civil Aviation Agency – ANAC and to the airport operator (the
decision maker), who is responsible for the runway maintenance, a coef icient of friction supe-
rior to the real one.
Regarding the testing phase, the errors are mainly between -0.05 and +0.025, notably on the
gap from 0.0 to +0.025. Moreover, 52.22% of errors are superior to zero, indicating that, in
general, the estimated coef icients of friction are lower than the ones observed and, conse-
quently, they do not present a risky scenario to the safety of the landing and takeoff operations,
since the model estimates more adverse scenarios than the ones observed, and hence, stimu-
lates the airport operator to measure of the coef icient of friction on the runway.
TRANSPORTES | ISSN: 2237-1346 10Quariguasi, J.B.F.; et al. Volume 29 | Número 2 | 2021
It should be emphasized that estimates of the coef icient of friction lower or equal to 0.60
must be closely observed because, according to the scatter plots in Figure 3 and the errors his-
tograms in Figure 4, such estimates may re lect values close to 0.50. So, in order to guarantee
the safety in the operations on the runway, when the model estimates results close to 0.60, it is
suggested the airport operator measures the coef icient of friction on site, since the ANAC
(2019) establishes both the minimum and the maintenance values are, respectively, 0.43 and
0.53 for measurements of the coef icient of friction using the equipment Grip tester at 65km/h.
This tool might help the airport operator to have better a control of the runway condition of
friction and thus, plan on site measurements in more appropriate moments, as well as indicate
maintenance strategies, obeying the frequency established by the National Civil Aviation
Agency (ANAC, 2019). That being so, one hopes to have contributed for the increase and
guarantee of the safety in the landing and takeoff operations.
6. CONCLUSIONS
This paper developed a model to estimate the coef icient of friction measured on the runway of
the International Airport of Fortaleza. The results present a feasible model with a coef icient of
determination of 77,5% to implement and monitor the conditions of operational safety.
The model may contribute to the airport operator when making decisions related to making
measurements of the coef icient of friction on site or taking measures of maintenance and re-
habilitation, reducing the subjectivity of these procedures. Moreover, the model proposed may
monitor the conditions of friction on the runway by the National Civil Aviation Agency.
Among the limitations inherent to this paper, it can be mentioned that it was developed using
data exclusively from the International Airport of Fortaleza and therefore, it might not be ade-
quate for other airports. The prediction model estimates the coef icient of friction measured
with the equipment Grip tester at 65km/h, 3m away from the runway centerline, so, situations
out of this scope may lead to errors. Furthermore, scenarios that present features that are either
too low or that exceed the values used for training by far, also may lead to errors.
Finally, it is important to clarify that the measurements that take place on the runways cannot
be abandoned because models are managerial, but measurements are veri ications in loco, that
is to say, they are real measures. Nevertheless, it is expected the model developed in this
research may offer a helping tool for an Airport Pavement Management System with the intent
to guarantee the safety of the landing and takeoff operations in the Brazilian airports.
ACKNOWLEDGEMENTS
This study was inanced in part by the Coordenaçã o de Aperfeiçoamento de Pessoal de Nı́vel Superior - Brasil (CAPES) - Finance
Code 001. To the Superintendency of Airport Infrastructure of the National Civil Aviation Agency (SIA/ANAC) for making data
available.
REFERENCES
ANAC (2016) Instrução Suplementar – IS No 153.205-001. Agê ncia Nacional de Aviaçã o Civil, Brası́lia, DF.
ANAC (2019) Regulamento Brasileiro da Aviação Civil (RBAC) no 153 Emenda no 04. Agê ncia Nacional de Aviaçã o Civil, Brası́lia,
DF.
Anupam, K.; S. K. Srirangam; A. Scarpas and C. Kasbergen (2013) In luence of temperature on tire-pavement friction analyses.
Transportation Research Record, n. 2369, p. 114–124. DOI:10.3141/2369-13
Aps, M. (2006) Classi2icação da aderência pneu-pavimento pelo índice combinado IFI – International Friction Index para revesti-
mentos asfálticos. Tese de Doutorado, Escola Polité cnica da Universidade de Sã o Paulo, Sã o Paulo. Disponı́vel em:
(acesso em 24/07/2021).
Beckley, M. E. (2016) Pavement Deterioration Modeling Using Historical Roughness Data. Master's Thesis, Arizona State Univer-
sity. Disponı́vel em: (acesso em 24/07/2021).
TRANSPORTES | ISSN: 2237-1346 11Quariguasi, J.B.F.; et al. Volume 29 | Número 2 | 2021
Bernucci, L. B.; L. M. G. da Motta; J. A. P. Ceratti and J. B. Soares (2008) Pavimentação asfáltica - Formação Básica para Enge-
nheiros. Abeda, Rio de Janeiro.
Bezerra Filho, C. I. F. and F. H. L. de Oliveira (2013) Aná lise da correlaçã o entre a macrotextura e o coeficiente de atrito em
pavimentos aeroportuá rios. In: XXVII Congresso de Pesquisa e Ensino em Transportes, ANPET, Belé m.
Bishop, C. M. (2006) Pattern recognition and machine learning. Springer.
Bocanegra, C. W. R. (2002) Procedimentos para tornar mais efetivo o uso das redes neurais arti2iciais em planejamento de trans-
portes. Dissertaçã o de Mestrado, Escola de Engenharia de Sã o Carlos da Universidade de Sã o Paulo, Sã o Carlos. Disponı́vel
em: < https://www.teses.usp.br/teses/disponiveis/18/18137/tde-06032002-131951/publico/C_Bocan.pdf> (acesso em
24/07/2021).
Bosurgi, G., and F. Tri irò (2005) A model based on arti icial neural networks and genetic algorithms for pavement mainte-
nance management. International Journal of Pavement Engineering, v. 6, n. 3, p. 201–209.
DOI:10.1080/10298430500195432
Celeste, A. B., and F. H. L. de Oliveira (2019) Study of retroanalysis of asphaltic pavements resilience modules with the use of
arti icial neural networks. Transportes, v. 27, n. 4, p. 123–133. DOI:10.14295/transportes.v27i4.1781
Cerezo, V.; M. T. Do and M. Kane (2012) Comparison of skid resistance evolution models. Seventh International Conference on
Maintenance and Rehabilitation of Pavements and Technological Control, Auckland, New Zealand.
Chelliah, T.; P. Stephanos; T. Smith and B. Kochen (2002) Developing a Design Policy to Improve Pavement Surface Characteris-
tics. Presented at 82nd Transportation Research Board Annual Meeting, Washington, D.C.
Chen, J. S.; C. C. Huang; C. H. Chen and K. Y. Su (2008) Effect of rubber deposits on runway pavement friction characteristics.
Transportation Research Record, n. 2068, p. 119–125. DOI:10.3141/2068-13
FAA (2014) Advisory Circular 150/5380-7B. Airport Pavement Management Program (PMP). Federal Aviation Administration.
Washington DC.
Flintsch, G. W.; J. P. Zaniewski and J. Delton (1996) Arti icial neural network for selecting pavement rehabilitation projects.
Transportation Research Record, n. 1524, p. 185–193. DOI:10.1177/0361198196152400122
Fwa, T. F.; W. T. Chan and C. T. Lim (1997) Decision framework for pavement friction management of airport runways. Journal
of Transportation Engineering, v. 123, n. 6, p. 429–435. DOI: 10.1061/(ASCE)0733-947X(1997)123:6(429)
Gé ron, A. (2017) Hands-On Machine Learning with Scikit-Learn & TensorFlow, 1st ed., O’Reilly.
Haas, R.; W. R. Hudson and L. C. Falls (2015) Pavement Asset Management, 3rd ed, Scrivener Publishing, Beverly.
Haykin, S. (2009) Neural networks and learning machines, 3rd ed, Pearson, Ontario.
Hossain, M. I.; L. S. P. Gopisetti and M. S. Miah (2019) International Roughness Index Prediction of Flexible Pavements Using
Neural Networks. Journal of Transportation Engineering, Part B: Pavements, v. 145, n. 1, p. 1–10.
DOI:10.1061/JPEODX.0000088.
Lecun, Y.; Y. Bengio and G. Hinton (2015) Deep learning. Nature, v. 521, p. 436–444. DOI:10.1038/nature14539
Masad, E.; A. Rezaei; A. Chowdhury and P. Harris (2009) Texas Transportation Institute. FHWA/TX-09/0-5627-1. Predicting
asphalt mixture skid resistance based on aggregate characteristics. Austin.
McDaniel, R. S.; K. J. Kowalski; A. Shah; J. Olek and R. J. Bernhard (2010) Joint Transportation Research Program, Indiana De-
partment of Transportation and Purdue University. FHWA/IN/JTRP-2009/22. Long Term Performance of a Porous Fric-
tion Course. West Lafayette. DOI: 10.5703/1288284314284
Oliveira, F. H. L. de. (2009) Proposição de estratégias de manutenção de pavimentos aeroportuários baseadas na macrotextura e
no atrito: estudo de caso do Aeroporto Internacional de Fortaleza. Dissertaçã o de Mestrado, Universidade Federal do Ceará ,
Fortaleza. Disponı́vel em: < http://www.repositorio.ufc.br/handle/riufc/4866> (acesso em: 24/07/2021)
Oliveira, P. V. S. (2017) Estudo preliminar do comportamento da capacidade de atrito nas pistas de pouso e decolagem do Aero-
porto Pinto Martins. Monogra ia, Universidade Federal do Ceará . Disponı́vel em: < http://www.repositorio.ufc.br/han-
dle/riufc/29491> (acesso em: 24/07/2021)
Pinheiro Neto, J. C.; F. H. L. de Oliveira and M. F. P. Aguiar (2015) Aná lise da correlaçã o linear de parâ metros de aderê ncia em
pavimentos aeroportuá rios: estudo de caso do Aeroporto Internacional Pinto Martins. In: 44 a RAPv – Reunião Anual de
Pavimentação e 18o ENACOR – Encontro Nacional de Conservação Rodoviária. Foz do Iguaçu, PR.
Ramos, S. P.; L. C. de Almeida; F. H. L. de Oliveira and M. F. P. Aguiar (2015). Verificaçã o da correlaçã o entre os parâ metros de
aderê ncia nas pistas de pousos e decolagens dos aeroportos de Fortaleza/CE, Juazeiro do Norte/CE e Petrolina/PE. In:
Congresso Técnico Científico da Engenharia e da Agronomia, CONTECC. Fortaleza.
Ribeiro, A. J. A. (2013) Um método para localização e estimação das características geotécnicas dos solos da Região Metropoli-
tana de Fortaleza-CE para 2ins de pavimentação. Dissertaçã o de Mestrado, Universidade Federal do Ceará , Fortaleza. Dispo-
nı́vel em: (acesso em: 24/07/2021)
Ribeiro, A. J. A., C. A. U. da Silva and S. H. D. A. Barroso (2018) Metodologia de baixo custo para mapeamento geoté cnico apli-
cado à pavimentaçã o. Transportes, v. 26, n. 2, p. 84–100. DOI:10.14295/transportes.v26i2.1491
Rodrigues Filho, O. S. (2006) Características de aderência de revestimentos asfálticos aeroportuários - Estudo de caso do Aero-
porto Internacional de São Paulo/ Congonhas. Dissertaçã o de Mestrado, Escola Polité cnica da Universidade de Sã o Paulo.
Disponı́vel em: < https://teses.usp.br/teses/disponiveis/3/3138/tde-01122006-142419/pt-br.php> (acesso em:
24/07/2021)
Santos, A.; E. Freitas; S. Faria; J. R. M. Oliveira and A. M. A. C. Rocha (2014) Degradation Prediction Model for Friction in High-
ways. In: Murgante B. et al. (eds) Computational Science and Its Applications – ICCSA 2014. ICCSA 2014. Lecture Notes in
Computer Science, v. 8581. Springer, Cham. DOI:10.1007/978-3-319-09150-1_44
TRANSPORTES | ISSN: 2237-1346 12Quariguasi, J.B.F.; et al. Volume 29 | Número 2 | 2021
Shahin, M. Y. (2005) Pavement Management for Airports, Roads, and Parking Lots, 2nd ed., Springer, New York.
Silva, J. P. S. (2008) Aderência Pneu-Pavimento em revestimentos asfálticos aeroportuários. Dissertaçã o de Mestrado, Universi-
dade de Brası́lia, Brası́lia, DF. Disponı́vel em: < https://repositorio.unb.br/handle/10482/3470> (acesso em:
24/07/2021)
Skerritt, W. H. (1993) Aggregate type and traf ic volume as controlling factors in bituminous pavement friction. Transporta-
tion Research Record, n. 1418, p. 22–29.
Susanna, A.; M. Crispino; F. Giustozzi and E. Toraldo (2017) Deterioration trends of asphalt pavement friction and roughness
from medium-term surveys on major Italian roads. International Journal of Pavement Research and Technology, v. 10, n. 5,
p. 421–433. DOI:10.1016/j.ijprt.2017.07.002
Wambold, J. C.; C. R. Antle; J. J. Henry and Z. Rado (1995) International PIARC experiment to compare and harmonize texture
and skid resistance measurements. PIARC World Road Association, Paris, France.
Yang, G.; Q. J. Li; Y. Zhan; Y. Fei and A. Zhang (2018) Convolutional Neural Network-Based Friction Model Using Pavement Tex-
ture Data. Journal of Computing in Civil Engineering, v. 32, n. 6, p. 1–10. DOI:10.1061/(ASCE)CP.1943-5487.0000797
Yao, L.; Q. Dong; J. Jiang and F. Ni (2019) Establishment of Prediction Models of Asphalt Pavement Performance based on a
Novel Data Calibration Method and Neural Network. Transportation Research Record, v. 2673, n. 1, p. 66–82.
DOI:10.1177/0361198118822501
TRANSPORTES | ISSN: 2237-1346 13You can also read