A sensitivity study of rising compound coastal inundation over large flood plains in a changing climate
←
→
Page content transcription
If your browser does not render page correctly, please read the page content below

www.nature.com/scientificreports
OPEN A sensitivity study of rising
compound coastal inundation
over large flood plains
in a changing climate
Y. Peter Sheng*, Vladimir A. Paramygin, Kun Yang & Adail A. Rivera‑Nieves
Coastal flood hazards and damage to coastal communities are increasing steeply and nonlinearly due
to the compound impact of intensifying tropical cyclones (TCs) and accelerating sea-level rise (SLR).
We expand the probabilistic coastal flood hazard analysis framework to facilitate coastal adaptation
by simulating the compound impact of predicted intensifying TCs and rising sea levels in the twenty-
first century. We compared the characteristics of landfalling TCs in Florida (FL) and southwest Florida
(SWFL) for the late twentieth and twenty-first centuries predicted by several climate models and
downscaling models. TCs predicted by four climate models, one without downscaling and three
with downscaling, were used by a coupled surge-wave model to predict the future flood hazard
due to compound effects of TCs and SLR over a large SWFL coastal flood plain. By 2100, the coastal
inundation metrics of the 1% annual chance coastal flood could become almost 3–7 folds of their
current values, depending on the climate and downscaling models, Representative Concentration
Pathway scenarios, Atlantic Multi-decadal Oscillation phases, TCs, SLR, precipitation, and how TCs
and SLR are incorporated. By 2100, the current 1% (100-year) inundation event could become a 3-year
event, and the 0.2% (500-year) inundation event could become a 5-year event.
Coastal flood vulnerability has increased worldwide due to gradually accelerating sea-level rise (SLR)1–4, intensi-
fying and wetter tropical cyclones (TCs)5,6 driven by climate change and increasing coastal development. Coastal
communities have incurred dramatically increasing TC-induced flood d amages7, which are highly dependent on
the local conditions of the flood, wave, infrastructure, SLR, landscape, and their i nteractions8. While 40% of the
world population lives in the coastal region within 100 km of the coastline, 10% of the population lives within the
low elevation coastal zone (LECZ) less than 10 m above the sea-level9. In Florida, 76.5% of the population lives
in the coastal r egion10. LECZ constitutes 98.37% of Collier County in southwest Florida. Of the 258 U.S. weather
disasters during1980-2020, tropical cyclones caused the most damage: $945.9 billion total, with an average cost
of almost $21.5 billion per e vent11. The expected annual loss of residential properties due to hurricanes is $34B,
out of which $20B is due to flood12. Florida suffered catastrophic losses due to many major hurricanes, including
Andrew13, Charley14–16, Ivan17, Wilma16,18, Irma19, and Michael19 in the past three decades. The flood-induced
property loss is expected to increase dramatically in the following decades. Therefore, regional and local scale
adaptation plans need to be developed quickly to minimize future flood damage based on the best understand-
ing of how a changing climate will impact the TCs and SLR and coastal flooding in the twenty-first century.
To facilitate coastal adaptation planning, the status quo probabilistic coastal flood analysis f ramework9, which
considers the 1% coastal flooding due to an ensemble of synthetic TCs based on historical hurricane data20,
needs to be expanded to incorporate the compound effects of TCs and SLR in a changing climate. Studies on
future 1% coastal flooding over a large coastal flood plain, which are needed for adaptation planning by coastal
communities, are s carce21,22. Studies of the impact of TCs and SLR on future 1% storm surge at coastal stations
or impact of SLR on a single TC23,24 do not provide sufficient spatial detail of coastal flooding for adaptation
planning by coastal communities.
While it is known that SLR is directly increasing nuisance tide flooding and groundwater flooding, the rising
sea-level and warmer ocean and atmosphere also appear to be causing more intense and wetter tropical cyclones.
Projection of future coastal flood hazards requires the prediction of future tropical cyclones by climate models,
which generally have a relatively coarse resolution (~ 25–50 km), and downscaling models. A group of leading
Coastal and Oceanographic Engineering Program, University of Florida, Gainesville, FL 32611‑6580, USA. *email:
pete@coastal.ufl.edu
Scientific Reports | (2022) 12:3403 | https://doi.org/10.1038/s41598-022-07010-z 1
Vol.:(0123456789)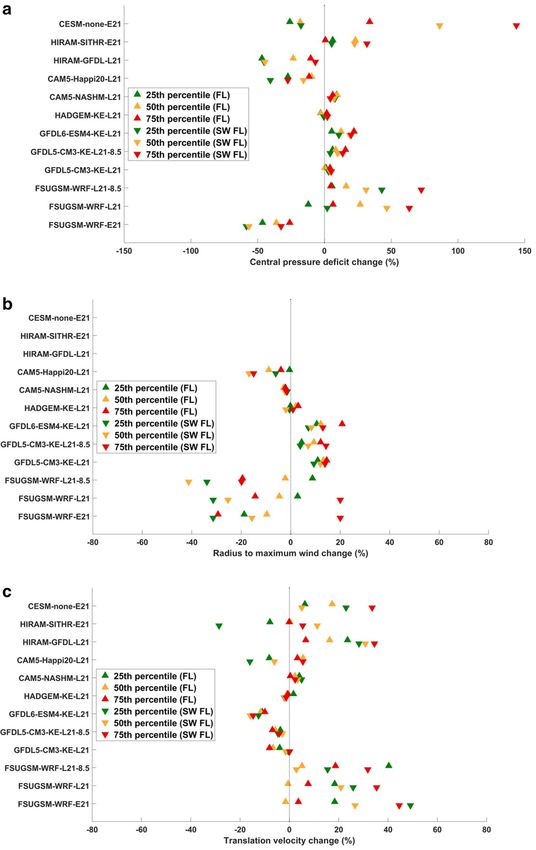
www.nature.com/scientificreports/
climate and hurricane scientists reached a consensus estimate that, by 2100, globally averaged hurricane wind
intensity will increase by 2–11%, and the globally-averaged frequency of hurricanes will decrease by 6–34%4.
Globally, it is about 25% more likely now that a TC will be at major TC intensity (Category 3, 4, 5) than four dec-
ades ago25. In the Atlantic, the proportion has more than doubled. Almost all mortality and damage are caused by
major TCs26. A recent s tudy6 expressed high confidence that the global average TC intensity will increase and the
global proportion of very intense (category 4–5) TCs will increase. The median projected change is about + 13%.
These intense TCs are responsible for the greatest damage and mortality rates.
While our understanding of the role of climate change in affecting TCs over global and basin scales has pro-
gressed in the past two decades, there is limited understanding of the future TCs and their impacts on coastal
flood hazards due to inadequate data and modeling studies. Adding to the uncertainties of the coastal surge and
wave models and data for predicting coastal flooding14,27, considerable uncertainties are associated with predict-
ing future TCs by climate and downscaling models28–30, particularly on the regional and local scales. Uncertainties
arise from the different parameterization of the important physical processes and resolution of the climate and
downscaling models. A comprehensive uncertainty analysis surrounding the prediction of future TCs requires
an excessive amount of data that are unavailable and beyond the scope of this study. Instead, this study focus on
the sensitivity of future probabilistic flood hazard over a large coastal floodplain in SW FL to several important
factors: SLR, future TCs predicted by various climate and downscaling models, Representative Concentration
Pathway (RCP) scenarios, Atlantic Multidecadal Oscillation (AMO) phases, precipitation, and how SLR and TCs
are combined in coastal model simulations. We hope to develop a new paradigm for assessing future coastal
flood hazards in coastal regions impacted by TCs and SLR globally.
We examine the feasibility and sensitivity of using TC predictions by climate models with relatively coarse
model resolution (> 50 km for most global climate models and 25 km for high-resolution global climate models)
and downscaling models with very different techniques for coastal flood analysis over 425 km long coastline in
SWFL which exceeds the combined coastlines of New Jersey and New York (Fig. 1). With the 83rd percentile SLR
at Naples reaching 2.54 m by 2 1001,2, high TC landfall rate, intensifying T
Cs5,6, a flat bathymetry and topography,
and a rapidly growing population, SWFL ranks among the most vulnerable US coasts for future flooding. In
addition, the very gentle bottom slope of ~ 1/1000 for 100 km offshore makes SWFL more prone to flood impact
during storms versus southeast Florida with a much steeper bottom slope. Southwest Florida (SWFL, including
Charlotte, Lee, and Collier Counties), home to more than 1.3 million people, is the second most hurricane-prone
area in Florida with 49 historical hurricanes and two of the top 10 costliest hurricanes in the US ($30B for Irma
in 2017 and $11B for Wilma in 2005).
In the following methods section, we describe how future TCs and SLR scenarios are selected, the coastal
surge and wave models used for simulating coastal flooding during individual TC&SLR combinations, and the
statistical method used for determining the 1% coastal flood elevation over the large coastal flood plain. We then
present the 1% coastal flood results in 2020, 2030, 2060, and 2100 in terms of the evolution of four major coastal
inundation metrics. Accomplishments and future studies are then discussed.
Methods
Selection of tropical cyclones for the twenty‑first century. We consider TC datasets predicted by
three global climate models (GCMs) (CESM30, HiRAM-SITHR31, and CAM5.132) without downscaling, and
six global climate models (CAM5.333, HiRAM34, HADGEM26, GFDL5[GFDL’s GCM for CMIP5, i.e., Coupled
Model Intercomparison Project Phase 5 ]35, and GFDL6 [GFDL’s GCM for CMIP6, i.e., Coupled Model Inter-
comparison Project Phase 6]36, and FSUGSM37 with four very different downscaling models (NASHM38 for
CAM5.3, GFDL Hurricane M odel39 for HiRAM, W RF40 for FSUSGM, and KE [Kerry Emanuel’s m odel]41 for
the others), and two historical TC datasets (HURDAT20 and NCEP242 reanalysis). The four downscaling mod-
els are very different: NASHM is a stochastic model with 1000 repeats of the global model simulation period,
GFDL’s hurricane model is a regional climate model (RCM), a regional scale WRF with a 12-km resolution was
used to downscale the results of the global FSUGSM model, while KE is a statistical-deterministic model forced
by environmental conditions independent of the TCs predicted by the global climate models as the other two
downscaling models do.
Except for the historical datasets, all datasets are associated with different times (e.g., late twentieth century
and early and/or late twenty-first century), AMO phases (positive and negative), and RCP scenarios (4.5 and
8.5). Here we examine the sensitivity of changes in landfalling TC characteristics in SWFL and FL in the twenty-
first century to climate and downscaling models, AMO phases, and RCP scenarios. We focus on the predicted
changes of three dominant landfalling TC characteristics: central pressure deficit (∆Cp), radius of maximum wind
(Rmax), and TC translation velocity ( Vf ), before selecting TC datasets for coastal flooding analysis. The naming
convention of the TC datasets is described in the caption of Fig. SI-1.
Coupled hydrodynamic and wave models. Curvilinear-grid hydrodynamics in 3D (CH3D) is a hydro-
dynamic model originally developed by Sheng43,44, which can simulate 2-D and 3-D barotropic and baroclinic
circulation driven by tide, wind, and density gradients. CH3D is more efficient than many high-fidelity hydro-
dynamic models (e.g., ADCIRC45, POM46, and FVCOM47) using a semi-implicit numerical algorithm for similar
grid resolution14,48. CH3D is dynamically coupled to S WAN49 to simulate surge, wave, and flooding in coastal
regions. In addition, basin-scale ADCIRC was used to provide offshore open boundary conditions. This inte-
grated storm surge modeling system18,46 can simulate flooding and drying with non-linear terms and has been
used successfully to simulate storm surges along the US Atlantic and Gulf coasts during Charley, Wilma, and
Irma, which significantly impacted S WFL13–19. Details of the CH3D model and the SWAN model can be found
in numerous papers in the references, particularly Sheng et al.48 and Booij et al.49; they will not be repeated here.
Scientific Reports | (2022) 12:3403 | https://doi.org/10.1038/s41598-022-07010-z 2
Vol:.(1234567890)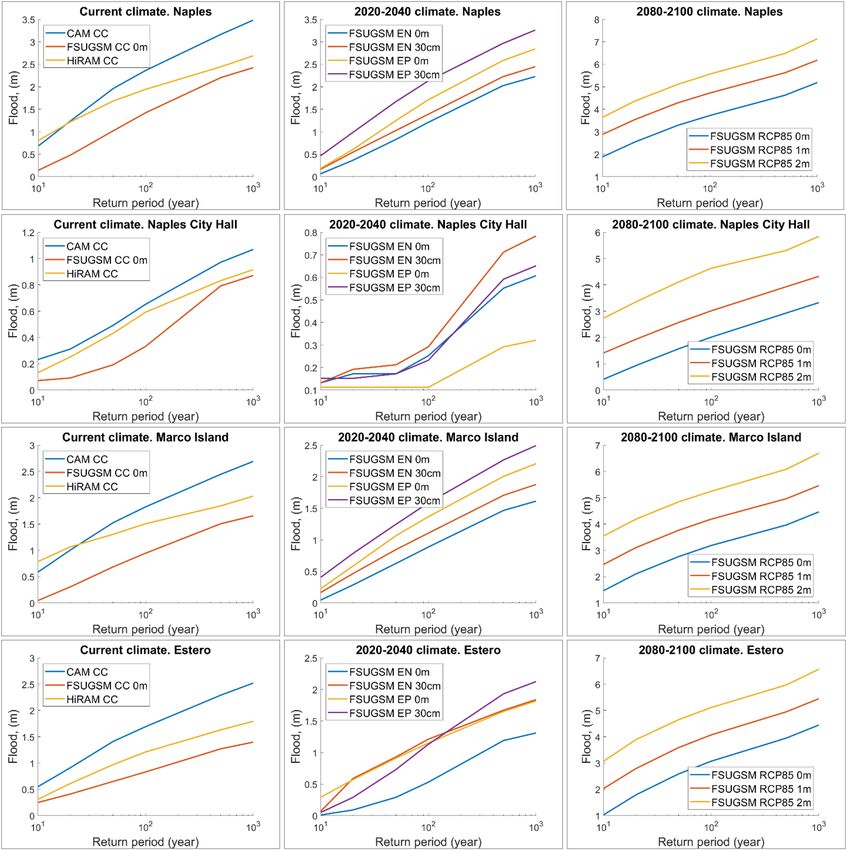
www.nature.com/scientificreports/
Figure 1. (a) SWFL model domain inside the large ADCIRC or CH3D domain; (b) Southeastern US domain
used by Liu et al. (2014) for TC downscaling analysis with 12-km WRF; (c) SWFL model domain with
idealized coastline for JPM and CH3D-SWAN model output stations. Elevations are shown with respect to
NAVD88. Gentle bathymetric and topographic slope (~ 1/1000) is much lower than that in Southeast Florida.
The simplified coastline is 425 km long, constituting 20% of Florida’s coastline and exceeding the combined
coastlines of NJ and NY.
The coupled surge-wave model CH3D-SWAN, driven by a synthetic parametric wind m odel50, was used with
the Joint-Probability-Method with Optimal Sampling (JPM-OS)21,51–53. First, the wind and atmospheric pres-
sure fields were calculated based on the location of the storm, pressure at the center, radius to maximum winds,
and translational velocity of the storm. Next, an ensemble of straight-line storm tracks, with all parameters kept
constant until landfall and then allowed to decrease, was g enerated53. Finally, storms were simulated by a 2D
vertically averaged version of CH3D-SWAN, which accurately (with 10% of relative Root Mean Square Error)
simulated the observed High Water Marks (HWMs) in the region during Hurricane I rma19.
The SWFL domain (Fig. 1b) contains 386,140 curvilinear grid cells, minimum resolution of 20 m and aver-
age resolution of 200 m, with spatially varying Manning’s c oefficients53, defined based on the USGS NLCD2011
dataset with a value of 0.02 in the open water. GEOphysical DAta System (GEODAS) and USGS National Eleva-
tion Dataset were used as the source of bathymetric (90 m horizontal resolution) and topographic (5–10 m
horizontal resolution) data referenced to NAVD88. The flood (or inundation) elevation is the difference between
the water level and the local topography. Along the open coastal boundary, the water level is the superposition
of the surge simulated by ADCIRC plus the SLR value. The wetting-and-drying condition is applied with zero
pressure gradient in the perpendicular direction along the land boundary without prescribing any SLR value.
To reduce the computational effort, this study used the vertically-averaged version of CH3D-SWAN in which
land-use features (buildings, mangroves, marshes, etc.) and bathymetric features represented by a spatially-
varying Manning’s coefficient for bottom friction.
Scientific Reports | (2022) 12:3403 | https://doi.org/10.1038/s41598-022-07010-z 3
Vol.:(0123456789)
www.nature.com/scientificreports/
To examine the effect of precipitation, we used the precipitation data from NOAA’s probabilistic precipita-
tion estimates for the region for simplicity. The 1% precipitation at Naples was 16 inches over three days for the
current climate. For 2080–2100, the 0.2% rainfall data of 22 inches over three days were utilized to reflect the
increase in precipitation in future climates. Precipitation is applied uniformly over the model domain during
each model simulation of a synthetic TC.
Statistical method (JPM, JPM‑OS, and MCLC). The JPM statistical method allows the generation of a
set of all possible TCs according to the joint probabilities of the TCs predicted by the climate and downscaling
models for a coastal region during a specific time period (e.g., 20 years). The JPM uses the probabilistic descrip-
tions of landfall parameters and storm rate to determine a set of synthetic storms called test storms. A single
storm with a set of the five landfall parameters is called a “node ( x )” in five-dimensional parameter space:
(1)
x = pc Rm θVf L0
The storms are simulated with a numerical model to generate the peak water level height η(x) for the model
domain. The annual rate of occurrence of the water level greater than or equal to a specific value η for a cell inside
the model domain is calculated by the JPM integral:
P[ηmax > η] = . . . fX (x)P[η(x) > η]dx (2)
x
The integral depends on the mean annual rate of all storms for the domain, the joint probability density
function fX (x), and the conditional probability that a particular set of storm characteristics xi will generate a
water level height greater than η, is P[η(xi ) > η]. The integral is evaluated for all test storms, and the annual
probability, which has the unit of storms per unit time, is calculated. The annual probability for the storms to
produce water level exceeding a value η can be approximately calculated by
P[ηmax > η] ≈ ni=1 i P[η(xi ) > η] (3)
where n is the number of the test storms, and P is the probability of the storm with the landfall characteristics
xi . Typically, the 1% annual chance flood (also known as the 100-year flood) elevation at any given location is
exceeded by the flood elevation during hundreds of low-frequency storms with a cumulative frequency of 1%.
In JPM-OS, a few hundred “optimal” (representative) storms are selected from the JPM test storms by analyz-
ing the discrete probability distribution functions (pdfs) of the five storm characteristics. A surge model then
simulates the optimal storms to determine the corresponding peak water levels, which are then interpolated
to obtain the peak water levels for all test storms, and probabilistic flood maps for different return periods are
calculated.
Various versions of the JPM-OS51–53, use different optimization schemes. The merits and shortcomings of
JPM-OS methods were compared by Yang et al.53, who developed an objective and efficient JPM-OS based on
kriging to significantly improve the previous accuracy, efficiency, and objectiveness of JPM-OS methods. They
showed that the 1% flood maps produced with 300+ optimal storms were nearly identical to that produced from
the 20,625 possible storms described by the discrete pdfs of five major storm characteristics. Furthermore, as
explained in Yang et al.53, the effect of tide on the 1% flood map is relatively small, partially due to relatively
small tides in the region. The JPM-OS can be found in Yang et al.53; hence it will not be repeated here. In this
study, for each of the 20-year periods and based on the predicted TCs, 190 optimal storms were developed for
simulation of probabilistic flood with a specific SLR value prescribed at the open boundary of the coastal model.
While most of the coastal inundation results were obtained using the JMP-OS, we also applied the Rapid
Forecast and Mapping System (RFMS)19 along with the Monte Carlo life-cycle (MCLC)54, which was repeated
10,000 times, to calculate the coastal inundation metrics due to a TC that induced a 1% annual chance Naples
water level, and another TC that produced a 1% TIV (50 percentile) in the model domain. The coastal inunda-
tion metrics from these two simulations are compared with those obtained with CH3D-SWAN and JPM-OS.
Coastal inundation metrics. The 1% annual chance inundation metrics, including Total Inundation
Volume (TIV), Total Inundation Area (TIA), Maximum Inundation Height (MIH), and Averaged Inundation
Height (AIH), for the scenarios listed in Table 1 are shown in Fig. 3. The TIA and TIV are defined as13:
TIA = dxdy (4)
Landward Area
(5)
TIV = [Hmax x, y − H0 x, y ]dxdy
Landward Area
where Hmax (x, y) and H0 (x, y) are the maximum water level and the land elevation at land cells (x, y), respectively
for each scenario. MIH = Maximum Inundation Height while AIH is the average value of MIH over the entire
domain. These statistics have been used as objective metrics to quantify TC-induced flood hazard over a coastal
flood plain by a single TC and the 1% flood due to a TC e nsemble19,53,55.
1% and 0.2% water level at Naples tide station for model verification. To verify the 1% flood
calculation, we compared the model simulated probabilistic water level at Naples tide gauge based on the TCs
generated by FSUGSM-WRF for the current climate vs. those generated by the peak-over-threshold (POT)
Scientific Reports | (2022) 12:3403 | https://doi.org/10.1038/s41598-022-07010-z 4
Vol:.(1234567890)
www.nature.com/scientificreports/
Simulation scenarios Time period RCP AMO phase TCs SLR (m) Percentile of SLR value (Sweet et al.2)
A FSUGSM-WRF-20 1982–2009 (CC) n/a n/a 6 0.0 –
B CAM5.1–20 1995–2005 (CC) n/a n/a 12 0.0 –
C HiRAM-GFDL-20 1981–2000 (CC) n/a n/a 7 0.0 –
D GFDL6-ESM4-KE-20 1850–2014 (CC) n/a n/a > 180 0.0 –
E FSUGSM-WRF-E21-N 2020–2039 (2040) 4.5 Negative 4 0.0 0th
F FSUGSM-WRF-E21-N 2020–2039 (2040) 4.5 Negative 4 0.3 99th
G FSUGSM-WRF-E21-P 2020–2039 (2040) 4.5 Positive 5 0.0 0th
H FSUGSM-WRF-E21-P 2020–2039 (2040) 4.5 Positive 5 0.3 99th
I FSUGSM-WRF-L21-N 2080–2099 (2100) 4.5 Negative 9 1.0 83rd
J FSUGSM-WRF-L21-P 2080–2099 (2100) 4.5 Positive 9 1.0 83rd
K FSUGSM-WRF-L21-8.5 2080–2099 (2100) 8.5 Positive 9 0.0 0th
L FSUGSM-WRF-L21-8.5 2080–2099 (2100) 8.5 Positive 9 1.0 83rd
M FSUGSM-WRF-L21-8.5 2080–2099 (2100) 8.5 Positive 9 2.0 99.7th
N CAM5.1-L21-8.5 2079–2099 (2100) 8.5 n/a 12 1.0 83rd
O HiRAM-GFDL-L21-4.5 2080–2099 (2100) 4.5 n/a 7 1.0 83rd
P GFDL6-ESM4-KE-L21 2015–2100 (2100) 4.5 n/a > 180 1.0 83rd
Table 1. Scenarios for coastal inundation simulations.
ethod56 from the historical hourly water level data from 1965 to 2019. The peak-over-threshold method first
m
detrends the hourly observed water level data, computes the daily maxima of water level, and selects a threshold
corresponding to the 99th percentile (after trial and error) of observed water levels. Then the threshold exceed-
ances are fitted to a generalized Pareto distribution (GPD), and the return periods are determined from the
distribution. The 1% and 0.2% water levels at Naples are (1.67 m, 1.53 m) from the model and data, respectively,
while the 0.2% water levels are (2.47 m, 2.24 m), respectively. The good agreement between the 1% and 0.2%
water levels calculated by the model and data indicates the robustness of the model simulation and statistical
method.
Results
Characteristics of future and historical TCs. Figure SI-1a and SI-1b show ∆Cp values for landfalling
TCs in FL and SWFL predicted by the above-mentioned climate and downscaling models as well as from histori-
cal data. ∆Cp values predicted by various climate and downscaling models for FL (Fig. SI-1a) and SWFL (Fig. SI-
1b) generally increase from the late twentieth century to the late twenty-first century, except those obtained
by CESM and HiRAM-GFDL. FSUGSM-WRF and GFDL6-ESM4-KE results show a significant increase in
∆Cp over the twenty-first century. According to the FSUGSM-WRF, CAM5.1, and GFDL-KE results, in the late
twenty-first century, ∆Cp and Rmax for RCP8.5 are lower than those during RCP4.5, perhaps due to stabilization
of the upper atmosphere due to excessive warming. ∆Cp and R max also show slight increases during the positive
AMO phase. Rmax values for landfalling TCs in FL (Fig. SI-1c) and SWFL (Fig. SI-1d) show wider variation over
time, with an increase predicted by GFDL5-KE and GFDL6-KE, decrease predicted by FSUGSM-WRF (but
increase for 75th percentile and higher Rmax), and little change by other models. Rmax is unavailable from CESM
and HiRAM. As shown in Fig. SI-1e and SI-f, the translation velocity ( Vf ) changed relatively little over time, in
which some models showed a slight decrease while others showed a slight increase. The overall patterns for FL
and SW-FL are generally consistent, with a few exceptions.
It should be noted that FSUGSM-WRF-E21 and FSUGSM-WRF-L21 include the results for positive and
negative AMO phases. Each scenario covers a 20-year period, so combining the TCs from positive and negative
AMOs would double the number of TCs for each period. Compared with the ∆Cp and Rmax for historical TCs,
GFDL-KE and FSUGSM-WRF predicted lower ∆Cp and larger Rmax for the twentieth century.
To summarize the predicted TCs by various models, Fig. 2 shows the temporal trend of ∆Cp (Fig. 2a), Rmax
(Fig. 2b), and V
f (Fig. 2c) for FL and SWFL. The orange triangles represent the percent change of the median
(50th percentile) value of the TC characteristics from the current climate (twentieth century) value, while red
and green triangles represent the trends of the 75th percentile and 25th percentile values. For example, when
considering 1% coastal flood and its resulting damage on structures, the trend of the 75th percentile and higher
values plays a more significant role than those for the 25th and 50th percentiles. On the other hand, the trend of
the 25th percentile value has more impact on the more frequent (10–20%) flood.
The trends over FL and SWFL predicted by the CAM5-NASHM, HADGEM-KE, and GFDL-KE models
are pretty consistent due to the large number of tracks these models produced. Those predicted by the CESM,
HiRAM, CAM5-Happi20, and FSUGSM-WRF, which contain fewer tracks, show more variation between the FL
and SW FL scales. This suggests decreased uncertainty in TC prediction on regional and local scales as the num-
ber of TCs in the dataset increases. CAM5-NASHM and HADGEM-KE results show relatively minor changes
over the twenty-first century, while CESM results do not contain R max and show excessive changes in ∆Cp.
GFDL6-KE and FSUGSM-WRF results show the most significant changes over the twenty-first century in SWFL.
The median values of (∆Cp, R max, Vf ) of the FSUGSM-WRF results changed by (45%, −25%, 22%) respectively,
Scientific Reports | (2022) 12:3403 | https://doi.org/10.1038/s41598-022-07010-z 5
Vol.:(0123456789)www.nature.com/scientificreports/
Figure 2. (a) Percent change in various percentiles (25th, 50th, and 75th) of ∆Cp over its respective value in
the twentieth century in FL (triangles) and SWFL (inverted triangles). (b) Percent change in various percentiles
(25th, 50th, and 75th) of Rmax over its respective value in the twentieth century in FL (triangles) and SWFL
(inverted triangles). (c) Percent change in various percentiles (25th, 50th, and 75th) of Vf over its respective
value in the twentieth century in FL (triangles) and SWFL (inverted triangles).
Scientific Reports | (2022) 12:3403 | https://doi.org/10.1038/s41598-022-07010-z 6
Vol:.(1234567890)www.nature.com/scientificreports/
Figure 3. (a) Average Inundation Height (AIH) of the 1% annual chance flood hazard in SWFL. (b) Maximum
Inundation Height (MIH) of the 1% annual chance flood hazard in SWFL. (c) Total Inundation Area (TIA) of
the 1% annual chance flood hazard in SWFL. (d) Total Inundation Volume (TIV) of the 1% annual chance flood
hazard in SWFL.
while the GFDL6-KE results changed by (20%, 5%, −15%) respectively. Interestingly, the 75th percentile values
changes were (20%, 15%, −15%) for the GFDL6-KE results while (65%, 20%, 35%) for the FSUGSM-WRF results.
Design of scenarios for coastal flooding analysis. Based on the results presented in "Selection of
tropical cyclones for the twenty-first century", we used the TCs predicted by one global climate model (CAM5.1)
without downscaling and three global models with downscaling (HiRAM-GFDL, GFDL6-KE, and FSUGSM-
WRF) to investigate the compound coastal inundation due to TCs and SLR in SWFL during the twenty-first
century. HiRAM-GFDL has a 50-km resolution. KE (Kerry Emanuel’s deterministic-statistical model)41 was
applied to numerous global climate models35,36 and generated hundreds to thousands of TCs for the FL and
SWFL, but here we consider the more recent GFDL6-KE results for simplicity. On the other hand, FSUGSM-
WRF generated TCs with a 12-km WRF regional climate model37,40 for the Southeastern US and contained TCs
for more scenarios than any other model. FSUGSM-WRF predicted 60 TCs for FL during 1982–2009 with seven
landfalls in the SWFL domain (Fig. 1c), which compared well with the 64 historical TCs and seven landfalls dur-
ing the same period for FL and SWFL, respectively. It is noted that FSUGSM’s cyclone detection algorithm only
recognized hurricanes with Cat-1 intensity or higher. The current climate 1% flood maps for SWFL based on
FSUGSM-WRF predictions and historical TCs compared well53.
Sixteen simulation scenarios were designed (Table 1) for coastal flood analysis. For FSUGSM-RCP4.5 sce-
narios, negative and positive AMO phases were considered, while only the positive AMO phase was considered
for the RCP8.5. TCs for the current climate (CC) and late twenty-first century were predicted by all the models,
but only FSUGSM-WRF predicted TCs for the early twenty-first century. SLR values include 0 and 0.3 m (99th
percentile) for the early period and 1 m (83rd percentile) and 2 m (99.7th percentile) for the late period, based
on predicted Global Mean Sea Level (GMSL)2. For simplicity, we used the GMSL instead of the RSL (Relative
Sea-Level) at Naples and Fort Myers (~ 1.15 m for 50th percentile of 1 m GMSL scenario and 2.55 m for 50th
percentile of 2 m GMSL scenario) for this sensitivity study. Zero SLR values are included for the early and late
twenty-first century to allow assessment of the effect of SLR vs. that of TCs. Based on the TCs for each scenario,
JPM-OS allows the generation of an optimal TC ensemble of 190 TCs for flood simulations by the coastal models.
1% coastal flood hazard in twenty‑first century. As shown in Fig. 3, the inundation metrics (AIH,
MIH, TIA, and TIV) of the 1% annual chance coastal flood in the early twenty-first century increase slightly over
those for the current climate (Fig. 3). The inundation metrics increase significantly by 2100 due to increasing
TC intensity and SLR. The current climate inundation metrics from the GFDL6-ESM4-KE and FSUGSM-WRF
agree well, while those from HiRAM-GFDL and CAM5.1 show slightly higher values of MIH and TIV. For the
late twenty-first century, all models predicted similarly high inundation metrics for RCP4.5 with 1 m SLR. The
Scientific Reports | (2022) 12:3403 | https://doi.org/10.1038/s41598-022-07010-z 7
Vol.:(0123456789)www.nature.com/scientificreports/
FSUGSM- FSUGSM- FSUGSM- FSUGSM-
WRF WRF WRF WRF
HiRAM-GFDL CAM5.1 GFDL6-ESM4-KE AMO- AMO+ AMO+ AMO+
RCP4.5 RCP8.5 RCP4.5 RCP4.5 RCP4.5 RCP8.5 RCP8.5
1 m SLR 1 m SLR 1 m SLR 1 m SLR 1 m SLR 1 m SLR 2 m SLR
AIH (%) 68 79 68 88 94 134 194
MIH (%) 75 120 78 80 125 200 238
TIA (%) 46 50 44 84 107 124 158
TIV (%) 140 228 114 171 246 367 568
Table 2. Percent increase of inundation metrics from current climate to 2100 for four different models. These
values are calculated as follows: Rate of increase of X(%) = (X2100 − avg(X)/avg(X2000 ).
inundation metrics increase further from negative to positive AMO phase, from RCP4.5 to RCP8.5, and SLR
from 1 to 2 m.
Table 2 shows the percent change of inundation metrics relative to the perspective average current climate
values. The inundation metrics increase significantly from the current climate to 2100, following the ascending
order of HiRAM-GFDL, CAM5.1, GFDL6-ESM4-KE, and FSUGSM-WRF. The inundation metrics in 2100 pre-
dicted by the four different models are comparable and consistent. Within the FSUGSM-WRF results, inundation
metrics increase for positive AMO, RCP8.5, and SLR. The GFDL6-ESM4-KE-L21and FSUGSM-WRF-L21-N
produced similar results showing a 2.4-fold increase in maximum inundation height and a 44–84% increase
in total inundation area. For the worst case, FSUGSM-WRF-L21-8.5 with 2 m SLR, total inundation area will
increase by 1.58 times while maximum inundation height could increase by three times the current climate value.
These results demonstrate the sensitivity of future coastal inundation to TC, SLR, RCP, AMO, and climate and
downscaling models. It is noted that, according to the latest IPCC Assessment Report (AR6)57 the 2 m SLR in
2100 is highly unlikely.
Evolution of 1% inundation return period. Comparing the 1% annual chance TIV for the FSUGSM-
WRF RCP8.5 in 2100 with the TIV for the current climate, it is found that the 100-year TIV for the current
climate could have a 3-year return period by 2100. The current climate’s 0.2% annual chance TIV could have a
return period of 5 years by 2100. However, the 2 m SLR in 2100 is highly unlikely according to the latest IPCC
AR657.
Evolution of local 10–1000 year flood elevation. Based on the CAM5.1, HiRAM-GFDL, and
FSUGSM-WRF results, we present the flood elevation for CC (Current Climate), 2020–2040, and 2080–2100
at a few selected land site (Estero, Naples City Hall, and Marco Island) as well as the storm surge at the Naples
tide gauge station which is in the open water (see Fig. 1c for site locations). For CC, the 100-year flood agrees
well with that obtained by analyzing Naples’s historical water level data. However, the flood elevations at land
sites vary significantly due to local storm surge and land conditions. Therefore, it is not feasible to use the Naples
surge with a bathtub model (applying the Naples surge over the entire flood plain) to estimate the flooding over
the large flood plain.
Figure 4 shows that the inundation height increases significantly with time and return period and climate
models and scenarios. While the 100-year inundation is the foundation for FEMA to collect flood insurance, it
may be prudent for communities to use 500-year inundation for coastal resilience planning. Coastal inundation
heights at the selected sites show slight variation between the CC and the 2020–2040 period but significantly
increase by 2080–2100. The alarmingly high inundation heights, albeit with uncertainty, warrant immediate
attention and adaptation planning by various neighborhoods in the coastal communities.
Sensitivity of future 1% coastal inundation to SLR. The FSUGSM-RCP8.5 scenarios with 0, 1, 2 m of
SLR were used to examine the effect of SLR on the 1% inundation maps. SLR was found to play a dominant role
at the inland boundary. Near the coast, storm surge accounts for 70–80% of the total inundation (1 m SLR) or
30–70% (2 m SLR). Therefore, TCs cannot be ignored in developing future coastal flood maps. The effect of SLR
on inundation was found to vary significantly over the floodplain due to the non-linear interaction between the
storm surge, wave, tide, and SLR. A change in water depth due to SLR can induce non-linear changes in the storm
surge, tide, and waves and non-linear changes in the flood propagation as friction is reduced. For example, near
the shoreline of Rookery Bay (south of Naples) and Charlotte Harbor (north of Estero), inundation is increased
by 1.6 m due to a 1 m SLR. This shows that SLR-induced coastal inundation can be amplified or reduced by the
surge-SLR interaction depending on location. Hence coastal flood map produced using a “bathtub” m odel58,59,
which adds the SLR value uniformly throughout the floodplain or onto a CC flood map, is highly inaccurate.
Effect of precipitation. For CC, with the 1% precipitation at Naples of 16 inches over three days, TIV and
TIA increased by 13% and 12%, while AIH and MIH increased by 1 cm and 5 cm, respectively. For 2080–2100,
the 0.2% rainfall data were utilized to reflect the increase in precipitation in future climates. With the 0.2% pre-
cipitation of 22 inches in 3 days at Naples, the 1% inundation map for RCP8.5-FSUGSM with 2 m SLR showed
that the TIV and TIA increased by 3%, while AIH and MIH increased by 2 cm and 5 cm, respectively. Fig-
ure 5 shows the differences of 1% inundation maps with and without precipitation for the two scenarios. While
Scientific Reports | (2022) 12:3403 | https://doi.org/10.1038/s41598-022-07010-z 8
Vol:.(1234567890)www.nature.com/scientificreports/
Figure 4. The water level at Naples tide gauge (top row), and inundation height at Naples City Hall (second
row), March Island (third row), and Estero (bottom row) during current climate (left column), Early twenty-
first Century (middle column), and late twenty-first century (right column). Predictions by CAM5.1, HiRAM-
GFDL, and FSUGSM-WRF for the current climate are presented. Future inundation heights are based on
FSUGSM-WRF results.
changes in AIH and MIH due to precipitation are within a few centimeters, precipitation could increase the local
flooding by about 30 cm under CC and future.
Effect of changing land use features. The effect of (climate-induced) changing land use features on
future flooding was addressed by assuming the mangroves will replace all marshes in the floodplain by 2100. The
resulting future flood maps were found to show negligible differences, likely due to the use of the 2D surge-wave
model, which represents the vegetation with an empirical bottom friction coefficient. Therefore, future study
should use a three-dimensional vegetation-resolving surge-wave model, e.g., CH3D-SWAN13–15, coupled to a
watershed model, with extensive vegetation data (type, distribution, height, stem density, leaf area index, stem
size, rigidity, inland migration, etc.) to produce more accurate flood maps and to quantify the value of coastal
wetlands in reducing coastal flooding damage in the r egion8,60 to enhance coastal resiliency and wetland restora-
tion.
Scientific Reports | (2022) 12:3403 | https://doi.org/10.1038/s41598-022-07010-z 9
Vol.:(0123456789)www.nature.com/scientificreports/
Figure 5. Differences between the 1% inundation with and without precipitation for (left) current climate,
(right) RCP8.5-FSUGSM with 2 m SLR. Figure was generated using Tecplot 360 2018 R1 (www.tecplot.com).
Comparison of Coastal Inundation Metrics obtained by different statistical methods. As
shown in Yang et al.53, the 1% coastal inundation metrics (AIH, MIH, TIA, TIV), in units of ([m], [m], [ 109m2],
[109m3]), respectively, for SW FL in current climate are (1.06, 2.41, 2.65, 2.82) according to the JPM-OS. Those
produced using the MCLC, driven by the TC associated with the 1% Naples water level at 50 percentile confi-
dence level, are (0.27, 2.14, 3.11, 0.73), while those driven by the TC associated with the 1% TIV for the model
domain are (0.27, 2.13, 2.83, 0.91). Therefore, the MCLC resulted in much lower AIH and TIV but slightly lower
MIH and slightly higher TIA. Inundation metrics obtained by imposing the 1% Naples water level along the
open boundary of the coastal model, as in a bathtub model, are less than 50% of those produced by the JPM-OS
using TC ensemble for the current climate.
Discussion
The compound effects of TCs and SLR on coastal flood hazard in a large coastal flood plain in SWFL in the
late twentieth (1980–2000), early-twenty-first (2020–2040), and late-twenty-first (2080–2100) century, under
RCP4.5 and RCP8.5 greenhouse gas concentration scenarios, were simulated by a coupled surge-wave model
for all possible TCs with probabilistic SLR values. The 1% coastal inundation in SWFL is sensitive to the TCs,
SLR, RCP scenarios, AMO phases, precipitation, and climate and downscaling models. We further discuss the
sensitivity of coastal inundation in SWFL to TCs, SLR, precipitation, and how SLR and TCs are combined in
the coastal model simulations.
As shown in Table 2, 1% coastal inundation in SWFL increases significantly from the current climate to 2100.
The increase rates for all inundation metrics predicted by four different models show a similar temporal trend.
CAM5.1 is a global climate model with a high resolution of 25 km. HiRAM-GFDL is based on the global HiRAM
model but downscaled by the regional GFDL hurricane model. GFDL6-ESM4-KE is based on the global model
GFDL6-ESM4 with downscaling by the KE model. Finally, FSUGSM-WRF is based on the global atmospheric
model FSUGSM forced with SST and surface fluxes of the C anESM261 global atmosphere–ocean climate model
and downscaled by the regional climate model (RCM) WRF with a 12-km grid. TCs (of 75th percentile and
higher) predicted by GFDL6-ESM4-KE and FSUGSM-WRF show a significant increase in central pressure
deficit and Rmax by 2100 and resulted in similar results 1% coastal inundation for the current climate and 2100.
The relative importance of TC characteristics in affecting coastal flooding can be readily analyzed for a single
TC. It is known that increased intensity would increase the damage during most historical TC such as Katrina
and Sandy. Hurricane Katrina, a Cat-3 hurricane at landfall, caused catastrophic damage due to its huge size,
slow speed, and a particular track which caused the collapse of the New Orleans Flood Protection System. Hur-
ricane Charley, a Cat-5 TC, caused minor damage in Florida due to its fast speed and small size. Hurricane Sandy
caused a dramatic loss in New York and New Jersey because of its sheer size, slow speed, and a particular track
plus coincidence of landfall with high tide.
On the other hand, the 1% flood is the cumulative result of 20,625 total potential TCs which depend on the
climate and downscaling models. For example, 1% flood due to the FSUGSM-WRF TCs is found to increase
dramatically from CC to 2100 due to a 60–75% increase in the 75th percentile pressure deficit, despite a 20%
increase in Rmax and 40% increase in forward speed. On the other hand, the GFDL6-KE TCs resulted in a sig-
nificant increase in coastal inundation due to a 20% increase in 75th percentile pressure deficit and Rmax but a
10% reduction in forward speed. Moreover, the relative importance of TC characteristics in affecting the increase
in future coastal flooding is highly dependent on the location because the 1% flood does not result from a single
TC. Therefore, a comprehensive analysis of the relative importance of TC characteristics on probabilistic floods
requires a detailed analysis of future coastal floods during all of the optimal TCs.
Scientific Reports | (2022) 12:3403 | https://doi.org/10.1038/s41598-022-07010-z 10
Vol:.(1234567890)www.nature.com/scientificreports/
Although we did not compare the TCs and coastal inundation based on all CMIP5 and CMIP6 climate
models and downscaling models, this study suggests that downscaling with KE model (e.g., GFDL-ESM4-KE)
and high-resolution RCM (e.g., FSUGSM-WRF) can improve the prediction of TCs by global climate models.
NASHM38 predicted TCs were successfully used to calculate the 1% flood in New Jersey and New York8. Both
KE and NASHM can generate hundreds or more TCs for SWFL to enable more robust results. Higher-resolution
climate models with a 4–8 km resolution can be available soon to provide a more accurate simulation of future
TCs. Further reduction of the uncertainties of probabilistic coastal inundation prediction over a large coastal
flood plain can be achieved by a comprehensive study on the sensitivity of TCs and coastal inundation to more
global climate models with different complexity (e.g., cloud physics) and resolution, without and with downscal-
ing by a variety of models (e.g., KE, NASHM, GCM) of varying physics and resolution.
Tropical cyclones and sea-level rise can significantly change the sandy beaches and coastal wetlands (marshes
and mangroves) along the southwest Florida coast. A single intense tropical cyclone could result in dramatic
beach erosion and change of shoreface m orphology62. In addition, tidal wetlands are highly vulnerable to end-
of-century submergence, resulting in extensive losses of habitats63. Mangroves in SW FL sustained significant
damage due to storm surge and ponding during Hurricane Irma64. While a process-based mangrove migration
model is being developed, we greatly simplified the analysis by assuming the mangroves will completely replace
all marshes in the floodplain by 2100. The resulting future flood maps were found to show negligible differences,
likely due to the use of the 2D surge-wave model, which represents the vegetation with an empirical bottom
friction coefficient. An ongoing study is using the three-dimensional vegetation-resolving surge-wave model,
CH3D-SWAN13,55,60, coupled to a watershed model, a stormwater model, and a mangrove migration model, with
extensive vegetation data (type, distribution, height, stem density, leaf area index, stem size, rigidity, and inland
migration, etc.) to produce more accurate flood maps for the twenty-first century and to quantify the ecosystem
service value of coastal wetlands in reducing coastal flooding damage in the region to enhance coastal resiliency
and wetland restoration. To further improve the accuracy of flood simulation, the horizontal resolution of the
coastal model could be refined to 5–10 m throughout the model d omain60.
Due to the overwhelming impact of TCs and SLR in the study region, we focused on the compound flooding
due to TCs and SLR while simplifying the effect of precipitation and hydrologic flow by using NOAA precipitation
data. As a result, our predicted coastal flood hazard for the region should be more robust than that produced by a
hydrologic model65 forced by the coastal water level (at sparsely located tide stations) representing the combined
effect of TCs and SLR66. Forcing the hydrologic model with a specified coastal water level is similar to the bathtub
approach which gives 50% lower coastal inundation results over the floodplain.
Summary
The compound effects of TCs and SLR on coastal flood hazard in a large coastal flood plain in southwest Florida
in the late twentieth (1980–2000), early-twenty-first (2020–2040), and late-twenty-first (2080–2100) century,
under RCP4.5 and RCP8.5 greenhouse gas concentration scenarios, were simulated by a coupled surge-wave
model for all possible TCs with probabilistic SLR values. Spatially and temporally varying coastal inundation
over the coastal flood plain is sensitive to the TCs, SLR, RCP scenarios, AMO phases, precipitation, and climate
and downscaling models.
For the current climate, inundation metrics obtained using TCs from GFDL6-KE and FSUGSM-WRF agree
well with each other and those obtained with the historical TCs. Both HiRAM-GFDL and CAM5.1 produced
slightly higher coastal inundation for the current climate, perhaps due to the coarse resolution. By 2100, proba-
bilistic coastal inundation hazard in SW Florida as measured by AIH, MIH, TIA, and TIV predicted by the four
models show a similar and consistent temporal trend. In the twenty-first century, (AIH, MIH, TIA, TIV) could
increase by (68–88, 75–120, 44–84, 114–228) percent respectively from the late twenty-first century values. Posi-
tive AMO results in (94, 125, 107, and 246) percent potential increases, RCP8.5 could increase the metrics by
(1.34, 2, 1.24, 3.67) times, respectively, and 2 m SLR would lead to increases of (1.94, 2.38, 1.58, 5.68) times. By
2100, (AIH, MIH, TIA, TIV) could become (2.94, 3.38, 2.58, 6.68) times of their respective values in the current
climate, with the unlikely high 2 m SLR. These findings can inform the coastal community of potential future
coastal inundation hazards, which is essential for adaptation and resilience planning.
To reduce the uncertainties in coastal inundation associated with the TC prediction by climate models, further
research is needed to compare the TCs predicted by high resolution (less than 25 km) global climate models
without downscaling and with downscaling by different downscaling models for current and future climates.
This will allow the separation of uncertainties of climate models and downscaling models. Higher-resolution
climate models and downscaling models which generate more TCs in the coastal region within a 20-year scenario
should be preferred. SLR values from the latest IPCC Assessment R eport57 should be used. Three-dimensional
vegetation-resolving coastal surge-wave models with evolving land use features (mangroves, marshes, and build-
ings) should be used to improve the accuracy of the coastal inundation simulation. TC-induced flood damage
to local infrastructures should be estimated for current and future climate scenarios to develop flood mitigation
strategies.
Last but not least, the new paradigm for developing future probabilistic coastal inundation hazard maps,
which is more appropriate for the twenty-first century than the existing p aradigm27, can be applied to other
coastal regions throughout the world. This paradigm is currently being enhanced by using a vegetation-resolving
three-dimensional surge-wave model coupled to a mangrove model, a stormwater model, and a watershed model.
Results of this study are informing coastal adaptation planning by local communities.
Scientific Reports | (2022) 12:3403 | https://doi.org/10.1038/s41598-022-07010-z 11
Vol.:(0123456789)www.nature.com/scientificreports/
Received: 29 October 2021; Accepted: 10 February 2022
References
1. Kopp, R. E. et al. Probabilistic 21st and 22nd century sea-level projections at a global network of tide-gauge sites. Earth’s Future
2(8), 383–406. https://doi.org/10.1002/2014EF000239 (2014).
2. Sweet, W. V., et al. Global and regional seal level rise scenarios for the United States. NOAA Technical Report NOA CO-OPS 083.
NOAA/NOS Center for Operational Oceanographic Products and Services. https://doi.org/10.7289/v5/tr-nos-coops-083 (2017).
3. Horton, B. P. et al. Mapping sea-level change in time, space, and probability. Annu. Rev. Environ. Resour. 43, 481–521. https://doi.
org/10.1146/annurevenviron-102017-025826 (2018).
4. Knutson, T. et al. Tropical cyclones and climate change. Nat. Geosci. 3, 157–163. https://doi.org/10.1038/ngeo779 (2010).
5. Villarini, G. & Vecchi, G. A. Projected increases in North Atlantic tropical cyclone intensity from CMIP5 models. J. Clim. 26,
3231–3240. https://doi.org/10.1175/JCLI-D-12-00441.1 (2013).
6. Knutson, T. et al. Tropical cyclones and climate change assessment: part II: projected response to anthropogenic warming. Bull.
Am. Meteorol. Soc. 101(3), E303–E322. https://doi.org/10.1175/BAMS-D-18-0194.1 (2020).
7. Emanuel, K. Response of global tropical cyclone activity to increasing C O2: results from downscaling CMIP6 models. J. Clim. 34,
57–70. https://doi.org/10.1175/jcli-d-20-0367.1 (2021).
8. Sheng, Y. P., Rivera-Nieves, A., Zou, R. & Paramygin, A. Role of wetlands in reducing structural loss is highly dependent on char-
acteristics of storms and local wetland and structure conditions. Sci. Rep. 11, 5237. https://doi.org/10.1038/s41598-021-84701-z
(2021).
9. United Nations. Ocean Fact Sheet. https://www.un.org/sustainabledevelopment/wp-content/uploads/2017/05/Ocean-fact-sheet-
package.pdf (2017).
10. NOAA Office for Coastal Management. Coastal Florida. https://coast.noaa.gov/states/florida.html (2019).
11. NOAA Office for Coastal Management. Fast Facts on Hurricane Costs. https://coast.noaa.gov/states/fast-facts/hurricane-costs.
html (2021).
12. U.S. Congressional Budget Office. Expected Costs of Damage from Hurricane Winds and Storm-Related Flooding. https://www.cbo.
gov/publication/55019 (2019).
13. Sheng, Y. P. & Zou, R. Assessing the role of mangrove forest in reducing coastal inundation during major hurricanes. Hydrobiologia
803(1), 87–103. https://doi.org/10.1007/s10750-017-3201-8 (2017).
14. Sheng, YP et al. A regional testbed for storm surge and coastal inundation models: an overview. in Proceedings of the 12th Inter-
national Conference on Estuarine and Coastal Modeling, American Society of Civil Engineers (2011). https://doi.org/10.1061/97807
84412411.00028
15. Davis, J. R., Paramygin, V., Forrest, D. & Sheng, Y. P. Toward the probabilistic simulation of storm surge and inundation in a
limited-resource environment. Mon. Weather Rev. 138(7), 2953–2974. https://doi.org/10.1175/2010MWR3136.1 (2010).
16. Condon, A. J., Sheng, Y. P. & Paramygin, V. A. Towards high-resolution, rapid, probabilistic forecasting of coastal inundation threat
from landfalling hurricanes. Mon. Weather Rev. 141, 1304–1323. https://doi.org/10.1175/MWR-D-12-00149.1 (2013).
17. Sheng, Y. P., Zhang, Y. & Paramygin, V. A. Simulation of storm surge, wave, and coastal inundation in the Northeastern Gulf of
Mexico region during Hurricane Ivan in 2004. Ocean Model 35, 314–331. https://doi.org/10.1016/j.ocemod.2010.09.004 (2010).
18. Sheng, Y. P., Paramygin, V. A., Alymov, V., Davis, J. R. A real-time forecasting system for hurricane induced storm surge and coastal
flooding. in Proceedings of the 9th International Conference on Estuarine and Coastal Modeling 585–602 (American Society of Civil
Engineers, 2005). https://doi.org/10.1061/40876(209)34.
19. Yang, K., Paramygin, V. A. & Sheng, Y. P. A rapid forecasting and mapping system of storm surge and coastal flooding. Weather
Forecast. https://doi.org/10.1175/WAF-D-19-0150.1 (2020).
20. NOAA Hurricane Research Division Atlantic Hurricane Database Re-analysis project. https://www.aoml.noaa.gov/hrd/data_sub/
re_anal.html.
21. Condon, A. J. & Sheng, Y. P. Optimal storm generation for evaluation of the storm surge inundation threat. Ocean Eng. 43, 13–22.
https://doi.org/10.1016/j.oceaneng.2012.01.021 (2012).
22. Condon, A. J. & Sheng, Y. P. Evaluation of coastal inundation hazard for present and future climates. Nat. Hazards 62(2), 345–373.
https://doi.org/10.1007/s11069-011-9996-0 (2012).
23. Marsooli, R. & Lin, N. Impacts of climate change on hurricane flood hazards in Jamaica Bay, New York. Clim. Change 163,
2153–2171. https://doi.org/10.1007/s10584-020-02932-x (2020).
24. Irish, J., Sleath, A., Cialone, M., Knutson, T. & Jensen, R. Simulations of Hurricane Katrina (2005) under sea level and climate
conditions for 1900. Clim. Change 122(4), 635–649. https://doi.org/10.1007/s10584-013-1011-1 (2014).
25. Kossin, J. P., Knapp, K. R., Olander, T. L. & Velden, C. S. Global increase in major tropical cyclone exceedance probability over the
past four decades. PNAS 117(22), 11975–11980. https://doi.org/10.1073/pnas.1920849117 (2020).
26. Roberts, M. J. et al. Projected future changes in tropical cyclones using the CMIP6 HighResMIP multimodel ensemble. Geophys.
Res. Lett. https://doi.org/10.1029/2020GL088662 (2020).
27. National Research Council. Mapping the zone: improving flood map accuracy (The National Academies Press, 2009). https://doi.
org/10.17226/12573.
28. Chen, J. & Lin, S. Seasonal predictions of tropical cyclones using a 25-km-resolution general circulation model. J. Clim. 26(2),
380–398. https://doi.org/10.1175/JCLI-D-12-00061.1 (2013).
29. Patricola, C. M. & Wehner, M. Anthropogenic influences on major tropical cyclone events. Nature 563, 339–346. https://doi.org/
10.1038/s41586-018-0673-2 (2018).
30. Meehl, G. A. et al. Effects of model resolution, physics, and coupling on Southern Hemisphere storm tracks in CESM1.3 Geo. Res.
Lett. 46, 12408–12416. https://doi.org/10.1029/2019GL084057 (2019).
31. Nicholls, Z. et al. Regionally aggregated, stitched and de-drifted CMIP-climate data, processed with netCDF-SCM v.2.0.0. Geo.
Data J. https://doi.org/10.1002/gdj3.113 (2020).
32. Wehner, M. F. et al. The effect of horizontal resolution on simulation quality in the Community Atmospheric Model, CAM5.1. J.
Adv. Earth Syst. 6(4), 980–997. https://doi.org/10.1002/2013MS000276 (2014).
33. Bacmeister, J. T. et al. Projected changes in tropical cyclone activity under future warming scenarios using a high-resolution climate
model. Clim. Change 146, 547–560. https://doi.org/10.1007/s10584-016-1750-x (2018).
34. Zhao, M., Held, I. M., Lin, S. J. & Vecchi, G. A. Simulations of global hurricane climatology, interannual variability, and response
to global warming using a 50-km resolution GCM. J. Clim. 22, 6653–6678. https://doi.org/10.1175/2009JCLI3049.1 (2009).
35. Taylor, K., Stouffer, R. & Meehl, G. An overview of CMIP5 and the experiment design. Bull. Am. Meteorol. Soc. 93, 485–498. https://
doi.org/10.1175/BAMS-D-11-00094.1 (2012).
36. Eyring, V. et al. Overview of the Coupled Model Intercomparison Project Phase 6 (CMIP6) experimental design and organization.
Geosci. Model Dev. 9, 1937–1958. https://doi.org/10.5194/gmd-9-1937-(2016) (2016).
37. Larow, T. E., Stefanova, L. & Seitz, C. Dynamical simulations of North Atlantic tropical cyclone activity using observed low
frequency SST oscillation imposed on CMIP5 Model RCP4.5 SST projections. J. Clim. 27, 8055–8069. https://doi.org/10.1175/
JCLI-D-13-00607.1 (2014).
Scientific Reports | (2022) 12:3403 | https://doi.org/10.1038/s41598-022-07010-z 12
Vol:.(1234567890)www.nature.com/scientificreports/
38. Hall, T. M. et al. US tropical cyclone activity in the 2030s based on projected changes in tropical sea surface temperature. J. Clim.
34, 1321–1335. https://doi.org/10.1175/JCLI-D-20-0342.1 (2021).
39. Knutson, T., Sirutis, J., Garner, S., Vecchi, G. A. & Held, I. M. Simulated reduction in Atlantic hurricane frequency under twenty-
first-century warming conditions. Nat. Geosci. 1, 359–364. https://doi.org/10.1038/ngeo202 (2008).
40. Liu, B., Costa, K. B., Xie, L. & Semazzi, F. H. M. Dynamical downscaling of climate change impacts on wind energy resources in
the contiguous United States by using a limited-area model with scale-selective data assimilation. Adv. Meteorol. https://doi.org/
10.1155/2014/897246 (2014).
41. Emanuel, K. Downscaling CMIP5 climate models shows increased tropical cyclone activity over the 21st century. Proc. Natl. Acad.
Sci. USA 110, 12219–12224. https://doi.org/10.1073/pnas.1301293110 (2013).
42. NOAA Hurricane Research Division Atlantic Hurricane Database Re-analysis project. https://www.aoml.noaa.gov/hrd/data_sub/
re_anal.html (2019).
43. Sheng, Y. P. On modeling three-dimensional estuarine and marine hydrodynamics. Three-dimensional models of marine and
estuarine dynamics. Elsevier Oceanogr. Ser. 45, 35–54. https://doi.org/10.1016/S0422-9894(08)70441-0 (1987).
44. Sheng, Y. P. Evolution of a three-dimensional curvilinear-grid hydrodynamic model for estuaries, lakes, and coastal waters. in
Proceedings of 1st International Conference on Estuarine and Coastal Modeling I, ASCE 40–49 (1990).
45. Luettich, R., Westerink, J. J., Scheffner, N. W. ADCIRC: an advanced three-dimensional circulation model for shelves coasts and
estuaries, report 1: theory and methodology of ADCIRC-2DDI and ADCIRC-3DL. Dredging Research Program Technical Report
DRP-92-6, US Army Engineers Waterways Experiment Station 137 (1992).
46. Peng, M., Xie, L. & Pietrafesa, L. A numerical study of storm surge and inundation in the Croatan-Albemarle-Pamlico estuary
system. Estuar. Coast. Shelf Sci. 59, 121–137. https://doi.org/10.1029/2004JC002755 (2004).
47. Weisberg, R. H. & Zheng, L. Y. Circulation of Tampa Bay driven by buoyancy, tides, and winds, as simulated using a finite volume
coastal ocean model. J. Geophys. Res. 111, C01005. https://doi.org/10.1029/2005JC003067 (2006).
48. Sheng, Y. P., Alymov, V. & Paramygin, V. A. Simulation of storm surge, wave, currents, and inundation in the outer banks and
chesapeake bay during hurricane Isabel in 2003: the importance of waves. J. Geophys. Res. Oceans 115(C04008), 1–27. https://doi.
org/10.1029/2009JC005402 (2010).
49. Booij, N., Ris, R. C. & Holthuijsen, L. H. A third-generation wave model for coastal regions: model description and validation. J.
Geophys. Res. 104(C4), 7649–7666. https://doi.org/10.1029/98JC02622 (1999).
50. Holland, G. J. An analytic model of the wind and pressure profiles in hurricanes. Mon. Weather Rev. 108, 1212–1218. https://doi.
org/10.1175/1520-0493(1980)108%3c1212:AAMOTW%3e2.0.CO;2 (1980).
51. Toro, G. R., Niedoroda, A. W., Reed, C. W. & Divoky, D. Quadrature-based approach for the efficient evaluation of surge hazard.
Ocean Eng. 37(1), 114–124. https://doi.org/10.1016/j.oceaneng.2009.09.005 (2010).
52. Resio, D. T. White paper on estimating hurricane inundation probabilities, 126 (US Army Corps Engineers Engineer Research
and Development Center, 2007).
53. Yang, K., Paramygin, V. & Sheng, Y. P. An objective and efficient method for estimating probabilistic coastal inundation hazards.
Nat. Hazards 99, 1105–1130. https://doi.org/10.1007/s11069-019-03807-w (2019).
54. Nadal-Caraballo, N. C., Melby, J. A. & Gonzalez, V. M. Statistical analysis of historical extreme water levels for the U.S. North
Atlantic coast using Monte Carlo life-cycle simulation. J. Coast Res. 32(1), 35–45. https://doi.org/10.2112/JCOASTRES-D-15-
00031.1 (2015).
55. Sheng, Y. P., Lapetina, A. & Ma, G. The reduction of storm surge by vegetation canopies: Three-dimensional simulations. Geo Res.
Lett. 39, 1–5. https://doi.org/10.1029/2012GL053577 (2012).
56. Tebaldi, C., Strauss, B. H. & Zervas, C. E. Modelling Sea level rise impacts on storm surges along US coasts. Environ. Res. Lett. 7,
014032. https://doi.org/10.1088/1748-9326/7/1/014032 (2012).
57. IPCC. Climate Change 2021: The Physical Science Basis. Contribution of Working Group I to the Sixth Assessment Report of the
Intergovernmental Panel on Climate Change (eds. Masson-Delmotte, V. P. et al.) (Cambridge University Press, 2021).
58. Didier, D. et al. Multi-hazard simulation for coastal flood mapping: bathtub versus numerical modeling in an open estuary, Eastern
Canada. J. Flood Risk Manag. 12, e12505. https://doi.org/10.1111/jfr3.1250 (2018).
59. Kulp, S. & Strauss, B. H. Rapid escalation of coastal flood exposure in US municipalities from sea level rise. Clim. Change 142(3–4),
477–489. https://doi.org/10.1007/210584-017-1963-7 (2017).
60. Sheng, Y. P. et al. Invasive phragmites provides superior wave and surge damage protection relative to native plants during storms.
Environ. Res. Lett. 16, 5. https://doi.org/10.1088/1748-9326/abf288 (2021).
61. Yang, D., & Saenko, O. A. Ocean heat transport and its projected change in CanESM2. J. Clim. 25, 8148–8163. https://doi.org/10.
1175/JCLI-D-11-00715.1 (2012).
62. Fruergaard, M., Andersen, T. J., Johannessen, P. N., Nielsen, L. H. & Pejrup, M. Major coastal impact induced by a 1000-year storm
event. Sci. Rep. 3(1), 1–7. https://doi.org/10.1038/srep01051 (2013).
63. Thorne, K. et al. U.S. Pacific coastal wetland resilience and vulnerability to sea-level rise. Sci. Adv. 4, 2. https://doi.org/10.1126/
sciadv.aao3270 (2018).
64. Lagomasino, D. et al. Storm surge and ponding explain mangrove dieback in southwest Florida following Hurricane Irma. Nat.
Commun. 12, 4003. https://doi.org/10.1038/s41467-021-24253-y (2021).
65. Bates, P. D. et al. Combined modeling of US fluvial, pluvial, and coastal flood hazard under current and future climates. Water
Resour. Res. https://doi.org/10.1029/2020WR028673 (2020).
66. Marsooli, R. et al. Climate change exacerbates hurricane flood hazards along US Atlantic and Gulf Coasts in spatially varying
patterns. Nat. Commun. 10, 3785. https://doi.org/10.1038/s41467-019-11755-z (2019).
Acknowledgements
This paper is a result of research funded by the National Oceanic and Atmospheric Administration’s RESTORE
Science Program under award NA17NOS4510094, ESLR Program under award NA19NOS4780178, and Climate
Program under award NA11OAR43100105 to the University of Florida. We thank several climate modelers
for providing the TC data predicted by climate models: Michael Wehner (CAM5.1), Iama Liang (HiRAM-
SITHR), Dan Fu (CESM), Tom Knutson (HiRAM-GFDL), Tim Hall (NASHM), Kerry Emanuel (GFDL-KE and
HADGEM-KE), and Tim LaRow and Lian Xie (FSUGSM-WRF). Tropical cyclone data used in this paper may
be obtained from the respective climate modelers upon reasonable request. Results of the coastal inundation
simulations may be available from the authors upon reasonable request. Two anonymous reviewers provided
valuable inputs.
Author contributions
Y.P.S. led the scientific team, oversaw the entire study including scientific approach and design of numerical simu-
lations, and wrote the main manuscript text. V.A.P. conducted the numerical simulations of coastal inundation
and analyzed the tropical cyclones received from climate modelers. K.Y. led the development and application
Scientific Reports | (2022) 12:3403 | https://doi.org/10.1038/s41598-022-07010-z 13
Vol.:(0123456789)You can also read


