First triple-wavelength lidar observations of depolarization and extinction-to-backscatter ratios of Saharan dust
←
→
Page content transcription
If your browser does not render page correctly, please read the page content below
Research article
Atmos. Chem. Phys., 22, 355–369, 2022
https://doi.org/10.5194/acp-22-355-2022
© Author(s) 2022. This work is distributed under
the Creative Commons Attribution 4.0 License.

                    First triple-wavelength lidar observations
                 of depolarization and extinction-to-backscatter
                                ratios of Saharan dust
               Moritz Haarig1 , Albert Ansmann1 , Ronny Engelmann1 , Holger Baars1 , Carlos Toledano2 ,
                    Benjamin Torres3 , Dietrich Althausen1 , Martin Radenz1 , and Ulla Wandinger1
                                1 LeibnizInstitute for Tropospheric Research, Leipzig, Germany
                            2 Atmospheric  Optics Group, University of Valladolid, Valladolid, Spain
                   3 Laboratoire d’Optique Atmosphérique, Université des Sciences et Technologies de Lille,

                                                    Villeneuve d’Ascq, France
                                    Correspondence: Moritz Haarig (haarig@tropos.de)

                                      Received: 16 July 2021 – Discussion started: 30 July 2021
                        Revised: 25 October 2021 – Accepted: 16 November 2021 – Published: 11 January 2022

       Abstract. Two layers of Saharan dust observed over Leipzig, Germany, in February and March 2021 were used
       to provide the first-ever lidar measurements of the dust lidar ratio (extinction-to-backscatter ratio) and linear
       depolarization ratio at all three classical lidar wavelengths (355, 532 and 1064 nm). The pure-dust conditions
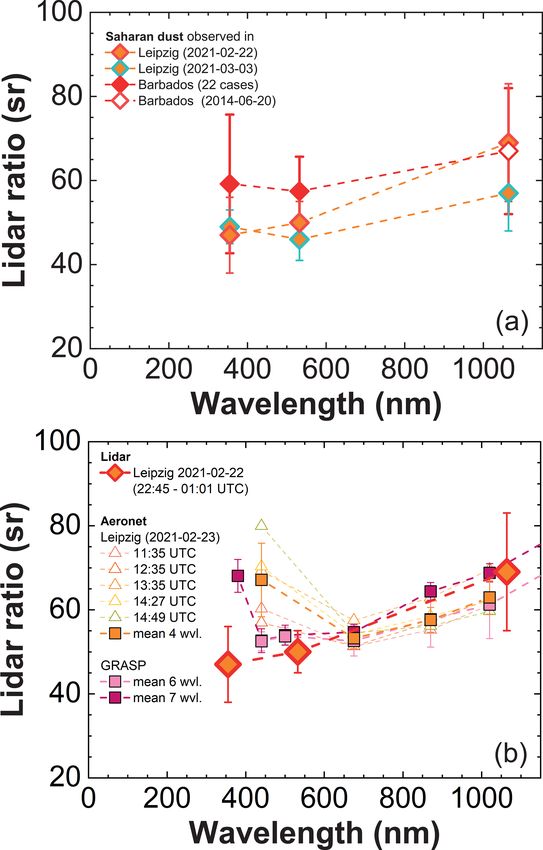
       during the first event exhibit lidar ratios of 47 ± 8, 50 ± 5 and 69 ± 14 sr and particle linear depolarization ra-
       tios of 0.242 ± 0.024, 0.299 ± 0.018 and 0.206 ± 0.010 at wavelengths of 355, 532 and 1064 nm, respectively.
       The second, slightly polluted-dust case shows a similar spectral behavior of the lidar and depolarization ra-
       tio with values of the lidar ratio of 49 ± 4, 46 ± 5 and 57 ± 9 sr and the depolarization ratio of 0.174 ± 0.041,
       0.298 ± 0.016 and 0.242 ± 0.007 at 355, 532 and 1064 nm, respectively. The results were compared with Aerosol
       Robotic Network (AERONET) version 3 (v3) inversion solutions and the Generalized Retrieval of Aerosol and
       Surface Properties (GRASP) at six and seven wavelengths. Both retrieval schemes make use of a spheroid shape
       model for mineral dust. The spectral slope of the lidar ratio from 532 to 1064 nm could be well reproduced by
       the AERONET and GRASP retrieval schemes. Higher lidar ratios in the UV were retrieved by AERONET and
       GRASP. The enhancement was probably caused by the influence of fine-mode pollution particles in the boundary
       layer which are included in the columnar photometer measurements. Significant differences between the mea-
       sured and retrieved wavelength dependence of the particle linear depolarization ratio were found. The potential
       sources for these uncertainties are discussed.

1   Introduction                                                   Pathfinder Satellite Observation) monitoring aerosol and
                                                                   clouds around the globe at 532 and 1064 nm (Omar et al.,
Triple-wavelength polarization Raman lidar observations of         2009; Kim et al., 2018). Besides CALIPSO, the CATS space
particle depolarization and extinction-to-backscatter ratios       lidar (Cloud-Aerosol Transport System, Yorks et al., 2016)
are of importance for several reasons. Many lidars (includ-        will benefit from lidar ratio measurements at 1064 nm, as
ing ceilometers) are standard backscatter lidars and need          well as possible future space missions operating a backscat-
trustworthy information about the particle extinction-to-          ter lidar at 1064 nm.
backscatter ratio (lidar ratio) in the retrieval of backscat-         Triple-wavelength lidar measurements are also important
ter and extinction profiles and aerosol optical depth (AOD).       for aerosol typing efforts that make use of spectrally re-
This is of special importance in the case of the space-            solved intensive aerosol parameters such as the linear de-
borne CALIPSO lidar (Cloud-Aerosol Lidar and Infrared              polarization ratio and lidar ratio, as well as the extinction-

Published by Copernicus Publications on behalf of the European Geosciences Union.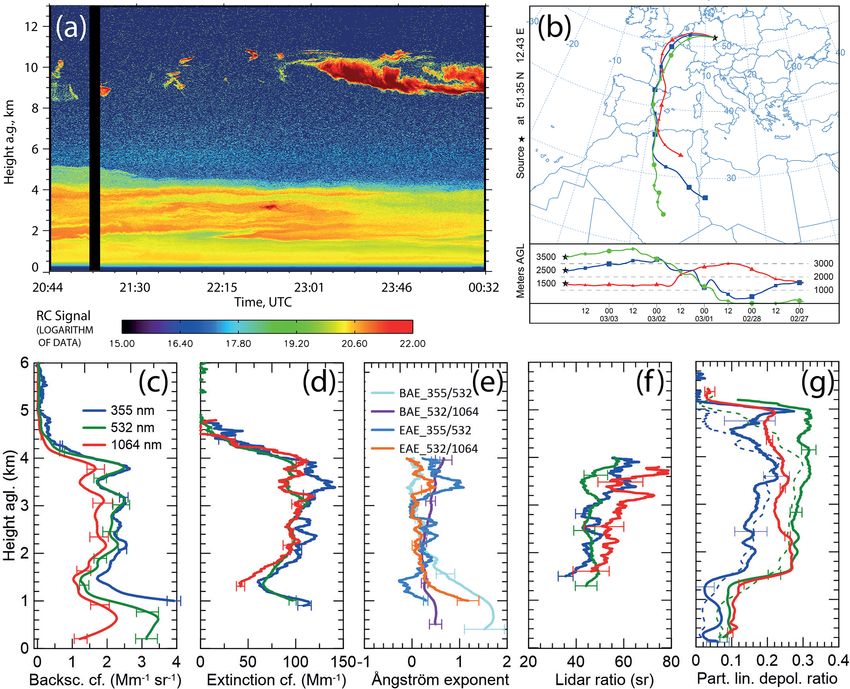
356                                                                                 M. Haarig et al.: Dust lidar ratio at 1064 nm

and backscatter-related Ångström exponents for all climate-         Europe (3–4 d of transport), and the dust plume mixed with
relevant aerosol types like marine aerosol, dust, smoke, vol-       European haze.
canic ash and haze particles (Burton et al., 2012; Groß et al.,        The article is structured as follows. After a short descrip-
2013; Baars et al., 2017). In this respect, our measurements        tion of the lidar system and the additional, new option to
will contribute to these aerosol typing efforts by adding           measure extinction coefficients at 1064 nm in Sect. 2, the two
new information on dust lidar and depolarization ratios at          observed dust cases are presented in Sect. 3. The discussion
1064 nm.                                                            in Sect. 4 focuses on the Ångström exponents and the spec-
   The most important aspect of triple-wavelength lidar ob-         tral dependence of the depolarization ratio and lidar ratio. We
servations of dust depolarization and lidar ratios is, however,     use the opportunity to compare our results with AERONET
that such measurements at all three classical aerosol lidar         version 3 (v3) inversion results as well as with products
wavelengths (355, 532 and 1064 nm) are required to improve          obtained by applying the Generalized Retrieval of Aerosol
optical models applied to simulate the optical properties of        and Surface Properties (GRASP) technique (Dubovik et al.,
aerosol particles as a function of size distribution, shape char-   2014; Torres et al., 2017; Dubovik et al., 2021), available for
acteristics and chemical composition. Especially in the case        the same dust event in February 2021.
of mineral dust there is a strong request for those lidar obser-
vations to improve the applied particle shape parameteriza-
tion. The optical properties of dust strongly depend on par-        2   Instrumentation
ticle shape (depolarization ratio), size and mineralogy (lidar
ratio). These data, presented here, will support the validation     For the present study two lidars and an AERONET sun pho-
of shape models for the irregularly shaped dust particles.          tometer at the Leibniz Institute for Tropospheric Research
   Modeling of dust optical properties is especially chal-          (TROPOS) in Leipzig (51.35◦ N, 12.43◦ E), Germany, were
lenging for the 180◦ backscattering direction. Complex dust         used.
shape models were developed to improve the agreement be-               The multiwavelength polarization Raman lidar BERTHA
tween lidar observations and respective simulation results          (Backscatter Extinction lidar-Ratio Temperature Humidity
(Gasteiger et al., 2011; Kemppinen et al., 2015; Saito and          profiling Apparatus, Haarig et al., 2017) provides the
Yang, 2021). The spheroidal shape model is widely used              backscatter coefficient, extinction coefficient and depolariza-
(Dubovik et al., 2006), e.g., in the analysis of Aerosol            tion ratio at 355, 532 and 1064 nm (3 + 3 + 3 configuration).
Robotic Network (AERONET, Holben et al., 1998) sun and              However, it can not measure the depolarization ratio and the
sky radiometer measurements to obtain the inversion prod-           extinction coefficient at 1064 nm at the same time. A couple
ucts which include the lidar ratio and the particle linear          of minutes are necessary to switch the near-infrared (NIR)
depolarization ratio at four wavelengths between 440 and            setup from depolarization to extinction measurements.
1020 nm. The photometer retrieval products were compared               The radiometric or Rayleigh calibration of the signals
with lidar measurements of desert dust (Tesche et al., 2009;        was done in clear air, which at 1064 nm is a challenging
Müller et al., 2010, 2012; Noh et al., 2017; Shin et al., 2018;     task. At 1064 nm the elastic return signal from molecules is
Toledano et al., 2019), and discrepancies were found.               81 times and 16 times smaller than for 355 and 532 nm, re-
   Triple-wavelength lidar observations of the depolarization       spectively. The reference height for the 1064 nm signal was
ratio have been available since 2013 (Burton et al., 2015;          set some hundreds of meters above the dust layer top height
Haarig et al., 2017). However, direct observations of the li-       for a sufficiently strong molecular signal. On 3 March 2021
dar ratio at all three lidar wavelengths are missing as was         (Sect. 3.2) a thick cirrus cloud was present, which could be
stated in Shin et al. (2018). Haarig et al. (2016) showed,          used to check the Rayleigh calibration. A backscatter color
for the first time, directly measured vertical profiles of the      ratio (1064/532) of 0.88 was observed, which is in line with
1064 nm extinction coefficient. Since then, we have used the        observations by Vaughan et al. (2010), who reported val-
triple-wavelength Raman lidar approach to characterize cir-         ues of 1.01 ± 0.25 in cirrus clouds. On 22 February 2021
rus (Haarig et al., 2016) and wildfire smoke (Haarig et al.,        (Sect. 3.1), the cirrus clouds were too thin to check the cali-
2018) in terms of backscatter, extinction, the lidar ratio and      bration.
the depolarization ratio at 355, 532 and 1064 nm. Now, we              The extinction coefficients at 355 and 532 nm were de-
present two case studies of pure-dust and polluted-dust out-        rived by using the vibrational–rotational Raman signals at
breaks towards central Europe which occurred in February            387 and 607 nm, respectively. The rotational Raman tech-
and March 2021. The first Saharan dust plume extended from          nique (Whiteman, 2003a, b; Veselovskii et al., 2015; Haarig
the ground up to 8 km height and reached our station in             et al., 2016; Ortiz-Amezcua et al., 2020) was applied to pro-
Leipzig, Germany, in less than 2 d (around 36 h) after emis-        vide measurements of the extinction coefficient at 1064 nm.
sion. The fast transport process at great heights prevented         A detailed description of the rotational Raman technique
mixing with anthropogenic pollution. The second dust out-           implemented in BERTHA can be found in Haarig et al.
break occurred 1 week later. The dust spent more time over          (2016). The Raman channel is equipped with an interfer-
                                                                    ence filter centered at 1058 nm (Alluxa, Santa Rosa, CA,

Atmos. Chem. Phys., 22, 355–369, 2022                                                 https://doi.org/10.5194/acp-22-355-2022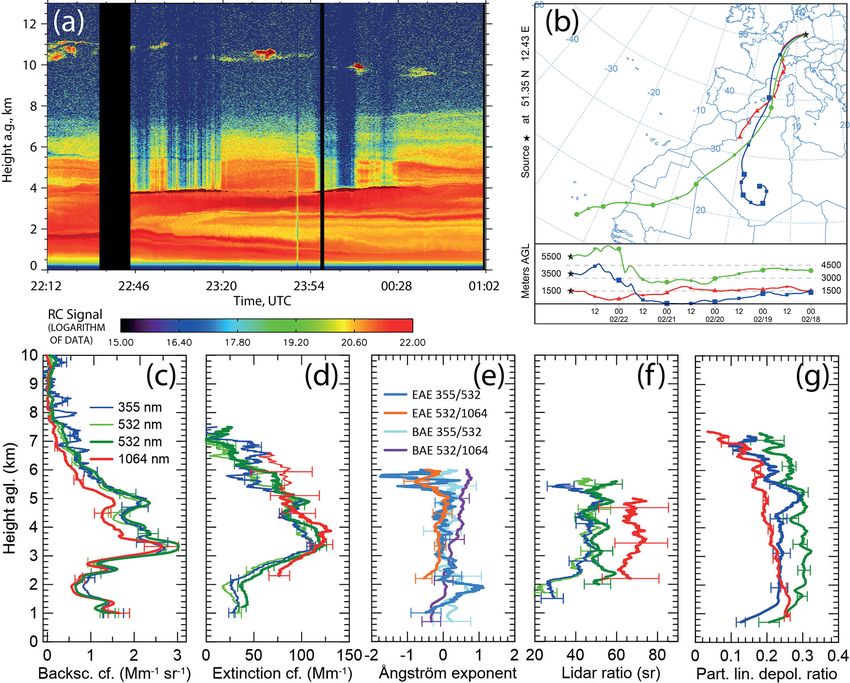
M. Haarig et al.: Dust lidar ratio at 1064 nm                                                                                  357

https://www.alluxa.com, last access: 8 October 2021). The           view polarization technique (Jimenez et al., 2020) is imple-
transmission band is from 1053 to 1062 nm with a trans-             mented to study liquid clouds. PollyXT was operated several
mission > 90 % in this wavelength range. The filter band-           meters apart from the BERTHA instrument.
width of 9 nm restricts the 1058 nm Raman observations to              A Cimel sun–sky photometer of AERONET (Holben et al.,
nighttime hours. For the laser wavelength of 1064.14 nm, the        1998) has been operated at Leipzig since 2000. Currently,
transmission is specified to be 0.005 %. For a better suppres-      only level 1.5 data are available for February and March
sion of the transmitted radiation at 1064 nm two identical          2021, although the data already passed all quality criteria, in-
1058 nm interference filters are used in front of the photo-        cluding cloud screening and operational checks (Giles et al.,
multiplier tube (photon counting, R3236 from Hamamatsu,             2019). Besides the standard AERONET data analysis proce-
Japan). However, some cross talk from the elastic signal at         dure (Dubovik and King, 2000; Dubovik et al., 2006; Sinyuk
1064 nm was still present in the Raman channel. The en-             et al., 2020), the related GRASP retrieval scheme was applied
hanced signal received from the liquid clouds on 22 Febru-          (Dubovik et al., 2014; Torres et al., 2017; Toledano et al.,
ary 2021 (Sect. 3.1) was used to estimate the cross-talk factor     2019; Dubovik et al., 2021). GRASP is based on an approach
of 0.0175 ± 0.0005. For the further analysis, the elastic sig-      similar to the standard AERONET retrieval (Dubovik and
nal at 1064 nm multiplied by the cross-talk factor was sub-         King, 2000) but additionally uses optical information (AOD
tracted from the Raman signal at 1058 nm to correct for the         and radiances) at wavelengths of 380, 500 and 1640 nm.
cross talk. In this simple approach, the cross talk is assumed      From both algorithms the column lidar ratios and depolar-
to be temperature independent. The temperature-dependent            ization ratios at several wavelengths were retrieved.
transmission of the oxygen and nitrogen Raman lines varies
from 0.729 to 0.793 between 288 and 208 K, which was the            3     Observations
maximum and minimum temperature observed in the tropo-
sphere on 22 February 2021. The rotational Raman signal at          Two case studies of the triple-wavelength depolarization ra-
1058 nm was corrected for the temperature dependence after          tio and lidar ratio observations of Saharan dust from late win-
the cross-talk correction. Within the dust layer, the correction    ter 2021 will be shown. Pure-dust conditions were observed
led to around 3 % higher extinction values. Detailed calcu-         on 22–23 February 2021, while mixed pollution–dust condi-
lations of the temperature dependence of rotational Raman           tions prevailed on 3 March 2021.
lidar signals can be found in Veselovskii et al. (2015).
   In BERTHA, linearly polarized laser pulses are transmit-
                                                                    3.1    First dust outbreak: 22–23 February 2021
ted into the atmosphere, and the so-called co-polarized and
cross-polarized signal components are measured. “Co” and            Huge amounts of mineral dust were emitted from western
“cross” denote the planes of polarization parallel and orthog-      Saharan regions around and before 21 February 2021. The
onal to the plane of linear polarization of the transmitted laser   dust plumes were directly transported towards central Europe
pulses, respectively. In the case of spherical droplets and wet     and reached Leipzig in less than 2 d (around 36 h) after emis-
marine and small haze particles, the polarization state of the      sion as shown by the HYSPLIT (Hybrid Single-Particle La-
laser pulse radiation is preserved during the backscattering        grangian Integrated Trajectory, Stein et al., 2015) backward
process, and the particle linear depolarization ratio (PLDR),       trajectories in Fig. 1b. More detailed source attributions indi-
computed from the ratio of the cross-polarized to the co-           cate the Sahara as the main source region for the lofted lay-
polarized signal component, is close to zero. In the case of        ers (see Fig. 2). Below 3 km height, aerosol from continental
irregularly shaped dust particles, depolarization takes place       Europe was probably mixed into the Saharan dust plumes. In
during the backscattering event, and the PLDR values are            the night of 22–23 February 2021, the dust plumes reached
close to 0.3 at 532 nm (Freudenthaler et al., 2009; Haarig          from the ground up to 8 km height. Saharan dust was trans-
et al., 2017). The calibration of the polarization-sensitive        ported towards central Europe continuously from the evening
channels at all three wavelengths makes use of the so-called        of 22 February until the morning of 26 February 2021. The
190◦ method (Freudenthaler, 2016). The error estimation for         whole dust event was studied using the continuous obser-
the BERTHA system is described in Haarig et al. (2017).             vation of the PollyXT lidar (https://polly.tropos.de/calendar/
   The second lidar used in the present study is PollyXT            location/1, last access: 20 October 2021; Baars et al., 2016).
(POrtabLe Lidar sYstem, neXT generation, Engelmann                  The transport pattern was similar to the dust outbreak in Oc-
et al., 2016), which is usually used for ship-borne obser-          tober 2001 described in Ansmann et al. (2003), which was
vations (Engelmann et al., 2021) within OCEANET – At-               measured by the entire EARLINET community (European
mosphere. It is a Raman polarization lidar, measuring the           Aerosol Research Lidar Network, now part of the Aerosol,
backscatter coefficient at 355, 532 and 1064 nm; the extinc-        Clouds and Trace gases Research Infrastructure, ACTRIS,
tion coefficient at 355 and 532 nm (vibrational–rotational Ra-      Pappalardo et al., 2014).
man); and the depolarization ratio at 355 and 532 nm. Addi-            The lidar measurements are presented in Fig. 1. The
tionally, near-range channels at 355, 387, 532 and 607 nm           time–height plot (Fig. 1a) of the cross-polarized and range-
provide information at lower altitudes, and the dual-field-of-      corrected signal at 532 nm provides an overview of the dust

https://doi.org/10.5194/acp-22-355-2022                                               Atmos. Chem. Phys., 22, 355–369, 2022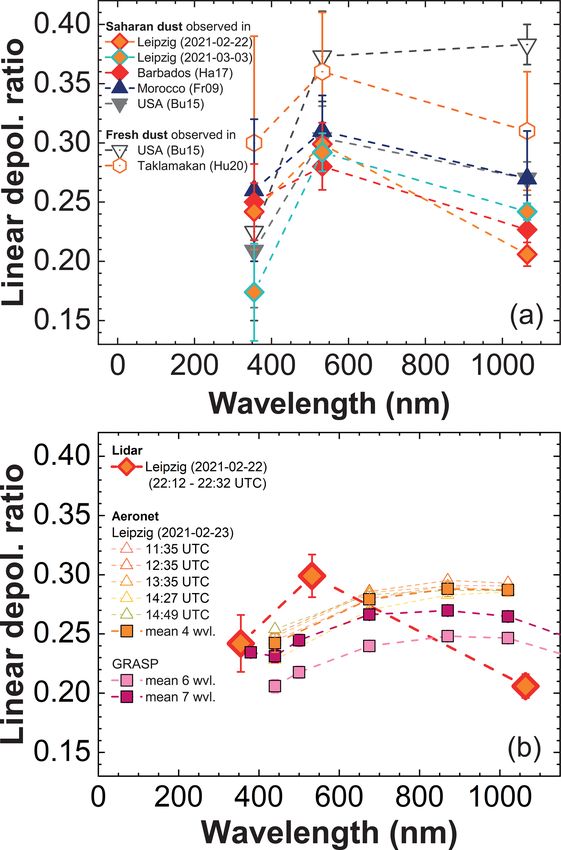
358                                                                                      M. Haarig et al.: Dust lidar ratio at 1064 nm

Figure 1. Saharan dust observations at Leipzig on 22–23 February 2021 at 22:12–01:02 UTC. (a) Time–height display of the 532 nm cross-
polarized, range-corrected (RC) signal. (b) HYSPLIT back trajectory for 23 February 2021 at 00:00 UTC (< 2 d from the Sahara to Leipzig;
please note that the date format in this panel is month/day). (c) Particle backscatter coefficient (200 m vertical smoothing). (d) Particle
extinction coefficient (950 m vertical smoothing, 2000 m (3290 m) at 1064 nm below (above) 5 km). (e) Extinction Ångström exponent
(EAE) and backscatter Ångström exponent (BAE) for the given wavelengths pairs: 355/532 from PollyXT and 532/1064 from BERTHA.
(f) Lidar ratio (950 m vertical smoothing, 2000 m at 1064 nm). (g) Particle linear depolarization ratio (200 m vertical smoothing, 750 m at
355 nm). BERTHA provided measurements at 532 nm (dark green) and 1064 nm (red), and PollyXT provided measurements at 355 nm (blue)
and 532 nm (light green). All optical properties are shown for the period 22:45–01:02 UTC, except for the depolarization ratios shown at
22:12–22:32 UTC to be at the same time as the 1064 nm depolarization ratio measurement.

conditions observed with the BERTHA lidar system. Dur-                  Fig. 1c–f. The profiles at 532 nm (green lines) from the dif-
ing the first 20 min the system was in the configuration to             ferent lidar observations agree well.
measure the depolarization ratio at 1064 nm. Then, the con-                In the dust layer (main part at 3–5 km height, extend-
figuration was switched to permit measurements of the ex-               ing up to 8 km height), no wavelength dependence for the
tinction coefficient at 1064 nm for the next 2 h 15 min. Some           backscatter coefficient between 355 and 532 nm was found
clouds were forming in the humid dust layer at around 4 km              (backscatter Ångström exponent, BAE = 0.040 ± 0.524).
height, indicated by strong backscatter signals (dark red)              The backscatter coefficient at 1064 nm was around 80 % of
and the attenuation of laser radiation above the cloud lay-             the value at 532 nm within the dust layer.
ers. The cloud-containing profiles were excluded from the                  The extinction coefficient exceeded 100 Mm−1 at around
calculation of the dust optical properties but used for the es-         3.5 km height at all three wavelengths. The total AOD was
timation of the cross-talk correction. The signals at 355 nm            approximately 0.45 at 532 nm during that night. The extinc-
of the BERTHA lidar were very weak during that night. In                tion Ångström exponent (EAE, Fig. 1e) values were verti-
fact, neutral density filters in front of the UV channels were          cally constant within the dust layer and close to zero but
not adapted to the strongly reduced power of the UV laser.              slightly negative. The lidar ratio (Fig. 1f) derived in the
Therefore, the optical properties at 355 nm were taken from             strongest part of the dust layer (3–5 km height) increased
the nearby PollyXT measurements. Additionally, the optical              with wavelength from 47 ± 8 sr at 355 nm to 50 ± 5 sr at
properties at 532 nm measured with PollyXT are shown in                 532 nm and 69 ± 14 sr at 1064 nm. The particle linear de-

Atmos. Chem. Phys., 22, 355–369, 2022                                                       https://doi.org/10.5194/acp-22-355-2022
M. Haarig et al.: Dust lidar ratio at 1064 nm                                                                               359

polarization ratio (PLDR) at 532 nm of up to 0.30 ± 0.02           eraged. The main dust layer extended from 1.5–4 km height
(3–5 km layer mean and systematic uncertainty) indicates           and provided vertically homogeneous conditions for averag-
pure-dust conditions (Freudenthaler et al., 2009). The PLDR        ing. The profiles of the extinction coefficients and lidar ra-
decreases towards 355 nm (0.242 ± 0.024) and 1064 nm               tios in Fig. 3d and f are shown for a sliding average window
(0.206 ± 0.010). In order to compare simultaneous observa-         length of 750 m.
tions of the PLDR, the values are reported for the first 20 min       The AOD was 0.41 at 355 nm, 0.37 at 532 nm and 0.34 at
(22:12–22:32 UTC) when the 1064 nm channels measured               1064 nm. The lidar ratio in the center of the dust layer (2.0–
the depolarization ratio, whereas all other intensive optical      3.5 km height) at 1064 nm (57 ± 9 sr) was slightly higher
properties were measured from 22:45–01:02 UTC. The de-             than at 532 nm (46 ± 5 sr). The slight increase in the lidar
polarization ratios for the later period were nearly the same      ratio at 355 nm (49 ± 4 sr) compared to 532 nm could be an
(0.256 ± 0.025 and 0.298 ± 0.017 at 355 and 532 nm, respec-        indication for pollution mixed into the dust layer.
tively). A summary of the intensive optical properties mea-           The depolarization ratios (Fig. 3g) were measured from
sured in the night of 22–23 February 2021 can be found in          20:44–21:04 UTC. The dashed lines indicate the depolariza-
Table 1.                                                           tion ratios at 355 and 532 nm (layer mean values (2.0–3.5 km
   The AERONET v3 inversion results for the lidar ratio and        height) of 0.179 ± 0.053 and 0.264 ± 0.0163, respectively)
PLDR (five separate observations) performed on 23 Febru-           measured at the same time as the other optical properties
ary 2021 between 11:35 and 14:49 UTC will be compared              (21:11–00:32 UTC). The dust layer showed a larger vertical
with the lidar observations in Sect. 4. The AERONET mea-           extent up to 5 km height and higher values of the PLDR at
surement period is indicated in Fig. 2. The continuous obser-      532 nm (0.292 ± 0.016) during the first shorter measurement
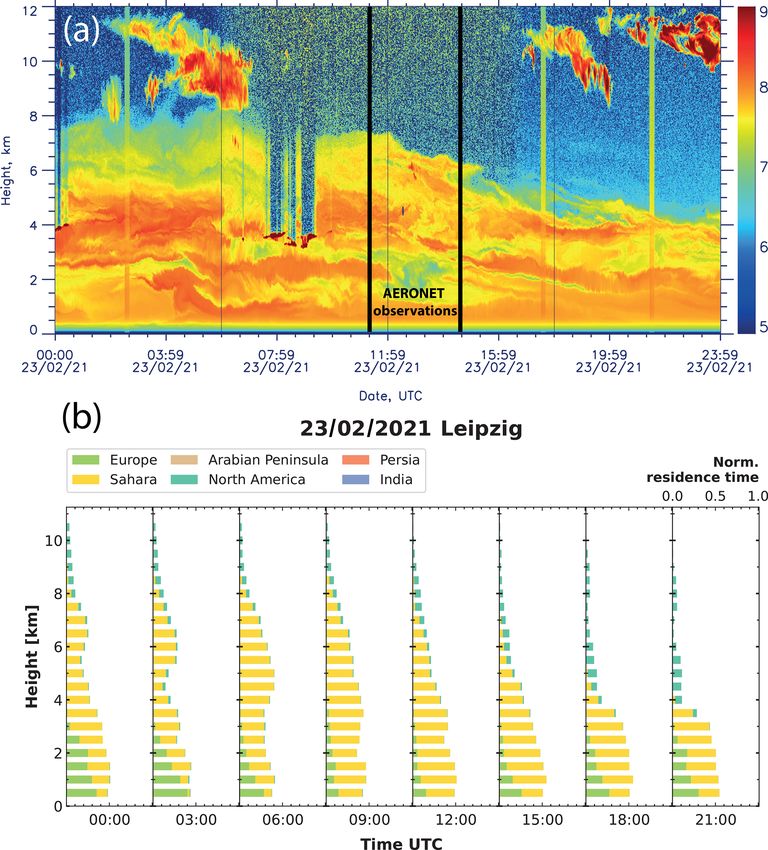
vations of PollyXT and the source attribution for 23 February      period. Especially, the PLDR at 355 nm was significantly re-
2021 in Fig. 2 reveal that the same Saharan dust layer was         duced (0.174 ± 0.041) compared to the previous case with
present during the nighttime lidar measurements and the day-       pure-dust conditions. The longer transport over Europe obvi-
time AERONET observations. At lower heights, Europe is             ously caused the weak mixing with anthropogenic pollution.
indicated besides the Sahara as a potential source region. The     A summary of the intensive optical properties measured on
AERONET measurements from 22 February 2021 did not                 3 March 2021 can be found in Table 1. Unfortunately, no
capture the Saharan dust event, which arrived at 19:00 UTC         AERONET observations could be used for comparison. The
at Leipzig, with the first slices arriving already at 16:00 UTC.   dust layer was accompanied by extended cirrus layers pre-
                                                                   venting sun photometer observations, and on the next day
3.2   Second dust outbreak: 3 March 2021
                                                                   the precipitation event removed the dust.

A second dust outbreak occurred 1 week later on 3 March
                                                                   4     Discussion
2021. The travel time was 3–4 d from the Sahara to Leipzig
via Spain and France as indicated by the HYSPLIT back-             4.1    Backscatter and extinction Ångström exponent
ward trajectories in Fig. 3b. On 3 March 2021, the dust
plume arrived around 10:00 UTC over Leipzig with some cir-         The aerosol optical depth from the lidar measurement in the
rus clouds above. In the night, the dust plume reached its         night of 22–23 February 2021 was 0.48 ± 0.03 at 355 nm,
largest vertical extent. Some clouds were formed within the        0.45 ± 0.03 at 532 nm and 0.45 ± 0.03 at 1064 nm. Below the
dust layer. On the morning of 4 March, around 06:00 UTC,           dust layer, the backscatter coefficient times a lidar ratio of
precipitation started and washed out the dust. The develop-        50 sr was used to estimate the extinction coefficient. The un-
ment of the dust plume over Leipzig was studied using the          certainty was estimated by varying the lidar ratio by ± 10 sr.
continuous observation of PollyNET (https://polly.tropos.de/       Figure 2 shows a slight decrease in the dust plume height un-
calendar/location/1, Baars et al., 2016).                          til the next morning where the AERONET observations were
   This time the BERTHA lidar was fully operational at             performed. Slightly lower AODs of 0.43 at 340 nm, 0.42 at
all three wavelengths so that also the optical properties at       500 nm and 0.36 at 1020 nm were measured by the photome-
355 nm could be used. The lidar observations are shown in          ter (AERONET, 2021).
Fig. 3. The dust layer extended up to 5 km in the beginning;           The intensive optical properties such as the extinction
later on the dust plume descended down to 4 km height. Dur-        Ångström exponent (EAE) are given in Table 1. The lidar-
ing the first 20 min, the lidar was configured to measure the      derived EAE values for the three wavelengths are all nega-
depolarization ratio at 1064 nm (3+2+3 configuration). The         tive but close to zero, ranging between −0.005 (355/532) and
process of changing the interference and polarization filters      −0.098 (355/1064). Negative EAE (355/532) values down to
was optimized so that 7 min later the extinction measure-          −0.2 were observed for Saharan dust in Senegal (Veselovskii
ment at 1064 nm could be started (3 + 3 + 2 configuration).        et al., 2016), where the EAE of Saharan dust accumulated in
To avoid strong vertical smoothing of the extinction coeffi-       the interval of −0.2 to 0.2.
cient at 1064 nm as done in the previous case, signal pro-             The AERONET observations from the early morning of
files collected over 3 h 20 min (21:11–00:32 UTC) were av-         23 February 2021 showed an Ångström exponent calculated

https://doi.org/10.5194/acp-22-355-2022                                               Atmos. Chem. Phys., 22, 355–369, 2022
360 M. Haarig et al.: Dust lidar ratio at 1064 nm Figure 2. Development of the dust layer over Leipzig on 23 February 2021. (a) Cross-polarized, range-corrected signal at 532 nm measured with PollyXT (color scale in arbitrary units). The period of the five AERONET observations is marked by thick black vertical bars (please note that the date format in this panel is day/month/year). (b) Source attribution in 3 h intervals by using the method of Radenz et al. (2021). The normalized residence time of the air masses close to the ground (below 2 km height) within 10 d prior to the arrival over Leipzig at the indicated timestamps on 23 February 2021 is shown. The trajectory calculations are based on FLEXPART (FLEXible PARTicle dispersion model). The colors indicate different regions defined in Radenz et al. (2021). Here, the Sahara, continental Europe and North America are relevant. from the AOD at 440 and 870 nm of 0.217 ± 0.039 and The backscatter Ångström exponent (BAE) values are pro- for the wavelengths 380/500 of 0.124 ± 0.073 (AERONET, vided in Table 1. The backscatter coefficients at 355 and 2021). The greater and positive Ångström exponent of the 532 nm were almost the same (100 ± 5%), whereas values AERONET observations might be influenced by the small at 1064 nm were lower (here 79 % of the value at 532 nm) urban haze particles in the wintertime planetary boundary as found in other observations of mineral dust (Veselovskii layer. The lidar data did not include these urban haze ef- et al., 2016; Hofer et al., 2020). This behavior is expressed in fects. Considering the whole column, AOD Ångström expo- the BAE (532/1064) of 0.35 and that at Barbados of 0.47. nents from the lidar observations of 0.155 ± 0.177 (355/532), Liu et al. (2008) reported CALIPSO observations of the 0.008 ± 0.021 (532/1064) and 0.062 ± 0.015 (355/1064) backscatter color ratios (1064/532) of 0.72–0.75 in Saharan were obtained. The AOD Ångström exponent in the UV– dust. This translates to an average BAE of 0.44, which is VIS range agrees within the uncertainties, whereas the higher comparable to the value observed in the Saharan air layer AOD at 1064 nm led to lower Ångström exponents from at Barbados. the lidar, probably due to an overestimation of the AOD at 1064 nm in the boundary layer. Atmos. Chem. Phys., 22, 355–369, 2022 https://doi.org/10.5194/acp-22-355-2022
M. Haarig et al.: Dust lidar ratio at 1064 nm                                                                                                     361

Table 1. Intensive optical properties of Saharan dust observed at Leipzig on 22–23 February (pure-dust case) and 3 March 2021 (slightly
polluted-dust case). For comparison, the optical properties of long-range-transported Saharan dust at Barbados as observed during the
SALTRACE campaign are provided; the PLDR values during SALTRACE are taken from Haarig et al. (2017). The PLDR values of the
Leipzig cases are reported for the triple-wavelength depolarization setup of the measurement (first 20 min), whereas the other properties are
reported for the triple-wavelength extinction measurement. SAL – Saharan air layer, PLDR – particle linear depolarization ratio, EAE –
extinction Ångström exponent, BAE – backscatter Ångström exponent.

                                                 Wavelength (nm)             22–23 Feb 2021             3 Mar 2021             SALTRACE
                     Height range                                                       3–5 km             2–3.5 km                         SAL
                                                                  355                 47 ± 8 sr             49 ± 4 sr             59 ± 16 sr
                     Lidar ratio                                  532                 50 ± 5 sr             46 ± 5 sr              57 ± 8 sr
                                                                 1064                69 ± 14 sr             57 ± 9 sr            67 ± 15 sra
                                                            355/532                0.94 ± 0.19           1.07 ± 0.14            1.04 ± 0.30
                     Ratio of lidar ratios
                                                           1064/532                1.38 ± 0.31           1.24 ± 0.24           1.31 ± 0.32b
                                                                  355           0.242 ± 0.024        0.174 ± 0.041            0.252 ± 0.030
                     PLDR                                         532           0.299 ± 0.018        0.292 ± 0.016            0.280 ± 0.020
                                                                 1064           0.206 ± 0.010        0.242 ± 0.007            0.225 ± 0.022
                                                            355/532                0.81 ± 0.09           0.60 ± 0.14             0.90 ± 0.12
                     Ratio of the PLDR
                                                           1064/532                0.69 ± 0.05           0.83 ± 0.05             0.80 ± 0.10
                                                            355/532        −0.005 ± 0.186 c          0.332 ± 0.051            0.103 ± 0.254
                     EAE                                   532/1064         −0.083 ± 0.213           0.008 ± 0.079                        –
                                                           355/1064         −0.098 ± 0.139           0.128 ± 0.067                        –
                                                            355/532           0.040 ± 0.524c         0.120 ± 0.276         −0.030 ± 0.153
                     BAE                                   532/1064            0.347 ± 0.260         0.345 ± 0.260          0.474 ± 0.201
                                                           355/1064            0.187 ± 0.193         0.262 ± 0.144                      –
                   a Estimated using lidar and AERONET. b Here the lidar ratio at 532 nm (51 sr) of the same day (20 June 2014) was used.
                   c PollyXT data at 355 and 532 nm were used.

4.2   Spectral dependence of the lidar ratio                                         An AOD contribution of 0.035 for marine aerosol below the
                                                                                     dust layer was subtracted to obtain the pure-dust value for the
The discussion of the spectral behavior of the lidar ratio                           lidar ratio estimate. This method led to a dust lidar ratio of
of Saharan dust is based on the two presented case stud-                             67 ± 15 sr at 1064 nm.
ies from Leipzig and observations at Barbados during the                                The spectral dependence of the lidar ratio of Saharan dust
Saharan Aerosol Long-range Transport and Aerosol–Cloud-                              is shown in Fig. 4a. The lidar ratio does not change signifi-
Interaction Experiment (SALTRACE, Weinzierl et al.,                                  cantly in the wavelength range of 355 to 532 nm. In the case
2017). The BERTHA lidar system at Barbados (13◦ N,                                   of Saharan dust, this behavior was observed in numerous
59◦ W) measured the Saharan dust after long-range transport                          studies (e.g., Tesche et al., 2011; Groß et al., 2015). Some
over 5000–8000 km across the Atlantic Ocean in three in-                             studies, however, point to higher values in the UV (Mattis
tensive campaigns in 2013 and 2014 (Haarig et al., 2017).                            et al., 2002). Veselovskii et al. (2020) observed cases with
The statistics of the lidar ratio at 355 and 532 nm and the                          the same lidar ratio at 355 and 532 nm and cases with higher
Ångström exponents based on 22 SALTRACE measurement                                  lidar ratios at 355 nm. The ratio of lidar ratios for 355 and
cases are reported in the present publication for the first time                     532 nm is an indicator of the imaginary refractive index en-
(Table 1).                                                                           hancement in the UV depending on the mineralogical com-
   During the SALTRACE campaigns, the rotational Raman                               position of the dust particles (Veselovskii et al., 2020).
technique applied to measure the extinction at 1064 nm was                              The present study indicates an increase of the lidar ra-
not implemented in the BERTHA lidar. However, the lidar                              tio from 532 to 1064 nm. As mentioned, the reason is the
ratio at 1064 nm could be estimated for one intense dust                             lower particle backscatter coefficient β at 1064 nm compared
event with very homogeneous dust conditions observed on                              to the one at 532 nm so that the backscatter Ångström ex-
20 June 2014. Here, the column-integrated backscatter co-                            ponent BAE, defined as BAEλi ,λj = ln(βi /βj )/ ln(λj /λi ) in
efficient at 1064 nm in the dust layer after sunset and the                          the spectral range from wavelength λi to λj , is positive.
AOD at 1020 nm (from AERONET observations) before sun-                               The extinction coefficient α usually does not show a signifi-
set were used as described in Mamouri and Ansmann (2017).                            cant wavelength dependence so that the respective extinction

https://doi.org/10.5194/acp-22-355-2022                                                                       Atmos. Chem. Phys., 22, 355–369, 2022
362 M. Haarig et al.: Dust lidar ratio at 1064 nm
Figure 3. Same as Fig. 1, except for 3–4 March 2021 at 20:44–00:32 UTC. (a) Time–height display of the 532 nm cross-polarized, range-
corrected (RC) signal. (b) HYSPLIT back trajectory for 3 March 2021 at 22:00 UTC (please note that the date format in this panel is
month/day). (c) Particle backscatter coefficient (200 m vertical smoothing). (d) Particle extinction coefficient (750 m vertical smoothing).
(e) Extinction Ångström exponent (EAE, 750 m vertical smoothing) and backscatter Ångström exponent (BAE, 200 m vertical smoothing) for
the given wavelengths pairs. (f) Lidar ratio (750 m vertical smoothing). (g) Particle linear depolarization ratio (PLDR, 200 m vertical smooth-
ing). All shown optical properties are the mean profiles from 21:11–00:32 UTC, except the thick lines of the PLDR (20:44–21:04 UTC). The
dashed lines of the PLDR at 355 and 532 nm belong to the main measurement at 21:11–00:32 UTC, where the dust layer height decreased.
Ångström exponent EAE is close to zero as shown in Figs. 1e dependent of wavelength with values of 55 ± 5, 56 ± 5 and
and 3e. According to Ansmann et al. (2002), the lidar-ratio- 59 ± 7 sr at 355, 532 and 1064 nm, respectively (Tesche et al.,
related Ångström exponent SAE, given by 2009). The authors used the extinction Ångström exponent
(for the 500–1020 nm wavelength range) from sun photome-
SAE = EAE − BAE , (1) ter observations to transfer the extinction profile from 532
to 1064 nm and calculate the lidar ratio at 1064 nm using
is then negative. This relationship (Eq. 1) holds within the the corresponding backscatter profile in addition. In contrast
uncertainties for the intensive optical properties provided in to those measurements for freshly emitted dust close to its
Table 1. source, we found lidar ratio values of 47 ± 8, 50 ± 5 and
The ratios of the lidar ratios given in Table 1 quantify 69 ± 14 sr for the three wavelengths after a dust transport of
the increase of the lidar ratio from 532 to 1064 nm. We less than 2 d.
found around 24 %–38 % higher values for the lidar ratio The spectral dependence of the lidar ratio measured with
at 1064 nm compared to 532 nm. A similar increase (27 %– lidar and retrieved from the AERONET observations is com-
34 %) in the lidar ratio from 532 to 1064 nm was observed pared in Fig. 4b. The AERONET database (AERONET,
from three early CALIPSO measurements of Saharan dust 2021) provides AOD values at 440, 675, 870 and 1020 nm to-
transported from Africa across the Atlantic (Liu et al., 2008). gether with further products such as the lidar ratio and linear
Combined sun photometer and lidar observations during depolarization ratio. The lidar ratio and particle linear depo-
the Saharan Mineral Dust Experiment (SAMUM) in Mo- larization ratio are retrieved by means of the AERONET v3
rocco led to the conclusion that the lidar ratio is almost in-
Atmos. Chem. Phys., 22, 355–369, 2022 https://doi.org/10.5194/acp-22-355-2022M. Haarig et al.: Dust lidar ratio at 1064 nm 363
Figure 5. (a) Spectral dependence of the particle linear depolariza-
Figure 4. (a) Spectral dependence of the lidar ratio of Saharan dust tion ratio (PLDR) of desert dust. The Leipzig observations are com-
observed at Leipzig and Barbados (during SALTRACE). The lidar pared with triple-wavelength depolarization ratio measurements of
ratio at 1064 nm during SALTRACE (open diamond) was estimated Saharan dust and fresh dust available in the literature (Ha17 –
on 20 June 2014 combining AERONET AOD and lidar observa- Haarig et al., 2017; Fr09 – Freudenthaler et al., 2009; Bu15 –
tions (see text for explanations and Mamouri and Ansmann, 2017; Burton et al., 2015; and Hu20 – Hu et al., 2020; please note that
please note that the date format is year-month-day). (b) Spectral de- the date format is year-month-day). (b) Spectral dependence of
pendence of the lidar ratio of Saharan dust observed in the night the PLDR of Saharan dust observed in the night of 22–23 Febru-
of 22–23 February 2021 compared with AERONET v3 inversion ary 2021 compared with AERONET v3 inversion solutions for the
solutions for the lidar ratio on 23 February 2021. The results of PLDR on 23 February 2021. The results of the five photometer
the five photometer scans (open triangles) at indicated times are scans at indicated times are shown together with the mean of the
shown together with the mean of the four-wavelength retrieval (or- four-wavelength retrieval (orange squares, standard retrieval) and
ange squares, standard retrieval) and the six- and seven-wavelength the six- and seven-wavelength retrieval (pink and purple squares,
retrieval (pink and purple squares, GRASP method). The GRASP GRASP method). The GRASP retrieval at 1640 nm (not shown)
retrieval at 1640 nm (not shown) leads to lidar ratios of 94 ± 8 (us- leads to PLDR values of 0.184 ± 0.007 (using six wavelengths) and
ing six wavelengths) and 101 ± 4 sr (using seven wavelengths). 0.192 ± 0.008 (using seven wavelengths).
inversion algorithm (Dubovik and King, 2000; Giles et al.,
2019; Sinyuk et al., 2020), which assumes a spheroidal dust
particle shape (Dubovik et al., 2006). Additionally to the The spectral slope of the lidar ratio is well reproduced
standard four wavelengths, the inversion was performed us- by the AERONET observations for the spectral range from
ing the GRASP algorithm at six wavelengths (plus 500 and 675 to 1020 nm. The seven-wavelength mean values show
1640 nm) and seven wavelengths (plus 380 nm, Dubovik exactly the same spectral slope as obtained by the lidar ob-
et al., 2014; Torres et al., 2017; Dubovik et al., 2021). For the servations. The retrieved lidar ratios at 440 nm using the stan-
mean values the data were filtered in the way that the residual dard AERONET algorithm indicate higher values of the li-
is < 10 % of the inversion retrieval. Since radiance measure- dar ratio in the UV range. The GRASP retrieval at 440 nm
ments were included in the GRASP data analysis, the refrac- shows a much better agreement with the lidar observations.
tive index and the sphericity are not preset and are retrieved The increase of the lidar ratio at 380 nm (seven-wavelength
following the same strategy as AERONET but with the ex- retrieval) points again to higher values of the lidar ratio in
tra information provided by the use of more wavelengths. the UV range. The enhanced lidar ratios in the UV retrieved
A comparison of the lidar observations with the respective by AERONET were already discussed by Shin et al. (2018):
AERONET v3 inversion products was only possible on 22– the increase of the imaginary part of the refractive index at
23 February 2021. 440 nm compared to 675 nm is too strong in the AERONET
https://doi.org/10.5194/acp-22-355-2022 Atmos. Chem. Phys., 22, 355–369, 2022364 M. Haarig et al.: Dust lidar ratio at 1064 nm
inversion procedure, resulting in lidar ratios that are too high is expressed by PLDR ratios of 0.69–0.83 for Saharan dust
at 440 nm. after long-range transport (Table 1).
However, in the present case the explanation might be sim- The spectral slope of the PLDR is not a unique feature of
pler. The sun photometer measures columnar values, whereas Saharan dust. Hu et al. (2020) observed the same spectral de-
the profile measurement of lidar permits focusing on the dust pendence but with generally higher values for dust from the
layer only. The fine-mode aerosol pollution of the winter- Taklamakan Desert in western China. Observations were per-
time boundary layer at Leipzig can significantly influence formed very close to the main dust sources and thus with an
the AERONET lidar ratio products, especially at the shorter enhanced fraction of very large dust particles. The same be-
wavelengths of 440 and 380 nm. Therefore, the columnar li- havior was found for locally emitted dust in the southwest of
dar ratio should increase towards the UV. the United States (Burton et al., 2015). The large dust par-
As mentioned, the refractive index depends on the min- ticles of the freshly emitted dust were still present in the
eralogical composition of dust particles, and this changes air during the lidar observations and produced significantly
for different dust source regions. Schuster et al. (2012) in- higher depolarization ratios of 0.38 ± 0.01 at 1064 nm.
vestigated the variation of the lidar ratio obtained from The spectral dependence of the PLDR in Fig. 5b derived
AERONET observations for different deserts around the from the sun and sky photometer observations is very dif-
earth and found significant differences. The highest lidar ferent from the respective lidar observations of the PLDR
ratios were found for the western Sahara, with lower val- spectral behavior. The lidar measurements of desert dust gen-
ues for Asian deserts. The global coverage of AERONET erally show a pronounced maximum of the depolarization
sun photometers is a big advantage. However, the retrievals ratio in the visible wavelength range. This is not visible in
should be checked against Raman or high-spectral-resolution the AERONET spectra. Using the GRASP method (includ-
lidar (HSRL) observations as has been started by Shin et al. ing the use of optical data measured at 1640 nm, not shown in
(2018), ideally in a desert, where no other aerosol type con- the figure) leads to a decrease of the PLDR with wavelength,
tributes to the columnar values. The present study indicates a starting already at 1020 nm. However, the PLDR in the NIR
good agreement of the lidar ratio in the spectral range of 675 is still overestimated for the presented case, in which a PLDR
to 1020 nm. of 0.206 ± 0.010 at 1064 nm was measured. Compared to
previous observations of the PLDR at 1064 nm (Fig. 5), the
value is quite low. The six- and seven-wavelength GRASP
4.3 Spectral dependence of the depolarization ratio retrievals lead to a better agreement in the NIR but underesti-
mates the depolarization ratio at shorter wavelengths. Previ-
The spectral dependence of the particle linear depolariza- ous comparisons of lidar-measured and AERONET-retrieved
tion ratio of Saharan dust is shown in Fig. 5a. The results depolarization ratios pointed out that the spheroidal model
of the two presented case studies are in the context of previ- used for the AERONET inversions fails to predict the spec-
ous triple-wavelength depolarization ratio observations. The tral slope of the PLDR (Noh et al., 2017; Shin et al., 2018).
observations of Saharan dust close to its source in Morocco Only Toledano et al. (2019) were able to obtain the spec-
(Freudenthaler et al., 2009) and after long-range transport tral slope as observed with polarization lidar systems by
towards Barbados (Haarig et al., 2017) and North America using the six-wavelength sun photometer retrieval for Sa-
(Burton et al., 2015) show a consistent spectral slope. The haran dust observations on Barbados during SALTRACE.
PLDR increases in the wavelength range from 355 to 532 nm In their study, the PLDR increases from 0.277 ± 0.040 at
and then decreases again towards the wavelength of 1064 nm. 440 nm to 0.282 ± 0.031 at 675 nm and then decreases again
Table 1 provides the values for the two presented case to 0.259 ± 0.030 at 1020 nm. A further decrease was re-
studies at Leipzig and the SALTRACE observations. The ta- trieved for the wavelength of 1640 nm (0.191 ± 0.028).
ble includes the ratio of the PLDR for the wavelength pairs Again, the boundary-layer fine-mode pollution (over
of 355 and 532 nm and of 1064 and 532 nm. The depo- Leipzig) influenced the AERONET retrievals and may lead
larization ratio at 355 nm was very low on 3 March 2021 to smaller AERONET depolarization ratio values than ob-
(0.174 ± 0.041) and probably reflects the impact of aerosol served with lidar in the lofted dust layer. However, the
pollution mixed into the dust layers. The small and spher- significant discrepancies between the AERONET and the
ical pollution particles affect the backscattering at shorter lidar observations in the 532–1064 nm spectral range re-
wavelengths more effectively than at longer wavelengths. For main an unsolved issue and seem to be related to the used
pure Saharan dust (22–23 February 2021, Barbados and Mo- spheroidal shape model in the AERONET and GRASP re-
rocco), the PLDR at 355 nm reached around 80 %–90 % of trieval schemes.
the value at 532 nm. The PLDR at 1064 nm depends on the
amount of rather large dust particles in the observed layer
and thus is very sensitive to the travel duration (and the cor-
responding removal of large particles). The decrease of the
PLDR with wavelength in the range from 532 to 1064 nm
Atmos. Chem. Phys., 22, 355–369, 2022 https://doi.org/10.5194/acp-22-355-2022M. Haarig et al.: Dust lidar ratio at 1064 nm 365
5 Conclusions tometer retrievals are not optimized for this special angle.
Joint inversions of the lidar and photometer data as done in
We presented, for the first time, measurements of the dust Lopatin et al. (2021) would be desirable.
lidar ratio at the main aerosol lidar wavelengths of 355, The lidar measurements could confirm the spectral slope
532 and 1064 nm. Together with the depolarization ratio at of the lidar ratio from the visible spectrum towards the NIR
these wavelengths, we demonstrated the unique potential of retrieved by the AERONET and GRASP data analysis. The
a triple-wavelength polarization Raman lidar to permit so- fine-mode pollution aerosol in the boundary layer led to
called 3+3+3 profiling (three backscatter coefficients, three higher lidar ratios in the UV from the columnar photome-
extinction coefficients and three depolarization ratios). Two ter measurements compared to the Saharan dust observations
case studies of Saharan dust over central Europe were pre- with lidar.
sented, one for pure-dust conditions and another case with We may conclude that an appropriate particle shape model
slightly polluted dust. The measurement of the depolariza- for the non-spherical dust particles is still missing. The
tion ratio and lidar ratio at three wavelengths from 355 to spheroidal shape model (Dubovik et al., 2006) has proven
1064 nm provides an improved, more complete set of con- to be useful to derive volume and surface area concentrations
straints in modeling efforts to develop a realistic dust particle from sky radiance and AOD observations at several wave-
shape model. A better assessment of the absorption proper- lengths even for non-spherical dust particles. However, this
ties which are linked to the mineralogical composition of the shape model is not able to reproduce the spectral slope of
dust particles may be possible by considering the spectral the particle linear depolarization ratio with a maximum at
information of the lidar ratio at 355, 532 and 1064 nm. Nev- 532 nm measured with lidar at the 180◦ backscatter direc-
ertheless, realistic assumptions of the imaginary part of the tion. Complex particle shape models (Gasteiger et al., 2011;
refractive index are required. Good measurements of the re- Kemppinen et al., 2015; Saito et al., 2021) are computation-
fractive index are important to allow for an accurate compu- ally expensive. Nevertheless, they may lead to a more realis-
tation of the spectral slope of the lidar ratio in the wavelength tic representation of the irregularly shaped dust particles for
range from 355 to 1064 nm. the 180◦ backscatter direction in the models.
To derive the extinction coefficient at 1064 nm from As a final remark, it would be helpful – and a good addi-
backscatter lidars and ceilometers, realistic estimates of the tion to field observations – if laboratory measurements of the
lidar ratio at this wavelength are necessary. We presented the depolarization and lidar ratios at all three wavelengths (in the
first direct measurements of the lidar ratio at 1064 nm for Sa- 180◦ backscatter direction) could be realized for well-defined
haran dust. It would be desirable, in this context, to perform size fractions of real dust particles with real irregular-shape
such triple-wavelength lidar measurements in very different characteristics. An effort was already started by Miffre et al.
desert regions of the world. Middle Eastern and central Asian (2016).
dust show, e.g., lower lidar ratios, especially at 532 nm, as
presented here (Hofer et al., 2020). We found lidar ratios of
47 ± 8, 50 ± 5 and 69 ± 14 sr at 355, 532 and 1064 nm, re- Data availability. The BERTHA lidar data can be obtained upon
spectively, for pure-dust conditions and respective lidar ra- request from Moritz Haarig (haarig@tropos.de). The PollyXT data
tios of 49 ± 4, 46 ± 5 and 57 ± 9 sr for slightly polluted dust. are available in the PollyNET database (https://polly.tropos.de/)
In central Asia, pure-dust lidar ratios were on average 43 ± 3 (PollyNET, 2021). The AERONET data are available via the
AERONET web page (https://aeronet.gsfc.nasa.gov/) under the site
and 39 ± 4 sr at 355 and 532 nm, respectively (Hofer et al.,
“Leipzig” (AERONET, 2021).
2020).
The lidar ratios at 532 and 1064 nm are important input
parameters for the CALIPSO lidar data analysis to derive the Author contributions. MH performed the lidar measurements,
respective extinction coefficients at these two wavelengths analyzed the data and wrote the manuscript. AA provided advice
(Omar et al., 2009). In version 4 of the retrieval algorithm, and valuable comments on the manuscript. RE supported the rota-
lidar ratios of 44 ± 9 sr at 532 nm and 44 ± 13 sr at 1064 nm tional Raman measurements. HB provided the PollyXT results. DA
are used for the aerosol type of pure dust (Kim et al., 2018). provided technical support for the BERTHA lidar system. CT and
Based on our results, we would suggest to use a higher value BT provided the six- and seven-wavelength GRASP retrieval. MR
at 1064 nm compared to 532 nm. did the source appointment analysis. UW provided comments on
The comparison with AERONET v3 inversion products re- light scattering.
vealed that the spectral dependence of the PLDR was not
matched by the AERONET results. The GRASP computa-
tions based on the optical information (AOD and radiances) Competing interests. The contact author has declared that nei-
measured at six and seven wavelengths improved the agree- ther they nor their co-authors have any competing interests.
ment but led to overall lower values. In contrast to lidar sys-
tems which only operate at a 180◦ backscatter angle, this an-
gle is not accessible for the photometer. Therefore, the pho-
https://doi.org/10.5194/acp-22-355-2022 Atmos. Chem. Phys., 22, 355–369, 2022366 M. Haarig et al.: Dust lidar ratio at 1064 nm
Disclaimer. Publisher’s note: Copernicus Publications remains Froyd, K. D.: Aerosol classification using airborne High Spectral
neutral with regard to jurisdictional claims in published maps and Resolution Lidar measurements – methodology and examples,
institutional affiliations. Atmos. Meas. Tech., 5, 73–98, https://doi.org/10.5194/amt-5-73-
2012, 2012.
Burton, S. P., Hair, J. W., Kahnert, M., Ferrare, R. A., Hostetler,
Acknowledgements. The authors thank Mark Vaughan, Oleg C. A., Cook, A. L., Harper, D. B., Berkoff, T. A., Seaman, S.
Dubovik and the anonymous reviewer for their helpful comments T., Collins, J. E., Fenn, M. A., and Rogers, R. R.: Observa-
and suggestions improving the quality of the paper. tions of the spectral dependence of linear particle depolariza-
tion ratio of aerosols using NASA Langley airborne High Spec-
tral Resolution Lidar, Atmos. Chem. Phys., 15, 13453–13473,
Financial support. The publication of this article was funded by https://doi.org/10.5194/acp-15-13453-2015, 2015.
the Open Access Fund of the Leibniz Association. Dubovik, O. and King, M. D.: A flexible inversion algorithm for re-
trieval of aerosol optical properties from Sun and sky radiance
measurements, J. Geophys. Res.-Atmos., 105, 20673–20696,
https://doi.org/10.1029/2000JD900282, 2000.
Review statement. This paper was edited by Farahnaz Khosrawi
Dubovik, O., Sinyuk, A., Lapyonok, T., Holben, B. N., Mishchenko,
and reviewed by Mark Vaughan, Oleg Dubovik, and one anonymous
M., Yang, P., Eck, T. F., Volten, H., Muñoz, O., Veihelmann, B.,
referee.
van der Zande, W. J., Leon, J.-F., Sorokin, M., and Slutsker, I.:
Application of spheroid models to account for aerosol particle
nonsphericity in remote sensing of desert dust, J. Geophys. Res.-
References Atmos., 111, D11208, https://doi.org/10.1029/2005JD006619,
2006.
AERONET: Aerosol Robotic Network aerosol database, available Dubovik, O., Lapyonok, T., Litvinov, P., Herman, M., Fuertes, D.,
at: https://aeronet.gsfc.nasa.gov/, last access: 23 June 2021. Ducos, F., Lopatin, A., Chaikovsky, A., Torres, B., Derimian, Y.,
Ansmann, A., Wagner, F., Müller, D., Althausen, D., Herber, Huang, X., Aspetsberger, M., and Federspiel, C.: GRASP: a ver-
A., von Hoyningen-Huene, W., and Wandinger, U.: European satile algorithm for characterizing the atmosphere, SPIE: News-
pollution outbreaks during ACE 2: Optical particle proper- room, https://doi.org/10.1117/2.1201408.005558, 2014.
ties inferred from multiwavelength lidar and star-Sun pho- Dubovik, O., Fuertes, D., Litvinov, P., Lopatin, A., Lapyonok, T.,
tometry, J. Geophys. Res.-Atmos., 107, AAC 8-1–AAC 8-14, Doubovik, I., Xu, F., Ducos, F., Chen, C., Torres, B., Derimian,
https://doi.org/10.1029/2001JD001109, 2002. Y., Li, L., Herreras-Giralda, M., Herrera, M., Karol, Y., Matar,
Ansmann, A., Bösenberg, J., Chaikovsky, A., Comerón, A., Eck- C., Schuster, G. L., Espinosa, R., Puthukkudy, A., Li, Z., Fischer,
hardt, S., Eixmann, R., Freudenthaler, V., Ginoux, P., Komguem, J., Preusker, R., Cuesta, J., Kreuter, A., Cede, A., Aspetsberger,
L., Linné, H., Márquez, M. A. L., Matthias, V., Mattis, I., Mitev, M., Marth, D., Bindreiter, L., Hangler, A., Lanzinger, V., Holter,
V., Müller, D., Music, S., Nickovic, S., Pelon, J., Sauvage, L., C., and Federspiel, C.: A Comprehensive Description of Multi-
Sobolewsky, P., Srivastava, M. K., Stohl, A., Torres, O., Vaughan, Term LSM for Applying Multiple a Priori Constraints in Prob-
G., Wandinger, U., and Wiegner, M.: Long-range transport of Sa- lems of Atmospheric Remote Sensing: GRASP Algorithm, Con-
haran dust to northern Europe: The 11–16 October 2001 outbreak cept, and Applications, Frontiers in Remote Sensing, 2, 706851,
observed with EARLINET, J. Geophys. Res.-Atmos., 108, 4783, https://doi.org/10.3389/frsen.2021.706851, 2021.
https://doi.org/10.1029/2003JD003757, 2003. Engelmann, R., Kanitz, T., Baars, H., Heese, B., Althausen, D.,
Baars, H., Kanitz, T., Engelmann, R., Althausen, D., Heese, Skupin, A., Wandinger, U., Komppula, M., Stachlewska, I. S.,
B., Komppula, M., Preißler, J., Tesche, M., Ansmann, A., Amiridis, V., Marinou, E., Mattis, I., Linné, H., and Ansmann,
Wandinger, U., Lim, J.-H., Ahn, J. Y., Stachlewska, I. S., A.: The automated multiwavelength Raman polarization and
Amiridis, V., Marinou, E., Seifert, P., Hofer, J., Skupin, A., water-vapor lidar PollyXT: the neXT generation, Atmos. Meas.
Schneider, F., Bohlmann, S., Foth, A., Bley, S., Pfüller, A., Gian- Tech., 9, 1767–1784, https://doi.org/10.5194/amt-9-1767-2016,
nakaki, E., Lihavainen, H., Viisanen, Y., Hooda, R. K., Pereira, 2016.
S. N., Bortoli, D., Wagner, F., Mattis, I., Janicka, L., Markowicz, Engelmann, R., Ansmann, A., Ohneiser, K., Griesche, H., Radenz,
K. M., Achtert, P., Artaxo, P., Pauliquevis, T., Souza, R. A. F., M., Hofer, J., Althausen, D., Dahlke, S., Maturilli, M.,
Sharma, V. P., van Zyl, P. G., Beukes, J. P., Sun, J., Rohwer, E. Veselovskii, I., Jimenez, C., Wiesen, R., Baars, H., Bühl, J.,
G., Deng, R., Mamouri, R.-E., and Zamorano, F.: An overview of Gebauer, H., Haarig, M., Seifert, P., Wandinger, U., and Macke,
the first decade of PollyNET: an emerging network of automated A.: Wildfire smoke, Arctic haze, and aerosol effects on mixed-
Raman-polarization lidars for continuous aerosol profiling, At- phase and cirrus clouds over the North Pole region during MO-
mos. Chem. Phys., 16, 5111–5137, https://doi.org/10.5194/acp- SAiC: an introduction, Atmos. Chem. Phys., 21, 13397–13423,
16-5111-2016, 2016. https://doi.org/10.5194/acp-21-13397-2021, 2021.
Baars, H., Seifert, P., Engelmann, R., and Wandinger, U.: Freudenthaler, V.: About the effects of polarising optics on lidar
Target categorization of aerosol and clouds by continu- signals and the 190 calibration, Atmos. Meas. Tech., 9, 4181–
ous multiwavelength-polarization lidar measurements, Atmos. 4255, https://doi.org/10.5194/amt-9-4181-2016, 2016.
Meas. Tech., 10, 3175–3201, https://doi.org/10.5194/amt-10- Freudenthaler, V., Esselborn, M., Wiegner, M., Heese, B., Tesche,
3175-2017, 2017. M., Ansmann, A., Müller, D., Althausen, D., Wirth, M., Fix, A.,
Burton, S. P., Ferrare, R. A., Hostetler, C. A., Hair, J. W., Rogers, R. Ehret, G., Knippertz, P., Toledano, C., Gasteiger, J., Garham-
R., Obland, M. D., Butler, C. F., Cook, A. L., Harper, D. B., and
Atmos. Chem. Phys., 22, 355–369, 2022 https://doi.org/10.5194/acp-22-355-2022You can also read


