Clusters of hairpins induce intrinsic transcription termination in bacteria
←
→
Page content transcription
If your browser does not render page correctly, please read the page content below
www.nature.com/scientificreports
OPEN Clusters of hairpins induce
intrinsic transcription termination
in bacteria
Swati Gupta & Debnath Pal*
Intrinsic transcription termination (ITT) sites are currently identified by locating single and double-
adjacent RNA hairpins downstream of the stop codon. ITTs for a limited number of genes/operons
in only a few bacterial genomes are currently known. This lack of coverage is a lacuna in the existing
ITT inference methods. We have studied the inter-operon regions of 13 genomes covering all major
phyla in bacteria, for which good quality public RNA-seq data exist. We identify ITT sites in 87% of
cases by predicting hairpin(s) and validate against 81% of cases for which the RNA-seq derived sites
could be calculated. We identify 72% of these sites correctly, with 98% of them located ≤ 80 bases
downstream of the stop codon. The predicted hairpins form a cluster (when present < 15 bases) in
two-thirds of the cases, the remaining being single hairpins. The largest number of clusters is formed
by two hairpins, and the occurrence decreases exponentially with an increasing number of hairpins
in the cluster. Our study reveals that hairpins form an effective ITT unit when they act in concert in a
cluster. Their pervasiveness along with single hairpin terminators corroborates a wider utilization of
ITT mechanisms for transcription control across bacteria.
Transcription is the first step of decoding genomic information and is initiated post recruitment of the RNA
polymerase (RNAP) at the DNA start site1,2. It is continued through the elongation and termination steps that
are tightly regulated. Any obstruction of transcription could be a pause, but a pause followed by the dismantling
of the transcription complex causes transcription termination3. The cause of termination could be intrinsic4 or
extrinsic5. Although many facets of the intrinsic transcription termination (ITT) driven by product mRNA are
understood6, the common determinants required for such mechanisms to operate across bacterial organisms
remain unclear.
During ITT, RNAP translocation on DNA is stalled by the product mRNA synthesized due to hairpin(s)
formed from GC rich inverted repeat sequence stabilized by more number of hydrogen b onds7,8. Poly U tract,
located immediately after the end of a hairpin, drive detachment of the RNA-polymerase from mRNA-genome
complex9–11. Strong mRNA hairpins can also allosterically alter the RNAP structure to cause I TT12. Several
algorithms, such as by Carafa et al.13, Brendel et al.14, or software like TransTerm15, RNAMotif16, and R NIE17 try
to capture these genomic features to detect termination-capable hairpins. However, bacterial genome sequence
analysis has shown the intergenic continuous poly U tract (in nascent RNA) to be infrequently present down-
stream of the stop codon. The 26,000 best candidate hairpins observed immediately downstream of the stop
codon across 1060 bacterial species did not have any U stretch in ~ 50% cases18.
By our analysis and others19–21, it was observed by computational as well as in vivo methods that poly U trail
is not necessary for ITT. In M. tuberculosis, nearly 90% of such terminator structures are found either without a
U trail or with a mixed U/A trail, unlike the trends in E. coli where many studies claim the importance of down-
stream U trail. Other organisms with such findings include Streptomyces, H. pylori22–24. Even some genes in E.
coli show that termination efficiency only reduces slightly when the poly U trail is r educed25,26.
Other features in sequences downstream of the stop codon also affect termination efficiency along with stem-
loop and poly U segment downstream of the hairpin stem. This includes two G/C base pairs in the U-rich tract,
an elemental pause sequence, or conserved sequences like TCTG downstream of hairpin27,28. A summary of the
pertinent literature is given in Supplementary Table S1.
The RNA hairpins thus far identified as transcription terminators have been classified in a bid to under-
stand their secondary structure and f unction18. Classification labels such as I- and L-shape have been given to
single hairpins where L shape hairpins are I hairpins extended by a poly-U trail. When consecutive I hairpins
are separated by a short RNA sequence, they are classified as U-, or V-shaped when there is no separation, and
Department of Computational and Data Sciences, Indian Institute of Science, Bangalore, Karnataka 560012, India.
*
email: dpal@iisc.ac.in
Scientific Reports | (2021) 11:16194 | https://doi.org/10.1038/s41598-021-95435-3 1
Vol.:(0123456789)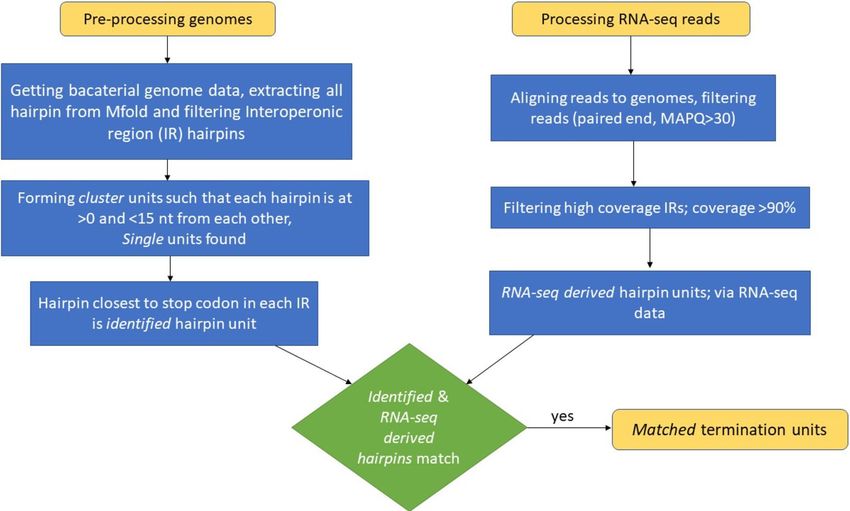
www.nature.com/scientificreports/
Organism name Bacterial phyla GC% NCBI ID RNA-seq ID
A Staphylococcus aureus Newman 32.9 NC 009641 ERR1337989-91
Firmicutes
B Clostridium phytofermentans 35.4 NC 010001 ERR1709598
C Myobacterium gilvum 67.9 NC 009338 SRR748310
Actinobacteria
D Bifidobacterium pseudocatenulatum 56.4 AP012330 ERR2789029-30
E Treponema denticola 37.9 NC 002967 ERR2177101-02
Spirochaetes
F Leptospira interrogans 34.9 LT962963 SRR3222245-46, 49
G Fusobacterium nucleatum Fusobacteria 27.2 NC 003454 ERR2177097
H Nostoc punctiforme 41.4 NC 010628 SRR5197990
I Prochloroccus. marinus Cyanobacteria 50.7 NC 005071 ERR2137696-98
J Nodularia spumigena 41.3 CP020114 SRR5801900-01
K Pseudomonas aeruginosa 66.6 NC 002516 SRR4237919-20
L Syntrophus aciditrophicus Proteobacteria 51.5 NC 007759 SRR3944268
M Klebsiella pneumoniae 57.45 CP011985 SRR3018810,12
Table 1. Organism list used in our study. List of phyla and organisms used for validation of our method.
X-shaped when coded by the opposite DNA strands. U-, V-shaped hairpins are less frequent with only 10%
and 15% cases found in M. tuberculosis and E. coli, respectively21, although they are deemed equally effective
as the I or L-shaped hairpins29. A survey on 1060 genomes found only about one-third of the genes to have a
hairpin downstream of the stop codon, and of these, 86% I/L-shaped and the remaining U/X/V-shaped (9%/
5%/0.1% occurrence, respectively) made up the whole composition18. How the remaining two-third of genes are
accomplishing transcription termination is the key question to be answered. If these happen through extrinsic
termination mechanisms, proteins like the Rho and NusA need to be commonly overexpressed or condition-
ally overexpressed relative to RNAP. The published literature does not document such facts, especially when
the hexameric form of the Rho protein is known to be required for fruitful transcription termination (further
details in “Discussion”).
In this paper, we attempt to understand how the remaining two-third of operons in microbial genomes are
accomplishing their transcription termination. We propose a cluster of hairpins to fill this gap. The clusters are
defined as a set of short contiguous hairpins located within < 15 bases of each other and the others as single. By
short hairpin, we refer to hairpins with a stem length of 2–10 base pairs. Hairpins with stem lengths larger than
this are long hairpins. Each such cluster is hypothesized to stall the RNAP to drive a successful ITT. The presence
of a poly U trail is not essential for successful termination. We validate our paradigm using 13 genomes from
diverse bacterial phyla. We can correctly identify that around three-fourths of all microbial operons/single genes
have ITT sites without a bias towards the GC base composition.
Results
We look for the presence of an ITT site in the 13 bacterial genomes (Table 1). Using the Interoperonic Region
(IR; Fig. 1a) as the scan window, we individually identify a hairpin in either cluster or single, with the presence/
absence of poly U/A stretch. IR is defined as the region between the 3′ end of the last coding gene and the 5′ end
of the first gene of the next operon. In the beginning, we identify 31,078 IRs in our dataset almost equally divided
between the forward and the reverse strand (Table S2). Our data set includes both GC and AT rich genomes with
the largest number (5065) of IRs from Nostoc punctiforme PCC 73102 and least from Fusobacterium nucleatum
ATCC 25586 (885). On imposing the high confidence criterion of > 90% read coverage in an IR, we obtain 16,027
IRs (i.e., 52% of the starting data set). On further removing the IRs with outlier (5% tail of coverage-data) read
depth, we obtained 14,738 IRs. Nostoc punctiforme PCC 73102 and Fusobacterium nucleatum ATCC 25586 have
the lowest and the highest number of genes per operon, respectively (Table S3). We found the RNA-seq derived
transcription termination site using a positive slope region of read depths (Fig. 1b) in 97% IRs; i.e., in 14,269
cases. Herein it is essentially the first region after the stop codon where there is a continuous increase in read
frequency after a saddle point. This region is believed to indicate the terminal segment of the transcription unit.
For 11,914 IRs (excluding Zone 3 cases; see “Methods”), we predicted hairpin(s) as well as a positive slope region
(pos; see “Methods”), and thus these cases were used for validating our results. All alphabetical labels in diagrams
and tables corresponding to the genomes are as per the list in Table 1.
Zonal demarcation of RNA‑seq derived termination regions. The zones of an IR are defined once
the termination site is derived from the RNA-seq data using a positive slope region of read depths (see “Meth-
ods”). Zone 1: from the stop codon to the start of the positive slope region; Zone 2: from the start of the positive
slope region to the end of the positive slope region; Zone 3: from the end of the positive slope region to the end
of the IR. The demarcations are shown in Fig. 1c. They allow us to indicate the putative region where the tran-
scription unit ends. Zone 1 is the end of the transcription unit; Zone 2 is the buffer region of the transcription
end; Zone 3 is the likely beginning region for the next gene. In rare cases, the ITT may spill over to the initial
region of Zone 3, but not further. The reason we call Zone 2 as the buffer region is that it straddles the entire
positive slope region, which means that there is an increase of read occurrence in this region, indicating that
ITT events are not anchored to a single fixed site in the genome, but span a broader region. The mean length in
Scientific Reports | (2021) 11:16194 | https://doi.org/10.1038/s41598-021-95435-3 2
Vol:.(1234567890)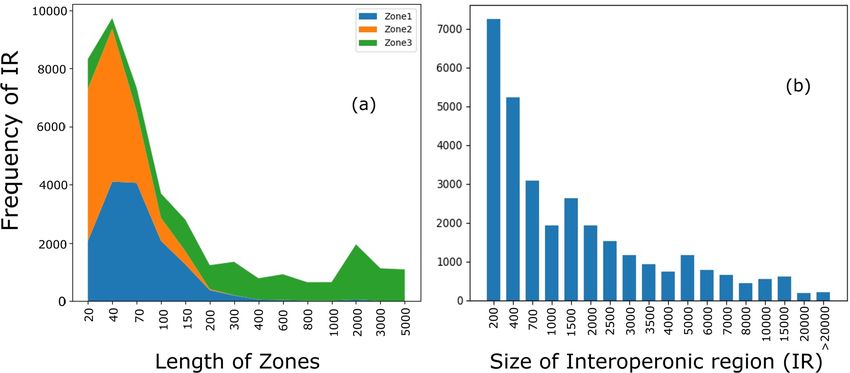
www.nature.com/scientificreports/
Figure 1. Defining IR and the positive slope region for screening a termination site. (a) A plot showing the
cumulative distribution of the reads in and around an IR in S. aureus Newman, NCBI ID: NC_009641, RNA-seq
ID: ERR1337989 for operon: [3686,9675,10900], where 3686–9675 is the coding region and 9675–10,900 is the
IR marked by red lines. The blue curve shows the cumulative frequency of RNA-seq reads at each position in
the above-mentioned operon. The numbers on the x-axis represent the actual genome coordinates. (b) The IR
region for operon where slopes have been calculated from cumulative frequency values in a) using a window
of 10 bases. A region of positive slope implies an increase in reads frequency after the previous drop. Red lines
approximately mark the start and end of the IR ( IRstart and IRend). The green lines mark the start and end of the
first positive slope region (posst and posend, respectively) of the curve, indicating the end of transcription should
be before this first read-increase region. (c) The inset around the transcription termination region is shown
schematically divided into three zones; Zone 1: stop codon to start of the positive slope region; Zone 2: start of
the positive slope region to end of the positive slope region; Zone 3: end of the positive slope region to the end
of the IR.
bases of Zones 1, 2, and 3 segmenting the IRs is found to be 62(± 17), 38(± 4), and 1617(± 194), respectively. The
distribution for zone lengths across all genomes studied has been shown in Fig. 2a and Table S4. The average
length of the Zones is determined by the average p osst, posend, and length of the IRs in each genome. P
osst is the
start of the positive slope region, which marks the region of approximate constant RNA-seq read frequency in
IR relative to the coding region. Posend marks its end. These positions are shown with green lines in Fig. 1. Out
of 14,269 IRs where a positive slope region was found, 43% IRs have Zone 1 length less than 40 bases, another
43% within 100 bases, followed by 11% between 100 and 200 bases and extending up to as long as 1600 bases in
the remaining 3% cases. The distribution of IR lengths can be found in Fig. 2b. A short Zone 1 indicates early
termination, and an overwhelming 86% of cases terminate within 100 bases as per the RNA-seq data. About 96%
of the Zone 2 lengths are less than 100 bases, with approximately 74% within 40 bases. In contrast, only 35%
of Zone 3 lengths fall within 200 bases and 84% within 3000 bases, with 16% with even higher lengths. Short
(< 100) Zone 2 lengths may indicate a tight buffer region for ITT, cognizant of the fact that the estimates may
vary due to the window size for calculation chosen (see “Methods”). Long Zone 3 lengths suggest their suitability
as sites for transcription initiation for the adjacent transcription unit.
Hairpin prediction. As already outlined before, we term a group of hairpins such that the distance between
the end of one hairpin and the start of the next hairpin is always < 15 nucleotides as a cluster, and others as single.
A total of 677,943 stable hairpins is predicted for 87% of 14,738 IRs in our data set. The predicted hairpins form
131,610 cluster-hairpin (cluster) units giving an average of about 5 hairpins per cluster. The remaining 25,696
hairpins do not form any cluster and are deemed as single-hairpin (single) units. The number of hairpins is not
proportional to the number of IRs, and the highest is predicted for Mycobacterium gilvum (at 161 hairpins / IR)
followed by Pseudomonas aeruginosa (129 hairpins / IR). In comparison, the lowest is found in Fusobacteruim
nucleatum with 15 hairpins / IR. The number of hairpins per IR (hairpin density) is a consequence of the GC
percent of the IRs; the correlation coefficient is 0.8, which is expected due to the dominant contribution of GC
hydrogen bonds to stem-stability in hairpins.
Scientific Reports | (2021) 11:16194 | https://doi.org/10.1038/s41598-021-95435-3 3
Vol.:(0123456789)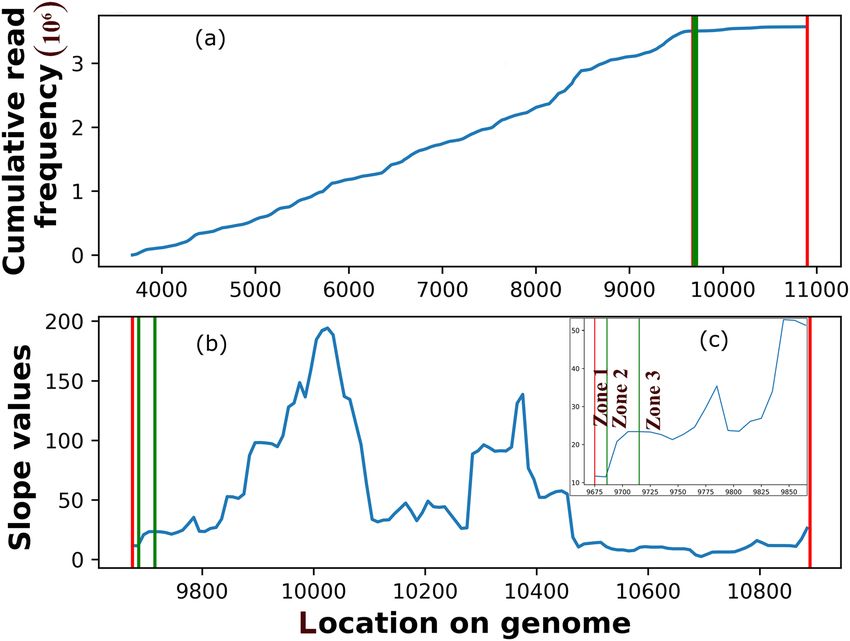
www.nature.com/scientificreports/
Figure 2. Distribution of Zone and IR lengths. Stacked line plot (a) showing the distribution of zone lengths
for all genomes analyzed. The total number of IRs for which these zones have been calculated for each organism
A–M as in Table 1 is as follows: 671, 991, 1135, 364, 455, 1090, 293, 1196, 646, 1491, 1378, 773, 631. (b) The
distribution of IR sizes across all bacterial genomes studied. Note the difference in the Zone lengths and the IR
lengths.
Identified termination units. The cluster or single unit nearest to the stop codon is termed the identified
termination unit since it is expected to provide the most efficient termination. It would also kinetically be the
first hairpin to form and disrupt RNAP movement. A total of 12,787 termination sites (in 87% IRs) are identified
closest to the stop codon, of which 7394 and 5393 could be linked to cluster- and single-hairpin units, respec-
tively. The total number of hairpins in identified clusters is 22,519, with an average of 3 hairpins per cluster. We
also calculated the identified termination units for rRNA (Supplementary Fig. S1) and tRNA genes (Fig. S2), but
the focus in this work is only on protein-coding genes.
Stem and loop characteristics. About 84% of all identified hairpins have 4–10 stem lengths, while 81%
have 5–8 loop lengths. The < 14 bases and < 13 bases corresponding to one strand of the stem and loop length,
respectively, covers > 90% of the identified hairpins. The mode of the distribution is contributed by 25% of cases
having 4–8 stem and 6 loop lengths. The minimum stem and loop lengths are 4 and 5 bases, respectively. Over-
all, the loop length distribution of the hairpins in a cluster and single are almost identical, but the stem length
distribution differs. For cluster units, 84% of the cases have a stem length of ≤ 10 bases; whereas, for single, this is
79%. The stem length of 10–20 occurs 5% more in single than cluster units. While these differences are not that
large, it perhaps indicates a functional requirement for ITT. We also see that shorter stem hairpins are present at
initial positions in a cluster (Fig. S3).
Hairpins are found close to the stop codon. We found 66(± 10)% and 58(± 11)% of the identified clus-
ter and single units to be located ≤ 20 bases from the stop codon in all IRs (Fig. 3); for a window size of ≤ 50 bases,
these numbers increase to 89(± 6)% and 92(± 3)%. Further extending the window (≤ 80) covers > 97(± 2)% of
both identified clusters and single units in all organisms. Only < 2% termination units are present further up to
150 bases, and a negligible fraction beyond. A comparison of the total number of IRs for each genome indicates
that, in general, a larger number of IRs has cluster units lying nearest to the stop codon than the single units
(Table S5). Table 2 shows that in most organisms, the number of identified cluster units is greater than identified
single units, but when this is not the case, the difference between their positions is not too large. This is not true
in cases of identified single units that have a higher frequency, where we see a larger difference in distances. There
is a 0.74 correlation of this difference with the GC content of the bacterial genomes analyzed. This value shows
how strongly the GC content is correlated to favoring the cluster over single hairpin units. It can be inferred that
a genome with high GC content is bound to have a higher number of the cluster as compared to single hairpin
units.
Locating the RNA‑seq derived termination units. The cluster or single units that are closest to p osst
are termed as RNA-seq derived hairpins. The distribution of cluster or single termination units in the forward
and reverse strand and their zonal location is shown in Table 3. It is observed that the maximum number of
termination units lies in Zone 1, followed by Zone 2 and a few in Zone 3 (data not shown for Zone 3). Of the
11,914 IRs for which RNA-seq derived termination units were found, 75% lay in Zone 1 and the remaining 25%
in the buffer Zone 2.
Figure 4 shows the IRs where the hairpins are found within window size ’n’ from the p osst with ’n’ ranging from
0 to 75 bases. n is calculated as the shortest distance from the hairpin base, and therefore it is the last hairpin in
the cluster unit for Zone 1 and the first hairpin for Zone 2. Figure 4c,d shows the calculation of the shortest dis-
tance in both Zone 1 and Zone 2. On average, 82% of hairpins in IRs where pos was detected, lie within 75 bases
Scientific Reports | (2021) 11:16194 | https://doi.org/10.1038/s41598-021-95435-3 4
Vol:.(1234567890)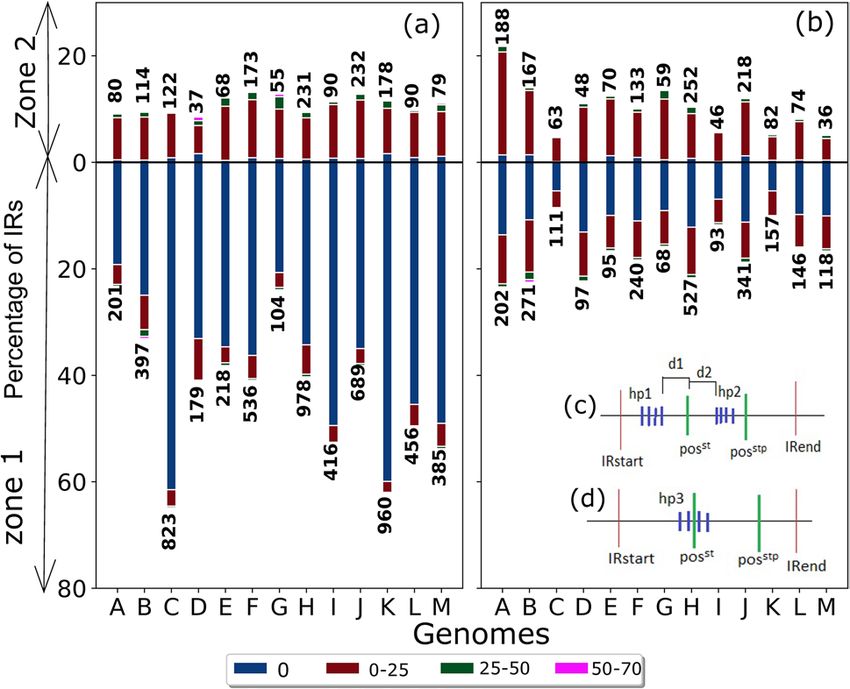
www.nature.com/scientificreports/
Figure 3. Distance of identified hairpins from stop codon. Plots show the percentage of transcription units with
identified hairpins (y-axis) at a given distance from the stop codon (x-axis) in (a) cluster hairpin and (b) single
hairpin. The organisms A–M are labeled as in Table 1.
Organism Identified Cluster Single
S. aureus Newman 719 264 455
C. phytofermentans ISDg 1076 476 600
M. gilvum PYR-GCK 1187 880 307
B. pseudocatenulatum DSM 20,438 399 214 185
T. denticola ATCC 35,405 503 277 226
L. interrogans Manilae L495 1162 656 506
F. nucleatum ATCC 25,586 335 151 184
N. punctiforme PCC 73,102 2124 1115 1009
P. marinus MIT 9313 685 463 222
N. spumigena UHCC 0039 1621 876 745
P. aeruginosa PAO1 1439 1052 387
S. aciditrophicus SB 816 509 307
K. pneumoniae UHKPC07 721 461 260
Table 2. Identified termination units.
(± Strand) hairpin Zone 1 Zone 2 Total
(+ Strand) Cluster 3194 774 3968
(+ Strand) Single 1262 679 1941
(- Strand) Cluster 3221 779 4000
(- Strand) Single 1245 760 2005
Table 3. RNA-seq derived termination units. RNA-seq derived termination units (excluding Zone 3) and their
strand-wise zonal classification for each genome.
of the p osst. Of these, in 50(± 11)% cases, the posst is with n = 0; i.e., it coincides with the hairpin start. There is a
gradual decrease of cases by distance with 29(± 6)%, 3(± 1)%, and 0.4% of the termination sites lying within 25,
25–50, and 50–75 bases of p osst. 13(± 1)%, 1(± 1)%, 0.3% of cluster units lie within 25, 25–50, and 50–75 bases,
respectively. The corresponding values for single are 16(± 6)%, 1%, and 0.2%. Of the RNA-seq derived termina-
tion units, 67%, and 33% are from the cluster and single, respectively; therefore, higher occurrence of the former
points to their utility in bacterial ITT.
More than 70% of transcription units have Zone 1 lengths ≤ 70, with a maximum of around 200 (Fig. S4).
This means that the most calculated posst lies close to the stop codon, which indicates an early termination and
correct estimate of the pos and the predicted hairpin. The Zone 2 lengths are largely restricted within 100 bases
for all IRs (Fig. S5).
Scientific Reports | (2021) 11:16194 | https://doi.org/10.1038/s41598-021-95435-3 5
Vol.:(0123456789)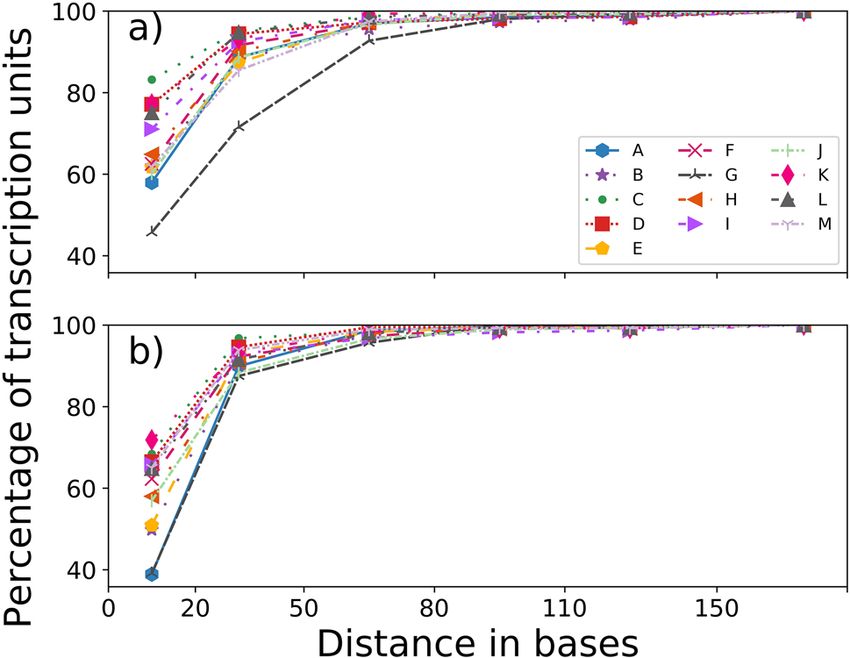
www.nature.com/scientificreports/
Figure 4. Zonal distance distribution of RNA-seq derived cluster and single hairpin units. Bars show the
distribution of RNA-seq derived hairpin units with respect to distance from p osst for the cluster (a) and single
(b) units as per in zone location. The different window sizes (represented by different colors) show the different
distances from p osst and their corresponding percentages on the y-axis. The total IRs from which percentage
has been calculated for each of the genomes A–M on the x-axis are given on top of each bar for Zone 2 and at
bottom of each bar for Zone 1. The x-axis labels show the 13 analyzed genomes, as indicated in Table 1. The total
number of hairpins contributing to each bar is shown on the top/bottom of each bar. There are 111 transcription
units where the hairpin is located > 75 bases from the p osst; these are not shown in the plot. (c) For shortest
distance calculation, if hairpin (hp) is in Zone 1 (between IR start and p osst), then n is calculated as the distance
between the last hairpin in cluster unit (last blue line in hp1 cluster) to p osst. So d1 in the image is ‘n’ for zone 1
hairpins. If hairpin in Zone 2 (between p osst and posstp), then n is calculated as the distance between posst and
the first hairpin of cluster unit (first blue line in hp2 cluster). So d2 in the image is ‘n’ for Zone 2 hairpins. (d) The
cluster hairpin hp3 lies in Zone 1 and Zone 2. In such a case, we assign n = 0.
Energy score is the value obtained by MFold prediction (see “Methods”) that gives an estimate of the RNA
secondary structure stability. This value can be used to compare the relative stability of hairpins. Looking at
the energy score distribution of RNA-seq derived hairpin units covering Zone 1 and 2, we find that both zones
together has 56(± 8)% hairpin units with energy scores between 0 and − 5 kcal/mole, 36(± 6)% between 5 and
0 kcal/mol and 7(± 2)% between − 5 and − 10 kcal/mol. A minuscule 1% fraction of hairpins has an energy score
lower than − 10 kcal/mol (Fig. S6). All hairpins with 5–0 kcal/mol scores are also structurally stable, as confirmed
from three-dimensional structure modeling studies (see “Methods”). The distribution of the energy scores across
the two Zones is similar, except that Zone 1 tends to have a marginally greater proportion of lower energy scores.
Only T. denticola, P. aeruginosa, and K. pneumoniae tend to have hairpin energy scores < −10 kcal/mol.
Co‑locating identified and RNA‑seq derived termination units. An ITT site is expected to be close
to the posst location. Since RNA-seq derived termination units are closest to posst and identified units are closest
to the stop codon, we attempt to find co-locating hairpins between these two categories to validate an ITT. The
co-located termination units are called the matched termination units. Identified and RNA-seq derived hairpin
units occur in 87% and 81% of IRs, respectively, in the 13 bacteria studied (Table 4). For 11,914 IRs, where
both identified and RNA-seq derived hairpin units are present, 72% occur at the same position (hairpins fully
overlapped or partially overlapped). Not all organisms have a similar fraction of identified and RNA-seq derived
hairpins found at the same location, with the best predictions for P. marinus at 83% and worst for C. phytofer-
mentans at 46%. If we look at the distance of the matched termination units from the stop codon, 67(± 10)% of
the cluster- and 57(± 11)% of single are within 20 bases (Fig. S7); correspondingly 90(± 6)% and 92(± 3)% within
50 bases, and < 1% cases located > 80 bases from the stop codon. Looking at the distance from p osst, 96% lie
within 25 bases, of which 65% termination units embed the p osst location (Fig. 5). Most importantly, 69% of the
matched cases are from the cluster, while only 31% are single termination units. This corroborates the central role
of the cluster units as the intrinsic terminators. Interestingly, 78% (57% cluster, 21% single) of the matched cases
occur in Zone 1 compared to 22% (11% cluster, 11% single) in Zone 2. For remaining IRs, where identified and
RNA-seq derived hairpin units did not match, 70% are within 60 bases of each other (Fig. S8). The two-hairpin
termination units are the most prevalent cases, and their occurrence exponentially decreases with the increasing
size of the cluster (Fig. 6). Interestingly, when large identified clusters extending beyond 100 bases are matched
through large overlaps with RNA-seq derived cluster units, they highlight the importance of cluster hairpins in
ITT (Fig. S9).
For matched termination units, the average stem length is 8 bp for single and 7.4 bp for cluster units, while
the average loop length is 3.7 for single and 3.4 for cluster units (Fig. 7). Mode for stem length is 3 bp in single
Scientific Reports | (2021) 11:16194 | https://doi.org/10.1038/s41598-021-95435-3 6
Vol:.(1234567890)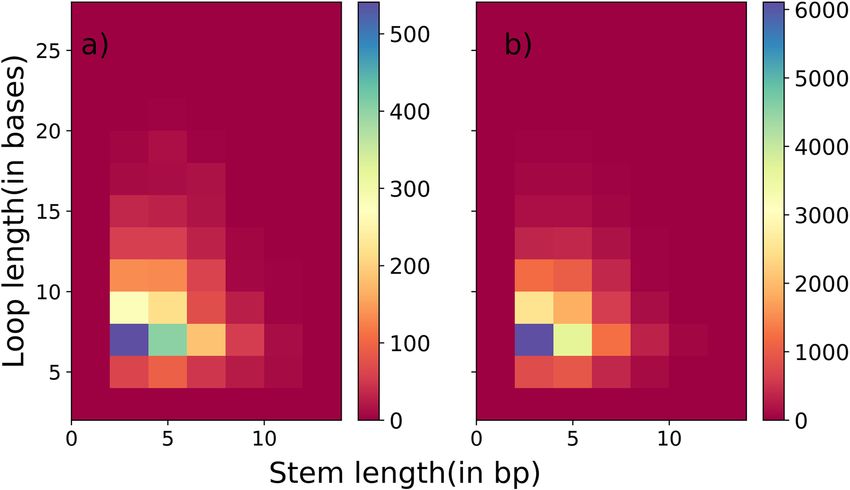
www.nature.com/scientificreports/
Number of I Rs# Transcription termination site matching
RNA-seq % correct
Genomes Filtered Identified derived Ahead* Part-match Full-match (Matched)
Staphylococcus aureus Newman 870 719 671 210 72 389 69
Clostridium phytofermentans 1259 1076 991 530 107 354 47
Myobacterium gilvum 1308 1187 1135 263 357 515 77
Bifidobacterium pseudocatenu-
468 399 364 120 69 175 67
latum
Treponema denticola 612 503 455 112 95 248 75
Leptospira interrogans 1338 1162 1090 285 220 585 74
Fusobacterium nucleatum 455 335 293 98 40 155 67
Nostoc punctiforme 2464 2124 1996 545 398 1053 73
Prochloroccus. marinus 803 685 646 108 172 366 83
Nodularia spumigena 1843 1621 1491 397 277 817 73
Pseudomonas aeruginosa 1585 1439 1378 329 409 640 76
Syntrophus aciditrophicus 955 816 773 161 221 391 79
Klebsiella pneumoniae 778 721 631 207 132 292 67
Σ 14,738 12,787 11,914 3365 2569 5980 72
Table 4. Statistics showing the number of IRs matched with the RNA-seq data. # Filtered IR refers to those
obtained after applying RNA-seq coverage and outlier-based filtering criteria; Identified IR refer to those where
hairpins have been predicted by MFold program and lie closest to stop codon; RNA-seq derived IRs refer to
osst. *identified site is nearer to
those with hairpin located at the site in Zone 1 or Zone 2 and lie closest to p
stop codon than RNA-seq derived site.
Figure 5. Matched termination units vs distance from p osst. Bar graph showing the percentage of matched
termination units located within a given distance of the detected positive slope region. The number of cases in
each bin is given on top of the bar. (a) Cluster termination units, (b) Single termination units. Five termination
units located > 75 bases from posst, are excluded from the plot.
as well as cluster units, while for loop length it is 6 bases for both single and cluster units. The data indicates the
predominant presence of short hairpins, which are kinetically faster to form. However, the length distribution
of both stem and loop is right-skewed.
The RNA-seq derived site may not necessarily be at the same position as the first identified hairpin predicted
by us but may match with other putative downstream termination sites. To check the same, we looked at alternate
termination sites predicted by our algorithm for each operon. These are hairpins that are not the first occurring
from stop codon but are identified as putative termination sites by the same slope finding method (see “Meth-
ods”). On taking all such predictions and matching the RNA-seq derived termination sites, we get a match of
97% cases overall (Table S6).
Equal efficiency of hairpin identification in AT and GC rich genomes. Of the 13 genomes in our
data set, we found six genomes to be GC rich with > 50% GC pairs. The number of hairpins and the RNA-seq
Scientific Reports | (2021) 11:16194 | https://doi.org/10.1038/s41598-021-95435-3 7
Vol.:(0123456789)
www.nature.com/scientificreports/

                                            Figure 6.  Size of clusters. The bar graph shows the frequency of hairpin cluster occurrence for different sizes
                                            of the clusters. The data shown here represents all matched termination units covering the 13 bacterial species
                                            studied.

                                            Figure 7.  Plot showing the distribution of stem lengths (x-axis) and loop lengths for matched termination units
                                            in (a) single units (b) cluster units.

                                            derived GC content are poorly correlated, except when the number of hairpins increases to 9–16 per cluster. The
                                            observation points to local variation in the GC content of the IRs. Our method identifies hairpin units equally
                                            efficiently in GC as well as AT rich genomes. When the identified/RNA-seq derived hairpins are found co-located,
                                            they should be independent of the GC content, as evidenced by a low 0.22 correlation coefficient between the
                                            fraction of co-located units and the GC content of the GC-rich genomes. Likewise, the occurrence likelihood of
                                            stable hairpin decreases in AT-rich genomes. Therefore an equal efficiency in finding co-located units and the
                                            GC content in them is reflected from a higher 0.6 correlation value. We see that the GC % and occurrence of U
                                            trail are anti-correlated with a value of − 0.9. This is as expected because GC + A(U/T) content must add up to
                                            100%.

                                            Presence of poly A/U trails is not necessary in genomes. We decided to look at the occurrence of
                                            poly U trail at the ends of identified termination units using the transcribed DNA information. Of the 13 diverse
                                            bacterial genomes scanned for A/U patterns, the existing patterns are rarely co-located at the base of the RNA-
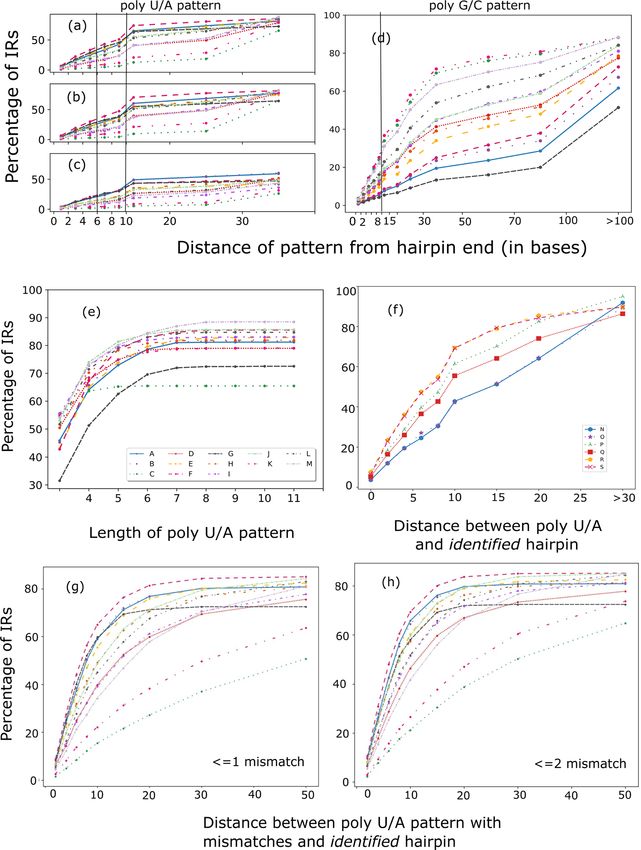
                                            seq derived and identified hairpins (Fig. 8a–c, Table S7). The genomes show only 4% poly A/U patterns (at least
                                            three consecutive U/A) located within the first two bases of the identified hairpin; 12% within 4 bases, and 31%
                                            within 10 bases from the identified hairpin. Corresponding values for RNA-seq derived hairpins are 4%, 11%, and
                                            29%. Only 4 genomes show > 40% poly A/U patterns within 10 bases of the hairpin. We see that the poly G/C

          Scientific Reports |   (2021) 11:16194 |               https://doi.org/10.1038/s41598-021-95435-3                                                    8

Vol:.(1234567890)
www.nature.com/scientificreports/
Figure 8. Line plots showing trends of poly U/A and G/C pattern occurrence in IRs. (a–c) Plots show the
distribution of poly A/U patterns at a given distance between the hairpin end, where the first occurring poly
U/A pattern has been considered. (a) depicts the statistics for all IRs where we have identified hairpins, (b)
cluster + single RNA-seq derived hairpin units, (c) single RNA-seq derived hairpin units. Plot (d) shows the
distance between identified hairpin units and the first occurring poly G/C pattern. Vertical lines at distances 6,
10 in (a–c), and only 10 in (d) are drawn to highlight the low occurrence of patterns close to the hairpin end.
Plot (e) shows the lengths of the first A/U patterns in all IRs. The different colors from (a–e) and in (g), (h) are
the 13 bacterial genomes analyzed and follow the same order as in Table 1 and shown in legend with the plot (e).
Plot (f) shows the distance between the hairpin and the first occurring pattern after them for identified hairpin
units where genomes are N: Escherichia coli K-12 substr MG1655, O: Escherichia coli O127-H6 str. E2348, P:
Bacillus subtilis subsp. subtilis delta6, Q: Bacillus subtilis subsp. subtilis N3-1, R: Helicobacter pylori PeCan4, S:
Helicobacter pylori Lithuania75. Plots (g) and (h) show the same statistics as (a) where the poly A/U patterns
have ≤ 1 or ≤ 2 mismatches, respectively.
pattern is also not present downstream of hairpins (Fig. 8d). We could find only 18% operons with downstream
C/G pattern even at 15 bases from the hairpin end.
Scientific Reports | (2021) 11:16194 | https://doi.org/10.1038/s41598-021-95435-3 9
Vol.:(0123456789)www.nature.com/scientificreports/
We additionally analyzed the well-studied E. coli, B. subtilis, and H. pylori genomes to check the occurrence of
poly U patterns for all operons. We see that these organisms too follow the same trends as all other 13 genomes
analyzed above. Even for E. coli, poly U trends were similar to other genomes in most operons (Fig. 8e).
We found that all organisms except T. denticola, L. interrogans, F. nucleatum had patterns of length 3 in 45%
or more IRs with a total average of 49% (Fig. 8f). The larger > 6 poly A/U patterns are spread in 2% of all IRs,
with about 20% IRs having no poly A/U pattern at all.
When allowing mismatches in the poly U/A pattern, as expected, the percentage of IRs with a poly U/A pat-
tern at distances < 4 nucleotides from the identified hairpin end, increases from 12% for only perfect matches,
to 18% with ≤ 1 mismatch and 21% with ≤ 2 mismatch, which is still low. For patterns at < 10 nucleotides from
the identified hairpin end, the numbers change from 31% in perfect match to 45% with ≤ 1 mismatch and 52%
with ≤ 2 mismatches (Fig. 8g,h). But this increase is organism-specific. With ≤ 2 mismatches, only 5 out of 13
organisms have at least 50% operons where a pattern was found within 8 bases from the identified hairpin end. So,
it can be said that the poly U/A pattern is a feature that is used only by some organisms for ITT in an enhanced
manner. To understand this trend, it is required to run this analysis on a larger dataset. But it can be seen clearly
that poly U is not a necessary trait in the ITT mechanism for all bacteria.
Comparison with in vitro screened experimental termination sites. A list of 143 experimental
termination sites cumulated by Carafa et al.13 and tested in vitro for ITT activity was used to match our results.
BLAST software (https://blast.ncbi.nlm.nih.gov) was used to search the sequences for their corresponding map-
ping regions in E. coli K-12 MG1655 (NCBI ID: NC_000913/U_00096) for which we also calculated the iden-
tified hairpins by our algorithm. It may be noted that Carafa et al. used a list of literature-identified hairpins
that have poly U stretch with a strong bias of U to be present in the first two positions from the 3′ end of the
hairpin. Also, these hairpins must have either 4 GC base pairs in the stem if no bulge or internal loop exists,
or a minimum of 6GC base pairs if otherwise. Also a liberal criterion is used whereby termination zones are
used to identify ITT location instead for of the exact location of the terminator hairpin. Yet we found only 83
of the 143 sequences to have a match in the IR region. Of these only 8 termination zones matched the identified
hairpin or alternate termination site (other putative hairpins if the first site does not terminate transcription). In
3 other cases, we found a partial match between hairpins and the termination zones. On dividing the matches
strandwise, 131 cases were found on the forward strand and remaining on the complementary strand. Of these,
in 96 cases the hairpin was present either inside the operon region in the forward strand (36 cases, see hairpin
4 in Fig. S10) or the reverse strand (60 cases, see hairpin 2′ in Fig. S10). Other hairpins (see hairpins 2 and 3,
Fig. S10) are present towards the end of the IR as opposed to our identified hairpins that lie close to the start of
the IR. GC composition analysis showed only 47 of the 96 cases were GC rich (19 of 36 in forward and 28 of 60
in reverse strand after taking sequence complement). Therefore, the imposition of minimal GC base pairing cri-
teria by Carafa et al. while selecting the hairpin sequences is not reflected in the GC composition of the hairpins
as a whole. The mode value of 3 for stem length that we have obtained in our analysis of all matched hairpins is
closer to the Carafa et al. minimal criteria, except that our hairpins also include AT-rich cases. To rationalize the
poor match between the identified hairpin and the experimentally determined termination region, we tested if
the RNA-seq derived termination sites overlap with these in vitro determined termination zones. In 8.4% of the
83 cases found in the IRs, the RNA-seq derived termination sites overlap, which is the first encountered positive
slope region from the stop codon. But if we consider other downstream positive slope regions in the IR, we see
that in 60% additional termination zones, the slope values either match to the region of RNA-seq derived site or
are of a greater value. This reveals that most of the terminations zones are present very close to the end of the
IR region, which would place them in Zone 3 as per our analysis methodology. As a result, they may be part of
the 5′ UTR regions of the next operon suggesting that these may be in reality be a pause site or an attenuator/
antiterminator30 in the in vivo situation (see hairpin 2, Fig. S10).
Discussion
In bacteria, the process of transcription and translation is concurrent31,32 only for protein-coding genes/operons.
Operating both processes in concert requires precise kinetic control of the mRNA produced and the amino acid
translated. It has been seen that terminator sequences present in the coding region are not able to terminate
transcripts. This is because the closely trailing ribosome does not allow the folding of sequences to a hairpin
structure31. It is only after the occurrence of a stop codon that decoupling takes place and hairpin sequences can
form their secondary structure to disrupt the RNAP motion.
The lack of solid evidence on the wide prevalence of ITT units across diverse organisms has, therefore, been
intriguing. The extrinsic transcription termination mechanism involves concertedly acting protein factors and
thus requires more sophisticated control than ITT. Therefore, our identification of 72% of the bacterial IRs with
an ITT unit validated by RNA-seq (i.e., matched hairpins) read profiles bridges the conjecture that bacteria
commonly prefer the ITT mechanism as their favored transcription regulation process. This inference is an
improvement over our previous observation18, where we identified approximately one-third of the IRs to have
stable hairpins based on GC-rich stem composition criteria.
For a basic ITT process to occur, the single hairpins are said to form at the rear end of the RNA exit channel6.
For a hairpin to form, the RNA needs to fold while the transcription is occurring. Although previous studies
proposed limits on hairpin lengths that can be accommodated near the RNA exit c hannel6 required for the for-
mation of a functional h airpin4,13, these have been observed only in select organisms such as in M. tuberculosis29
and not across most bacteria. Our observation suggests that a stretch of contiguous hairpins (hairpin cluster)
is as effective as a single strong hairpin to cause ITT. As such, most isolated hairpins can fold in solution within
microseconds33 and the rate is determined by the number of nucleation points in the s equence34. For example,
Scientific Reports | (2021) 11:16194 | https://doi.org/10.1038/s41598-021-95435-3 10
Vol:.(1234567890)www.nature.com/scientificreports/
in hairpin helix, A 6 C6 U6, at 24 °C the rates of formation and dissociation are 2.4 × 10⁴ s−1 and 2.6 × 10⁴ s−1,
r espectively35. Similarly, for 21 nucleotides hairpin UAUAUCGC7CGAUAUA at 37 °C, they are 1.3 × 10⁶ s−1 for
the formation and 3.2 × 10⁶ s−1 for d issociation36. In contrast, the average mRNA elongation rate in E. coli is found
to be 58 nucleotides/sec at 37 °C. Thus, the RNA folding rates are much faster compared to elongation rates as
corroborated by experimental data37. The time difference is large enough to accommodate the actual folding time
variations of a hairpin arising out of multiple factors including stem and loop sequence, neighboring bases, which
alter the rate-limiting step of folding38. Folding experiments also show a preference for alternating structures
(11 out of 14 to 40-length sequences) where there is interconversion between single and two hairpin states, the
latter being the major o ne34. When long mRNA sequences fold it was observed that short-range interactions
have higher stability over long-range reactions, and they are thus r etained39. In physiological conditions, the
number of accessible nucleation points and short-range forces are also expected to dominate the RNA folding
process. However, folded hairpins herein may face a steep transition barrier to interconversion due to concomi-
tant RNA–protein interaction; thus early formation of short hairpins forming a cluster would be preferred as
suggested by our genome analysis.
Nascent hairpin formation during transcription may be impeded by spatial constraints in the RNA exit chan-
nel; however, during ITT, hairpins are known to form outside the channel40–42, once the loop-closing base pair
is available. In in vivo situation, the RNA secondary structures may fold sequentially as the RNA gets elongated,
but they rapidly change to alternating more stable s tructures43. This reduces the chance of misfolded structure
formation, as observed in ribozyme folding studies44. However, small hairpins (like in cluster) may have similar
folding rates both in vivo and in vitro as shown by hairpin folding studies of ribozymes44. Accessory factors like
the NusA may further enhance the hairpin folding rates in vivo.
From structural studies, it is known that an RNA hairpin can pause t ranscription45 by stabilizing the RNAP
structure by virtue of its interaction with the protein complex. Therefore, a cluster unit, which presents a larger
count of shorter hairpins may further stabilize the RNAP complex by additional RNA–protein interaction, and
this is expected to be more efficient in stalling and dislodging the transcription complex than a single hairpin. This
is statistically consistent due to the higher occurrence of loop regions from shorter hairpins that can engage the
protein in both hydrogen bonding and hydrophobic interactions. In such circumstances, many short contiguous
hairpins can be more effective in RNAP pause and dismantling. It is also possible that the initial hairpins in the
cluster slow down the polymerase while the later hairpins finally cause the release21.
It is interesting to note that the presence of secondary structures that hinder the formation of terminator
hairpins reduces termination efficiency. This was shown by the application of force that suppressed the formation
of such secondary structures, which led to an increase in termination e fficiency46; therefore, our observation of
the first hairpin (or cluster of hairpins) downstream of the stop codon as the effective terminator unit is consistent
with the optimal arrangement necessary for efficient ITT. Forward translocation, another suggested mechanism
of RNAP dissociation in ITT is also consistent with our proposition. Here the hairpin formation forces the RNAP
to move downstream (relative to DNA template) while the mRNA does not move, thus breaking the DNA: RNA
hybrid bonds. Cluster hairpins are dominantly placed to promote dissociation, reducing the over-reliance on
poly U/A occurrence, which are thought to weaken the links in the DNA-RNA hybrid for easier dissociation.
The ITT, although perceived, is not entirely intrinsic to RNA, DNA, and RNAP activity alone, and is influ-
enced by accessory factors like the NusA and NusG during transcription and t ermination47,48. These factors work
by two modes during ITT, one by interacting with the RNAP and stabilizing it or interact with the emergent
RNA transcript6,42,49,50. The NusA and NusG are known to form complexes to enhance their interaction with
RNAP to increase termination efficiency; whereas, NusG alone is known to suppress transcription pause, but
not termination47. Factors like RfaH, a homolog of NusG suppresses stabilizing effects of nascent RNA h airpin51
52
and decreases termination . The interplay of accessory factors thus complicates the building of a true ITT ther-
modynamic model. Attempts for such a model two decades back have focussed primarily on understanding the
stability of the termination complex, especially the contribution of RNA–DNA base-pairing53,54.
Cluster hairpins can, however, explain simple entropy-driven processes that may achieve efficient ITT. Such
processes have been investigated in less complex systems for understanding the potential mechanisms at p lay55,56.
If we assume RNAP:DNA:RNA hybrid and the immediate solvent environment as a quasi thermodynamic system
inside the cell, the hybrid typically contributes to entropy change by its thermal fluctuations and translocation
during transcription. The nucleotide addition cycle during transcription gradually alters the entropic state of
the system till the time the nascent RNA at the exit channel is long enough to fold into a hairpin. We already
know that RNA folding and thermal equilibration of the structure occur much faster than nucleotide addition
by RNAP37. As RNA folding is driven by entropy57 there is a rapid entropy change locally in the system. This
entropy change can act as a perturbation and a trigger for conformational transitions along soft m odes55 of the
RNAP complex. The perturbation may drive thermalization in the system leading to overcoming the transition
barrier56 for ITT to take place. The probability of such perturbations increases with the formation of more hair-
pins and thus increases the probability of stochastic ITT. This predisposes cluster hairpins for more efficient ITT
compared to the single. In vivo studies in M. smegmatis indeed show that two tandem hairpins downstream of
the gyrA gene have a higher termination efficiency than individual single hairpins21. Please note that accessory
factors that interact with the RNAP or the nascent RNA can alter the probabilities of the ITT process, but the
proposition that cluster hairpins can achieve more efficient ITT than single hairpin remains consistent on both
kinetic and thermodynamic considerations.
Termination takes place 10–14 nucleotides downstream from the first nucleation point of the hairpin11. This
is consistent with our study as well. Another study found that termination (although not very efficient) was seen
7 nucleotides downstream from the stem end of hairpin32 in both in vitro and in vivo. There is also a relationship
between the stop codon and the terminator position. Hairpins should be present at least 30 nucleotides away from
the stop c odon31. It has also been observed that terminators within 100 bases from the coding region have high
Scientific Reports | (2021) 11:16194 | https://doi.org/10.1038/s41598-021-95435-3 11
Vol.:(0123456789)www.nature.com/scientificreports/
E. coli L. interrogans M. tb P.aeruginosa
# A B C D E F G H E I F I E F J E
1 1 0.9 0.7 0.6 0.5 0.7 0.9 2.1 1.3 1.3 0.4 0.4 0.3 1.7 1.5 1.6
2 1.3 1.4 1.2 0.4 1 1 0.8 1.6 1 1.1 0.9 1 1.1 0.9 0.6 0.8
3 1.5 1.4 1.5 0.9 0.9 1.7 1.7 3.2 2.2 2.5 4 4.1 3.8 6.5 3.4 4.6
4 0.7 1 0.8 0.3 0.6 1.2 1 2.8 1.7 1.4 1.5 1.5 1.4 3.6 2.6 3
5 0.5 1.2 0.3 0.4 0.2 0.7 0.4 1.3 0.6 0.6 0.9 0.8 0.7 2 1.5 1.7
Table 5. Expression values of proteins as a ratio against Rho protein expression. # 1 = NusA, 2 = NusG, ,
3 = RpoA, 4 = RpoB, 5 = RpoD; Methods: A/B/C71, D72, E73, F74, G/H75, I76, J77; values ≤ 0.5 are marked in bold
for RNAP subunits, RpoA, RpoB and RpoD.
termination efficiency. As mentioned above, all the analyses are performed only on the E. coli genome, and further
experimental/mechanistic studies would be required to see if these trends are statistically significant and followed
across other bacteria. We also tried to find regions of conservation near the stop codon and around the hairpins
but could not find any such sequence conservation within 25 bases from the stop codon (Table S8; Fig. S11).
The other piece of the puzzle stems from the fact that extrinsic transcription termination also involves a hair-
pin upstream of the hexameric Rho protein binding site. Table 5 depicts data from literature where the concentra-
tion of RNAP subunits and other termination factors are expressed as a ratio of the Rho protein (i.e., < protein
of interest > / < Rho protein >). Since the hexameric form of the protein is needed for RNA binding and extrinsic
termination, for 100% extrinsic termination, we expect a 1/6 (0.167) abundance of RNAP. However, if we look
at the maximum expression values for RNAP subunits for each experiment, the data suggest a low prevalence of
extrinsic termination (approximately 10–25%). Given that the coverage of intrinsic terminators is in the range
of 75–85%, together with the extrinsic terminator, it appears to cover the whole set of coding genes.
Existing literature suggests that Rho-dependent terminators mostly occur in enteric (rod-shaped gram-
negative) bacteria5. Rho protein has been found to be inessential in many gram-positive bacteria, including B.
subtilis and H. pylori species22,58,59. Also, the inhibition of Rho protein in these species has been linked to the
non-essentiality of Rho60. Likewise, Clarke et al.61 have shown that the strong Rho-independent terminator
sequences show the same conserved effects on RNAP activity across domains of life. Different tools that iden-
tify hairpins like Transterm15, RNAMotif16, etc. have similarly applied the search for these common features on
bacterial datasets. It has also been seen that sometimes an operon has both termination sites (Rho-independent
and Rho-dependent) as a fail-safe mechanism for termination32, but they work independently. The insights from
our work appear to be consistent with these previous observations.
Other functional roles of hairpins might involve the presence of specific sequence motifs, or in inhibition
of RNA d egradation49, as DNA uptake e lements62, translational s urveillance63, or r iboswitches64. However, the
location of these elements is distinct from the region downstream of the stop codon.
To summarize, we identified 72% of cases of the cluster and single units in filtered IRs co-located against
RNA-seq derived terminators. We show that if hairpins work in tandem (i.e., cluster), they can bring about ITT,
as evidenced by the absence of RNA-seq reads contiguous to our identified hairpin sites. 91% of the matched
bacterial termination units are present close to the stop codon in each transcription unit within 50 bases. They
typically have a stem length between 4 and 14 base pairs and a 5 and 10 loop length. The requirement of a poly
A/U pattern at the hairpin base is not essential. The detection of hairpins is independent of its GC content; i.e.,
we are able to find ITT units across GC as well as AT rich genomes. Our work contributes to the understanding
of the genomic requirements necessary to execute an ITT process.
Methods
Test data set. A dataset is constructed from representative microbial species selected from 6 different bac-
terial phyla. At first, all organisms are grouped based on their phylogenetic distance from each other, as pro-
posed by Ciccarelli et al.65. A representative from each group is chosen if it had public RNA-seq data (Fig. S12,
Table 1) with ≥ 70% alignment with its reference genome (i.e. ≥ 70% reads mapped). All data is obtained from the
NCBI-SRA database (http://www.ncbi.nlm.nih.gov/sra). Entries from Planctomyces, Thermodesulfobacteria,
Chlamydia, Chloroflexi, and Acidobacteria from bacterial phyla are excluded due to the absence of high-quality
RNA-seq data. To increase the confidence and coverage of RNA-seq data being used, sample replicates under
the same experimental conditions are taken wherever available. This data is indexed and aligned to the respec-
tive reference genomes using Bowtie266. Reads present in a proper pair (flags: 83/163, 99/147), with Transcript
Length (TLEN) or insert size ≥ read length, and map quality ≥ 30, are filtered out from the initially obtained
alignment. TLEN is the distance between the 5′ end of the leftmost read to the 3′ end of the rightmost read that
is mapped to the same cDNA fragment (Fig. 9). Reads on the forward and reverse strand are also separated to
get correct transcription levels for each transcription unit.
Predicting hairpins. MFold67 software is used to predict the secondary structures for the input single-
stranded RNA sequences. It has been used widely and tested for performance by several groups68,69. In MFold
each gene and the corresponding RNA substring from the region of − 20 to + 270 bp is taken for analysis,
where + 1 denotes the stop codon site18. MFold calculates free energy for predicted structures at 37 °C by assum-
odel70. The hairpin stability is calculated by penalizing various factors like length and sequence
ing a two-state m
Scientific Reports | (2021) 11:16194 | https://doi.org/10.1038/s41598-021-95435-3 12
Vol:.(1234567890)www.nature.com/scientificreports/
Figure 9. TLEN calculation. The illustration shows how TLEN is calculated for paired-end reads. The definition
from the bam specification says that TLEN or the signed observed template length is the length between the
mapped end of the template to the mapped start of the template for all reads mapped to the same template
(https://samtools.github.io/hts-specs/SAMv1.pdf). This means the distance between the 5′ end of the leftmost
read and the 3′ end of the rightmost read is mapped to the template.
of the loop, stacking of the first mismatch from the initiation free energy, ∆Ginitiation71. Bonuses are added for
special loop closing groups like GU. Output scores denominated as ∆G (kcal/mol) represent the stability of the
hairpins. The scores in terms of ∆G output by MFold represent the stability accrued primarily from the second-
ary structure interactions. Additional stability may accrue from tertiary structure interaction, which may not be
faithfully accounted for by the MFold scoring function. To check for this fact, we took all the predicted hairpins
with > 0 ∆G (kcal/mol) score from MFold and subjected them to three-dimensional structure modeling using
SimRNA72. SimRNA is a computational RNA three-dimensional structure prediction method that uses Monte
Carlo simulations to check possible folding structures and outputs an energy score for it. The secondary struc-
ture output from MFold was used to put constraints on the conformational search space of the three-dimen-
sional structures during sampling. For each hairpin, we find 11 all-atom structure frames after 1600 iterations
and add protons using the REDUCE p rogram73. We screen if the predicted three-dimensional RNA structure is
valid with help of the MolProbity p rogram74. It checks for the presence of wrong sugar puckers in each predicted
structure. Trial three-dimensional hairpin models are first generated in batches to check for stable structures.
All the hairpins returned at least one tertiary model with < 0 ∆G (kcal/mol) score among the first 100 trial struc-
tures generated respecting the expected sugar puckering geometries, bond length and bond angle values. To
additionally confirm the veracity of our methodology, we searched through the literature and culled 110 hairpin
structures for which we had information on experimentally determined free energy of hairpin formation. These
hairpins have been predominantly reported in E. coli, in addition to P. aeruginosa, M. formicicum, and T. acido-
philum70,71,75. The sequences are subjected to MFold secondary structure prediction, and those with > 0 ∆G score
are taken for tertiary structure modelling using SimRNA as outlined above. All the energy scores output for the
three-dimensional models are found to be < 0 ∆G (kcal/mol) (Fig. S13). The predicted hairpins in our study had
a wide range of stem and loop lengths and this was consistent with the previous reports that corroborate the
absence of any correlation between hairpin strength, stem or loop length76. Our results indicate that all MFold
predicted hairpins are stable and thus taken forward in our analysis. For each MFold output, hairpin structures
are extracted and labeled as predicted hairpins. A two-dimensional histogram is used to find the counts of vari-
ous combinations of stem and loop lengths for the predicted hairpins. The lowermost counts for the combina-
tions constituting 5% of the total cases are rejected retaining only those hairpin loop-stem length combinations
satisfying the threshold. This was done to exclude potential outlier cases.
Defining the transcription termination scan window. RNA-seq reads do not reduce in number in the
intergenic regions of an o peron77; therefore, the non-coding region downstream of a stop codon of an operon
or individual gene is found for each transcription unit up to the defined scan window (+ 270). The FGENESB
module of the Molquest software (http://www.molquest.com)78 is used to obtain the start and stop codon posi-
tions of genes and operons. It predicts operon locations using distances between locations of predicted genes
in combination with data from homolog databases like COG79, KEGG80 after performing a BLAST81 search. It
uses a Markov model for coding region annotation, and distances between predicted genes to predict operons.
It supposedly predicts 70% single transcription units and about 50% operons exactly. Accuracy determination is
done on a set of difficult short genes that have been used for evaluation accuracy of bacterial gene finders as well.
It was seen that the accuracy of Molquest is better than previously used Glimmer and GeneMarkS s oftwares82,
which previously provided the best accuracy. Accuracy was tested on highly annotated sets from B. subtilis and
E. coli. Predicted promoters and terminators are used to increase the accuracy of operon identification, as they
now have defined boundaries thus training of initial parameters is better. Genes annotated in the NCBI genome
database but not identified by Molquest are included in our list as additional entries. We calculate the inter
operon/gene region (IR), defined by the region between the 3′ end of an operon or individually transcribed gene
and the 5′ end of the next transcription unit. The intergenic regions within an operon are not included in IR.
IR screening by RNA‑seq data. For each genome, read depth is calculated at each location. In case the
organism had replicate experimental data, reads from all of them are combined and averaged to find an average
read depth. Only cases where the read coverage of the CDS region is > 90% are taken for further analysis because
of PCR amplification errors, degree of annotation in operons, PCR duplicates, alignment efficiency of paired-
end mapping, etc.83. If read coverage in either the CDS or IR region of a transcription unit is several orders
Scientific Reports | (2021) 11:16194 | https://doi.org/10.1038/s41598-021-95435-3 13
Vol.:(0123456789)You can also read


