The homogenization of avian morphological and phylogenetic diversity under the global extinction crisis
←
→
Page content transcription
If your browser does not render page correctly, please read the page content below
Report

The homogenization of avian morphological and
phylogenetic diversity under the global extinction
crisis
Highlights                                                                Authors
d   Predicted loss of birds will drive exceptional declines in            Emma C. Hughes, David P. Edwards,
    morphological diversity                                               Gavin H. Thomas

d   Species extinctions lead to a major loss of ecological                Correspondence
    strategies and functions
                                                                          echughes8@gmail.com (E.C.H.),
                                                                          gavin.thomas@sheffield.ac.uk (G.H.T.)
d   Most biomes and ecoregions will experience morphological
    homogenization
                                                                          In brief
d   Phylogenetic diversity tends to decline as expected as                The global extinction crisis will lead to
    species go extinct                                                    widespread losses of morphological
                                                                          diversity. Hughes et al. show that
                                                                          predicted species extinctions drive far
                                                                          greater declines of ecological strategies
                                                                          than predicted, with important
                                                                          ramifications for humans as ecosystem
                                                                          services are lost. In contrast,
                                                                          phylogenetic diversity declines as
                                                                          expected.

           Hughes et al., 2022, Current Biology 32, 3830–3837
           September 12, 2022 ª 2022 The Author(s). Published by Elsevier Inc.
           https://doi.org/10.1016/j.cub.2022.06.018                                                      ll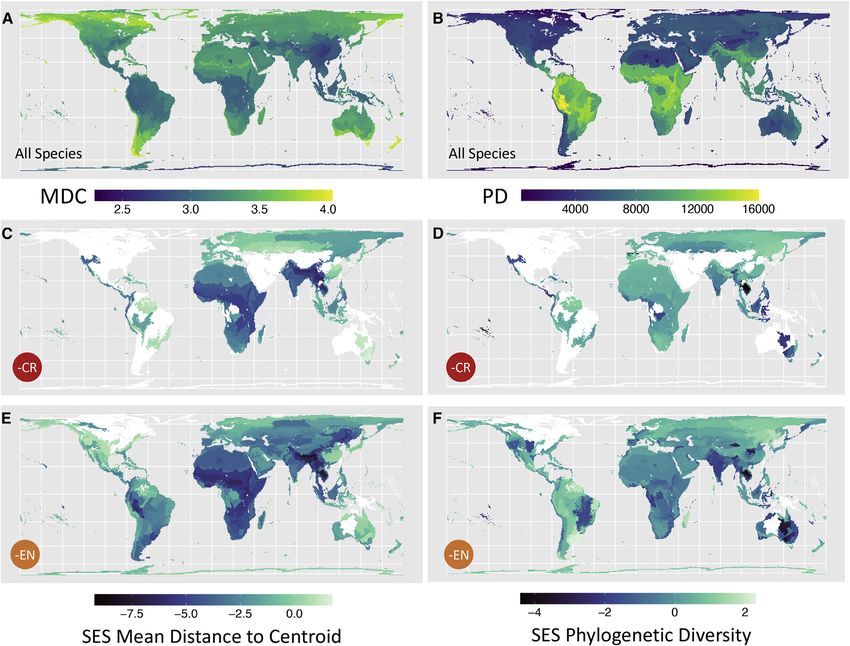
ll
        OPEN ACCESS

Report
The homogenization of avian morphological
and phylogenetic diversity
under the global extinction crisis
Emma C. Hughes,1,2,3,4,* David P. Edwards,1 and Gavin H. Thomas1,2,*
1Ecology  and Evolutionary Biology, School of Biosciences, University of Sheffield, Sheffield S10 2TN, UK
2Bird Group, Department of Life Sciences, Natural History Museum, Akeman Street, Tring HP23 6AP, UK
3Twitter handle: @EHughes27
4Lead contact

*Correspondence: echughes8@gmail.com (E.C.H.), gavin.thomas@sheffield.ac.uk (G.H.T.)
https://doi.org/10.1016/j.cub.2022.06.018

SUMMARY

Biodiversity is facing a global extinction crisis that will reduce ecological trait diversity, evolutionary history,
and ultimately ecosystem functioning and services.1–4 A key challenge is understanding how species losses
will impact morphological and phylogenetic diversity at global scales.5,6 Here, we test whether the loss of
species threatened with extinction according to the International Union for Conservation of Nature (IUCN)
leads to morphological and phylogenetic homogenization7,8 across both the whole avian class and within
each biome and ecoregion globally. We use a comprehensive set of continuous morphological traits ex-
tracted from museum collections of 8,455 bird species, including geometric morphometric beak shape
data,9 and sequentially remove species from those at most to least threat of extinction. We find evidence
of morphological, but not phylogenetic, homogenization across the avian class, with species becoming
more alike in terms of their morphology. We find that most biome and ecoregions are expected to lose
morphological diversity at a greater rate than predicted by species loss alone, with the most imperiled re-
gions found in East Asia and the Himalayan uplands and foothills. Only a small proportion of assemblages
are threatened with phylogenetic homogenization, in particular parts of Indochina. Species extinctions will
lead to a major loss of avian ecological strategies, but not a comparable loss of phylogenetic diversity. As
the decline of species with unique traits and their replacement with more widespread generalist species con-
tinues, the protection of assemblages at most risk of morphological and phylogenetic homogenization
should be a key conservation priority.

RESULTS AND DISCUSSION                                                     We used data from the International Union for Conservation of
                                                                        Nature (IUCN) Red List19 to obtain threat statuses for each spe-
Extinction risk across morphospace                                      cies and highlight these on the avian morphospace (Figure S1).
Assessing the impact of extinction on both evolutionary and             We calculated the mean distance to centroid of morphospace20
ecological components of biodiversity can reveal the non-               across morphospace for all bird species, where species from
random loss of species10 and highlight where loss of threatened         each IUCN threatened category were dropped (critically endan-
species could lead to biotic homogenization.7,8,11 This unequal         gered [CR] > endangered [EN] > vulnerable [VU] > near threatened
spread of extinction risk across the tree of life1,12–14 is predicted   [NT]) and found a weak trend of species tending to be closer to the
to lead to an ecological downsizing of species, where the largest,      center of morphospace (Figure 1). Next, we repeated these calcu-
most slow-lived species are lost.15                                     lations on individual PC axes and calculated a standard effect size
   We first examined if bird species at greater risk of extinction      (SES) for each PC and IUCN threat category (STAR Methods;
have more unique traits. Using a suite of morphological avian           Table S1). A SES score of < 2 indicates that loss of an IUCN
traits (beak size and shape, tarsus and wing length, and body           threat category significantly reduces the mean distance to
size) that are likely to be linked to ecological function and so cap-   centroid value for that PC.
ture a species ecological niche,16 we ran a principal components           Generally, as threatened (CR, EN, and VU) species are
(PCs) analysis and plotted the resultant morphospace based on           removed, mean distance to centroid declines significantly
the first eight PCs (Figure S1; STAR Methods). Avian morpho-            more than expected, indicating that threatened species are
space is distributed around a dense core of species in the center,      found at a higher density than non-threatened species at
with fewer, more diverse forms found towards the edges of mor-          extreme PC values (SES < 2 for majority of PCs; Table S1).
phospace (Figure S1).9,17,18                                            Size metrics predominantly load onto PC1 (Table S2), and

3830 Current Biology 32, 3830–3837, September 12, 2022 ª 2022 The Author(s). Published by Elsevier Inc.
This is an open access article under the CC BY license (http://creativecommons.org/licenses/by/4.0/).
ll
Report OPEN ACCESS
12.5 with a SES score of 7.89 (Figure 2). Morphological homogeniza-
tion continues with the additional loss of EN (SES = 12.00) and
Distance to Centroid (PC1−8)
VU (SES = 15.94) species, with no further reduction in SES with
10.0 the loss of NT (SES = 15.80) species (Figure 2), implying that NT
species are lost at random across morphospace, unlike species
threatened with extinction (CR, EN, and VU).
7.5 We find that the loss of CR, EN, and VU species does not lead
to a significant loss of phylogenetic diversity, above that ex-
pected through species loss alone (SES > 2: Figure 2). Only
5.0 the additional loss of NT species results in a significant reduction
in phylogenetic diversity (SES = 3.39: Figure 2), indicating that
NT species are more evolutionarily distinct compared to the
2.5 global pool of species. Our findings of a lack of congruence be-
tween morphological and phylogenetic diversity loss across the
avian class indicates that species threatened with extinction
0.0 exhibit traits that are more unique, given their phylogenetic his-
CR EN VU NT LC All tory, compared to the wider species pool.
IUCN Both trait and phylogenetic diversity measures are amassed
over long evolutionary timespans and are often considered to
Figure 1. Distance to centroid of morphospace scores for bird spe- be positively correlated.27 This occurs where trait evolution is
cies in each IUCN threat category
phylogenetically constrained such that species traits exhibit
Distance to centroid scores (the Euclidean distance of each species to the
center of morphospace [principal components 1–8]) calculated for all global
strong phylogenetic signal and diverge over time (e.g., following
bird species (All) and for species in each of the IUCN threat categories: criti- Brownian motion).27,28 Therefore, the extinction of an evolution-
cally endangered (CR), endangered (EN), vulnerable (VU), near threatened (NT) arily old species with no close relatives that has evolved unique
and least concern (LC). The higher the mean distance to centroid, the further a traits could have a greater impact on phylogenetic and trait di-
species is from the center. 0 is the centroid of morphospace. Box and whiskers versity than a more recently evolved species with many close rel-
show the median value and interquartile range. atives with similar trait values.5,29 However, not all species traits
See also Figure S1 and Table S1.
evolve at a constant rate (e.g. in the work of Chira and Thomas,
Harmon et al., O’Meara et al., and Venditti et al.30–33) or show
strong phylogenetic signal,34 and this could therefore lead to
our findings support the hypothesis that the largest10,15,21 and the differences in morphological and phylogenetic diversity
smallest species14 are likely to be at most risk from extinction loss that we find across the avian class.
(Figure S1; Table S1). Our results suggest that morphological di- To assess the relationship between morphological diversity
versity is likely to decrease at a greater rate than expected and phylogenetic history, we tested for multivariate phylogenetic
through species loss alone in the face of global change.5 signal across our morphological traits. We find a strong multivar-
iate phylogenetic signal across our eight PCs. However, we find
Impacts of extinction on global morphological and significant departure from strict Brownian motion with a mean
phylogenetic diversity l = 0.920 (lower confidence interval = 0.918, upper confidence
Species at risk of extinction tend to be overrepresented in partic- interval = 0.923) across 200 out of 200 phylogenetic trees. More-
ular clades and functional groups22 and belong to evolutionarily over, previous studies on subsets of the data show widespread
unique lineages.23,24 At a global scale, we predicted that the loss variation in the rate of evolution.17,35 Together, this indicates that
of threatened species will lead to an overall homogenization such morphological and phylogenetic diversity are at least partially
that species trait and phylogenetic diversity is lost at a greater decoupled and that phylogenetic diversity loss is not always an
rate than expected. appropriate surrogate for morphological diversity loss.5,36,37
We calculated the mean distance to centroid of morpho-
space,20 as a measure of trait diversity and Faith’s phylogenetic Spatial loss of morphological and phylogenetic diversity
diversity3 for all bird species, and where each IUCN category Patterns of trait and phylogenetic homogenization are also likely
was sequentially dropped (STAR Methods). Morphological and to vary across space. Raw phylogenetic and trait diversity are
phylogenetic diversity correlate with species richness because distributed unequally globally,9,25,26,38,39 while threats faced
the addition of species to a community adds new combinations (e.g., habitat loss, hunting, or climate change) and species sen-
of traits, as well as a branch length to the community phyloge- sitivities to these threats are spatially variable and increasing in
netic tree.9,25,26 Therefore, we constructed null models to test intensity due to human activities.6 For example, the greatest
whether the species remaining after losing each IUCN category threats to tropical terrestrial vertebrates are logging and agricul-
had mean distance to centroid and phylogenetic diversity values ture, whereas the threats posed by invasive species are particu-
that deviated from expected given the observed species rich- larly high for island birds.40,41 Thus, certain regions will be at
ness by calculating SESs (STAR Methods). increased risk from trait and phylogenetic homogenization.6 To
We find strong evidence of morphological homogenization examine this, we focus on bird communities found in each of
across the avian class (SES < 2) (Figure 2). Losing 111 CR spe- the world’s ecoregions (n = 814)—units of land that contain
cies leads to significant homogenization of avian morphospace distinct assemblages of natural communities, species,
Current Biology 32, 3830–3837, September 12, 2022 3831ll
OPEN ACCESS Report
Figure 2. Variation in mean distance to
0 centroid and phylogenetic diversity where
each IUCN category is lost across the entire
avian class
IUCN Status Lost The standard effect size of phylogenetic diversity
(circles) and trait diversity (mean distance to
All Species Retained
Standard Effect Size
centroid) (triangles) calculated for the whole global
−5 CR Lost species pool of birds (grey, n = 8,455) and for each
remaining value of species richness where species
EN Lost
categorized under each IUCN threat status are lost:
VU Lost critically endangered (CR: red) species, then en-
NT Lost (LC Only Retained) dangered (EN: orange) species, vulnerable (VU:
yellow) species, and finally near threatened (NT:
−10 green) species, leaving least concern (LC) species
only. Error bars show the standard deviation of
Metric phylogenetic diversity calculated on 200 phyloge-
Phylogenetic Diversity netic trees. The dotted lines are where SES =
0 and SES = 2. Values < 2 indicate significant
Trait Diversity homogenization.
−15
8500 8000 7500 7000 imperiled are those found in the Himalayas
Remaining Species Richness and parts of Indochina (Figures 4C and 4E),
with the addition of ecoregions across
sub-Saharan and East Africa where VU
dynamics, and environmental conditions—and biomes (n = 14)— and NT species morphology is lost (Figure S2E). Many island
major habitat types (e.g., tropical grassland).42 We calculate the systems (e.g., Hawaii, French Polynesia, and Madagascar)
mean distance to centroid, phylogenetic diversity, and the SES would experience significant morphological homogenization
of both metrics for each biome and ecoregion42 communities43 when losing the most threatened species (Figure S4C). Island
after losing CR, EN, VU, and finally NT bird species (STAR taxa are amongst the most threatened globally, and significant
Methods). losses of iconic, morphologically diverse species have already
We find strong latitudinal variation in biome morphological di- occurred (e.g., many Hawaiian honeycreepers or the elephant
versity and phylogenetic diversity, with assemblages in the tro- bird), resulting in homogenization of trait diversity.44
pics harboring the highest phylogenetic diversity and being Fewer ecoregions would experience phylogenetic homogeni-
particularly clustered around the centroid of morphospace zation (SES < 2) where CR (5.5% ecoregions, n = 382) and CR
(Figures 3A and 3B). If CR species went extinct, 12 of the 14 bi- and EN species (4.3% ecoregions, n = 698) are lost (Figures 4D
omes (86%) would experience morphological homogenization and 4F). The most phylogenetically imperiled ecoregions are
(SES < 2), with the most imperiled biomes being tropical dry found in parts of Indochina, particularly Cambodia and Vietnam,
and moist forests and flooded grasslands (Figure 3C). All biomes as well as French Polynesia, Iberian and Pyrenean montane for-
would experience homogenization with the further loss of EN, ests, and Australia (Figures 4D and 4F). Further loss of VU and NT
VU, and NT species (Figures 3E and S2), with the montane grass- species would lead to the addition of central African ecoregions
land biome becoming especially highly threatened with the loss being threatened with phylogenetic homogenization, as well as
of EN species (Figure 3E). those regions covering the length of the Andes and Sulawesi
Phylogenetic diversity loss does not show significant homog- (Figures S2F and S2H).
enization for most biomes when CR species are lost (13 out of Our finding that morphological, but not phylogenetic, homog-
14), with only Mediterranean forests experiencing exceptional enization is an inevitable outcome of predicted biodiversity loss
homogenization (Figure 3D). Likewise, when EN species are for the majority of biomes and ecoregions highlights the potential
additionally lost, only the temperate broadleaf forest biome is for ecological changes that could lead to a considerable loss of
threatened with phylogenetic homogenization (Figure 3F). For ecological roles and ecosystem functioning, productivity, and
both biomes, homogenization is only just significant. services.7 Of six CR species lost in the top five most imperiled
We further find low morphological diversity in many East Asian ecoregions, four are vultures (Sarcogyps calvus, Gyps tenuirost-
ecoregions. The highest morphological diversity is found across ris, bengalensis, and indicus). The traits used in this study are
ecoregions in New Zealand and the southern tip of South Amer- broadly similar to those linked to the ecological foraging guilds
ica, as well as northern North America (Figure 4A). Many ecore- of birds,16,18 and vultures, as large-bodied, obligate scavengers,
gions of the world would experience morphological homogeni- fill distinct areas of morphospace.9,45 Therefore, it is likely that
zation (mean distance to centroid SES < 2) if species in each the considerable loss of morphological diversity in the Himalayan
IUCN category were to go extinct (Figures 4 and S2). For ecoregions is partly driven by the loss of vultures—the most
example, 48.4% of ecoregions would experience morphological imperiled group of birds.46 Vultures provide vital ecosystem ser-
homogenization where CR species are lost (n = 382 ecoregions; vices by removing decaying carcasses, which could otherwise
Figure 4C). Ecoregions that are particularly morphologically increase the direct transmission of infectious diseases47–49 and
3832 Current Biology 32, 3830–3837, September 12, 2022ll
Report OPEN ACCESS
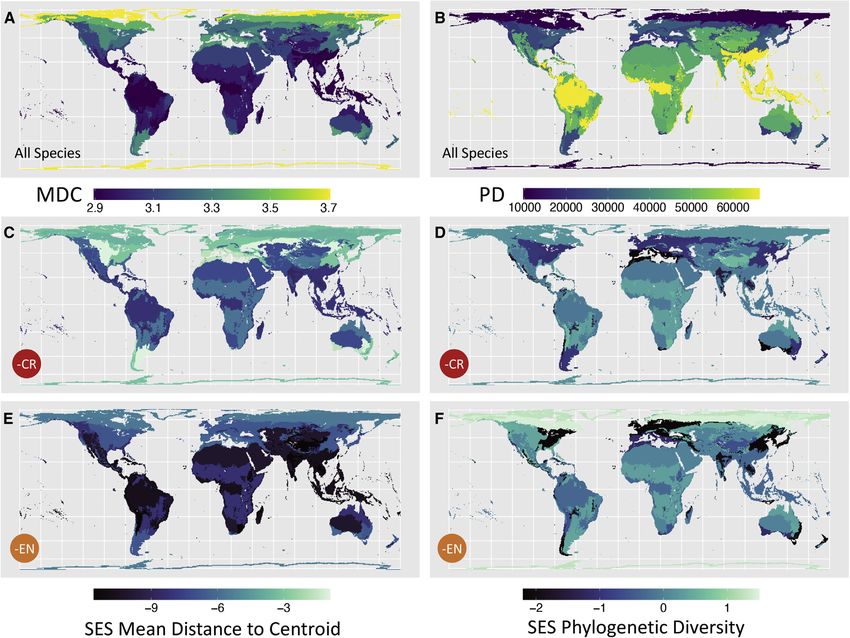
Figure 3. Variation in morphological diversity and phylogenetic diversity across avian assemblages in each terrestrial biome
(A and B) The amount of raw morphological (mean distance to centroid) (A) and phylogenetic diversity (B) for 8,426 bird species across 14 terrestrial biomes. The
darker blue color indicates that species in that biome are on average closer to the center of morphospace (A) and have low phylogenetic diversity. The lighter
yellow color indicates that species in that biome tend to be further from the center of morphospace (A) and have high phylogenetic diversity.
(C–F) Standard effect sizes (SES) for morphological (C) and phylogenetic diversity (D) were calculated from 1,000 simulated biome communities after critically
endangered (CR) species and, additionally, when endangered (EN) species were dropped (E and F). The darkest blue color indicates where SES values are more
negative than expected, with values < 2 showing significant homogenization.
See also Figures S2 and S3.
increase populations of opportunistic scavengers (i.e., dogs and from IPBES53), these species are currently only receiving low,
rats) that spread rabies and bubonic plague.47,50 medium, and very low conservation attention, respectively.52
Another region containing assemblages at risk of morpholog- Despite being less widespread than morphological diversity
ical homogenization are the dry and moist forest ecoregions of loss, phylogenetic diversity loss remains an important metric
South Vietnam and Cambodia, where there is also exceptionally for assessing the impact of species extinction.3 Specific sets
high expected loss of phylogenetic diversity. The CR and EN spe- of traits are used to capture morphological diversity that are ex-
cies present are therefore likely to be phylogenetically unique and pected to relate to specific ecological niches and functions in the
exhibit sets of traits that the surviving species pool does present day,54 but it is impossible to capture all possible combi-
not contain. Indeed, highly threatened species here are amongst nations of traits that species represent to exactly map form to
the highest evolutionarily distinct and globally endangered51 function.3 Phylogenetic diversity captures this feature diversity,
(EDGE52) classified species including giant ibis (Thaumatibis gi- including traits not currently known or measurable.3,55 In turn,
gantea, ranked second by EDGE), Bengal florican (Houbaropsis this makes phylogenetic diversity a good indicator of biodiversity
bengalensis, seventh), and white-shouldered ibis (Pseudibis davi- ‘‘option value’’—the unknown future benefits to humans not
soni, sixteenth). Despite phylogenetic diversity increasingly being currently realized.3 Using subsets of ecologically relevant traits
stated as an essential facet of biodiversity to conserve to meet captures the impacts of species loss on specific aspects of
global targets of biodiversity conservation (e.g., the 2019 report phenotype, which may be important to conserve if they link to
Current Biology 32, 3830–3837, September 12, 2022 3833ll
OPEN ACCESS Report
Figure 4. Variation in morphological diversity and phylogenetic diversity across avian assemblages in each terrestrial ecoregion
(A and B) The amount of raw morphological (mean distance to centroid) (A) and phylogenetic diversity (B) for 8,423 bird species across 814 terrestrial ecoregions.
The darker blue color indicates that species in that ecoregion are on average closer to the center of morphospace (A) and have low phylogenetic diversity. The
lighter yellow color indicates that species in that ecoregion tend to be further from the center of morphospace (A) and have high phylogenetic diversity.
(C–F) Standard effect sizes (SES) for morphological (C) and phylogenetic diversity (D) were calculated from 1,000 simulated biome communities after critically
endangered (CR) species and, additionally, when endangered (EN) species were dropped (E and F). The darkest blue color indicates where SES values are more
negative than expected, with values < 2 showing significant homogenization. White ecoregions are those where no CR or EN species are present, and therefore,
SES scores cannot be calculated.
See also Figures S2 and S4.
key aspects of ecosystem functioning or services.56 Priority species are already functionally extinct across most of their
should therefore be given to establishing whether measurable ranges, and so morphological diversity is already likely to be
species traits can more directly capture important features to dramatically constrained.60 Given that the replacement of
conserve than phylogeny. more specialist species by a smaller number of more generalist
Our study focuses on species extinctions as a primary driver species7,11 is unlikely to abate, as well as increasing pressure
of morphological and phylogenetic homogenization.11 While we from additional drivers of species decline and distribution
capture the range expansion of species to present day, change (e.g., climate change,1 wildlife trade,61 etc.), it is likely
including reintroduced species ranges, we do not include spe- that our findings underestimate the degree of morphological
cies introduced through direct or indirect human activity. The homogenization that will and has already occurred during the
introduction and spread of non-native species are another Anthropocene.
key driver of the biological extinction crisis,57 as they tend to In conclusion, our work reveals widespread morphological ho-
more generalist7,11 and can diminish the distinctiveness of mogenization across the entire avian class, most terrestrial bi-
regional assemblages, reducing trait and phylogenetic differ- omes, and half of all ecoregions. The predicted loss of morpho-
ences between species.8,44,58,59 Furthermore, we deal with logical diversity exceeds that expected if future extinctions were
global extinction, but not local extirpation. In many areas, random and highlights important losses of ecological function
3834 Current Biology 32, 3830–3837, September 12, 2022ll
Report OPEN ACCESS
across assemblages, with important ramifications for humans as INCLUSION AND DIVERSITY
ecosystem services are lost. Phylogenetic diversity tends to
One or more of the authors of this paper self-identifies as living with a disability.
decline as expected as species go extinct. Whether measurable
While citing references scientifically relevant for this work, we also actively
species traits can capture features of conservation priority, such worked to promote gender balance in our reference list.
as key ecosystem services, more directly is crucial to under-
stand when assessing the impacts of extinction on biodiversity. Received: March 16, 2022
Revised: May 11, 2022
Accepted: June 8, 2022
STAR+METHODS Published: July 21, 2022
Detailed methods are provided in the online version of this paper REFERENCES
and include the following:
1. Dirzo, R., Young, H.S., Galetti, M., Ceballos, G., Isaac, N.J.B., and Collen,
B. (2014). Defaunation in the Anthropocene. Science 345, 401–406.
d KEY RESOURCES TABLE
https://doi.org/10.1126/science.1251817.
d RESOURCE AVAILABILITY
2. Devictor, V., Mouillot, D., Meynard, C., Jiguet, F., Thuiller, W., and
B Lead contact
Mouquet, N. (2010). Spatial mismatch and congruence between taxo-
B Materials availability nomic, phylogenetic and functional diversity: the need for integrative con-
B Data and code availability servation strategies in a changing world. Ecol. Lett. 13, 1030–1040.
d EXPERIMENTAL MODEL AND SUBJECT DETAILS https://doi.org/10.1111/j.1461-0248.2010.01493.x.
B Morphological trait space 3. Faith, D.P. (1992). Conservation evaluation and phylogenetic diversity.
B Threat status Biol. Conserv. 61, 1–10. https://doi.org/10.1016/0006-3207(92)91201-3.
B Species pools 4. Purvis, A., and Hector, A. (2000). Getting the measure of biodiversity.
d METHOD DETAILS Nature 405, 212–219. https://doi.org/10.1038/35012221.
B Avian morphological and phylogenetic diversity mea- 5. Oliveira, B.F., Scheffers, B.R., and Costa, G.C. (2020). Decoupled erosion
sures of amphibians’ phylogenetic and functional diversity due to extinction.
Global Ecol. Biogeogr. 29, 309–319. https://doi.org/10.1111/geb.13031.
d QUANTIFICATION AND STATISTICAL ANALYSIS
6. Brodie, J.F., Williams, S., and Garner, B. (2021). The decline of mammal
B Phylogenetic signal across morphological traits
functional and evolutionary diversity worldwide. Proc. Natl. Acad. Sci.
B Simulating the impact of threatened species loss on
USA 118. e1921849118. https://doi.org/10.1073/pnas.1921849118.
morphological and phylogenetic diversity
7. Clavel, J., Julliard, R., and Devictor, V. (2011). Worldwide decline of
specialist species: toward a global functional homogenization? Front.
Ecol. Environ. 9, 222–228. https://doi.org/10.1890/080216.
SUPPLEMENTAL INFORMATION
8. Daru, B.H., Davies, T.J., Willis, C.G., Meineke, E.K., Ronk, A., Zobel, M.,
Pa€rtel, M., Antonelli, A., and Davis, C.C. (2021). Widespread homogeniza-
Supplemental information can be found online at https://doi.org/10.1016/j.
cub.2022.06.018. tion of plant communities in the Anthropocene. Nat. Commun. 12, 6983.
https://doi.org/10.1038/s41467-021-27186-8.
9. Hughes, E.C., Edwards, D.P., Bright, J.A., Capp, E.J.R., Cooney, C.R.,
ACKNOWLEDGMENTS Varley, Z.K., and Thomas, G.H. (2022). Global biogeographic patterns of
avian morphological diversity. Ecol. Lett. 25, 598–610. https://doi.org/
We thank J. Bright, E. Capp, C. Cooney, and Z. Varley, who, alongside E.C.H. 10.1111/ele.13905.
and G.H.T., collected data from museum specimens and designed analytical 10. Cardillo, M., Mace, G.M., Jones, K.E., Bielby, J., Bininda-Emonds, O.R.P.,
protocols for producing the beak shape dataset. We thank M. Adams, H. Sechrest, W., Orme, C.D.L., and Purvis, A. (2005). Multiple Causes of High
van Grouw, and R. Prys-Jones from Bird Group at the Natural History Museum, Extinction Risk in Large Mammal Species. Science 309, 1239–1241.
Tring; H. McGhie at the Manchester Museum; and S. Hackett and B. Marks at https://doi.org/10.1126/science.1116030.
the Field Museum, Chicago for providing access to and expertise in the orni-
11. McKinney, M.L., and Lockwood, J.L. (1999). Biotic homogenization: a few
thological collections and the volunteer citizen scientists who landmarked
winners replacing many losers in the next mass extinction. Trends Ecol.
3D beak scans at http://www.markmybird.org. E.C.H. was funded by a
Evol. 14, 450–453. https://doi.org/10.1016/S0169-5347(99)01679-1.
NERC PhD studentship under the Adapting to the Challenges of a Changing
Environment (ACCE) DTP (NE/L002450/1). G.H.T was funded by the European 12. Cardillo, M., Mace, G.M., Gittleman, J.L., Jones, K.E., Bielby, J., and
Research Council (grant number 615709 project ‘‘ToLERates’’) and a Royal Purvis, A. (2008). The predictability of extinction: biological and external
Society University Research Fellowship (UF120016 and URF\R\180006). correlates of decline in mammals. Proc. Biol. Sci. 275, 1441–1448.
https://doi.org/10.1098/rspb.2008.0179.
13. Lee, T.M., and Jetz, W. (2011). Unravelling the structure of species extinc-
AUTHOR CONTRIBUTIONS tion risk for predictive conservation science. Proc. Biol. Sci. 278, 1329–
1338. https://doi.org/10.1098/rspb.2010.1877.
E.C.H., D.P.E., and G.H.T. conceived the ideas and designed methodology;
14. Ripple, W.J., Wolf, C., Newsome, T.M., Hoffmann, M., Wirsing, A.J., and
E.C.H. and G.H.T., collected data from museum specimens and designed
McCauley, D.J. (2017). Extinction risk is most acute for the world’s largest
analytical protocols for producing the beak shape dataset; E.C.H. analyzed
and smallest vertebrates. Proc. Natl. Acad. Sci. USA 114, 10678–10683.
the data and led the writing of the manuscript. All authors contributed critically
https://doi.org/10.1073/pnas.1702078114.
to the drafts and gave final approval for publication.
15. Cooke, R.S.C., Eigenbrod, F., and Bates, A.E. (2019). Projected losses of
global mammal and bird ecological strategies. Nat. Commun. 10, 2279.
DECLARATION OF INTERESTS https://doi.org/10.1038/s41467-019-10284-z.
16. Pigot, A.L., Trisos, C.H., and Tobias, J.A. (2016). Functional traits reveal
The authors declare no competing interests. the expansion and packing of ecological niche space underlying an
Current Biology 32, 3830–3837, September 12, 2022 3835ll
OPEN ACCESS Report
elevational diversity gradient in passerine birds. Proc. Biol. Sci. 283, 35. Cooney, C.R., Bright, J.A., Capp, E.J.R., Chira, A.M., Hughes, E.C.,
20152013. https://doi.org/10.1098/rspb.2015.2013. Moody, C.J.A., Nouri, L.O., Varley, Z.K., and Thomas, G.H. (2017).
17. Chira, A.M., Cooney, C.R., Bright, J.A., Capp, E.J.R., Hughes, E.C., Mega-evolutionary dynamics of the adaptive radiation of birds. Nature
Moody, C.J.A., Nouri, L.O., Varley, Z.K., and Thomas, G.H. (2018). 542, 344–347. https://doi.org/10.1038/nature21074.
Correlates of rate heterogeneity in avian ecomorphological traits. Ecol. 36. Kelly, S., Grenyer, R., and Scotland, R.W. (2014). Phylogenetic trees do
Lett. 21, 1505–1514. https://doi.org/10.1111/ele.13131. not reliably predict feature diversity. Divers. Distrib. 20, 600–612. https://
18. Pigot, A.L., Sheard, C., Miller, E.T., Bregman, T.P., Freeman, B.G., Roll, U., doi.org/10.1111/ddi.12188.
Seddon, N., Trisos, C.H., Weeks, B.C., and Tobias, J.A. (2020). 37. Mazel, F., Pennell, M.W., Cadotte, M.W., Diaz, S., Dalla Riva, G.V.,
Macroevolutionary convergence connects morphological form to ecolog- Grenyer, R., Leprieur, F., Mooers, A.O., Mouillot, D., Tucker, C.M., and
ical function in birds. Nature Ecology Evolution 4, 230–239. https://doi.org/ Pearse, W.D. (2018). Prioritizing phylogenetic diversity captures functional
10.1038/s41559-019-1070-4. diversity unreliably. Nat. Commun. 9, 2888. https://doi.org/10.1038/
19. IUCN (2020). The IUCN Red List of threatened species. http://www. s41467-018-05126-3.
iucnredlist.org. 38. McLean, M., Stuart-Smith, R.D., Ville ger, S., Auber, A., Edgar, G.J.,
, E., and Legendre, P. (2010). A distance-based framework for
20. Laliberte MacNeil, M.A., Loiseau, N., Leprieur, F., and Mouillot, D. (2021). Trait sim-
measuring functional diversity from multiple traits. Ecology 91, 299–305. ilarity in reef fish faunas across the world’s oceans. Proc. Natl. Acad. Sci.
https://doi.org/10.1890/08-2244.1. USA 118. e2012318118. https://doi.org/10.1073/pnas.2012318118.
21. Gaston, K.J., and Blackburn, T.M. (1995). Birds, body size and the threat of 39. Sheard, C., Neate-Clegg, M.H.C., Alioravainen, N., Jones, S.E.I., Vincent,
extinction. Phil. Trans. R. Soc. Lond. B 347, 205–212. https://doi.org/10. C., MacGregor, H.E.A., Bregman, T.P., Claramunt, S., and Tobias, J.A.
1098/rstb.1995.0022. (2020). Ecological drivers of global gradients in avian dispersal inferred
from wing morphology. Nat. Commun. 11, 2463. https://doi.org/10.
22. Purvis, A., Gittleman, J.L., Cowlishaw, G., and Mace, G.M. (2000).
1038/s41467-020-16313-6.
Predicting extinction risk in declining species. Proc. Biol. Sci. 267,
1947–1952. https://doi.org/10.1098/rspb.2000.1234. 40. Davies, T.J. (2019). The macroecology and macroevolution of plant spe-
cies at risk. New Phytol. 222, 708–713. https://doi.org/10.1111/nph.
23. Murali, G., Gumbs, R., Meiri, S., and Roll, U. (2021). Global determinants
15612.
and conservation of evolutionary and geographic rarity in land vertebrates.
Sci. Adv. 7, eabe5582. https://doi.org/10.1126/sciadv.abe5582. 41. Harfoot, M.B.J., Johnston, A., Balmford, A., Burgess, N.D., Butchart,
S.H.M., Dias, M.P., Hazin, C., Hilton-Taylor, C., Hoffmann, M., Isaac,
24. Vamosi, J.C., and Wilson, J.R.U. (2008). Nonrandom extinction leads to
N.J.B., et al. (2021). Using the IUCN Red List to map threats to terrestrial
elevated loss of angiosperm evolutionary history. Ecol. Lett. 11, 1047–
vertebrates at global scale. Nat. Ecol. Evol. 5, 1510–1519. https://doi.org/
1053. https://doi.org/10.1111/j.1461-0248.2008.01215.x.
10.1038/s41559-021-01542-9.
25. Safi, K., Cianciaruso, M.V., Loyola, R.D., Brito, D., Armour-Marshall, K.,
42. Olson, D.M., Dinerstein, E., Wikramanayake, E.D., Burgess, N.D., Powell,
and Diniz-Filho, J.A.F. (2011). Understanding global patterns of mamma-
G.V.N., Underwood, E.C., D’amico, J.A., Itoua, I., Strand, H.E., Morrison,
lian functional and phylogenetic diversity. Phil. Trans. Biol. Sci. 366,
J.C., et al. (2001). Terrestrial Ecoregions of the World: A New Map of Life
2536–2544. https://doi.org/10.1098/rstb.2011.0024.
on Earth: A new global map of terrestrial ecoregions provides an innovative
26. Voskamp, A., Baker, D.J., Stephens, P.A., Valdes, P.J., and Willis, S.G. tool for conserving biodiversity. Bioscience 51, 933–938. https://doi.org/
(2017). Global patterns in the divergence between phylogenetic diversity 10.1641/0006-3568(2001)051[0933:TEOTWA]2.0.CO;2.
and species richness in terrestrial birds. J. Biogeogr. 44, 709–721.
43. Birdlife International. (2020). Data Zone. http://www.datazone.birdlife.org.
https://doi.org/10.1111/jbi.12916.
44. Sayol, F., Cooke, R.S.C., Pigot, A.L., Blackburn, T.M., Tobias, J.A.,
27. Wiens, J.J., and Graham, C.H. (2005). Niche Conservatism: Integrating Steinbauer, M.J., Antonelli, A., and Faurby, S. (2021). Loss of functional di-
Evolution, Ecology, and Conservation Biology. Annu. Rev. Ecol. Evol. versity through anthropogenic extinctions of island birds is not offset by bi-
Syst. 36, 519–539. https://doi.org/10.1146/annurev.ecolsys.36.102803. otic invasions. Sci. Adv. 7, eabj5790. https://doi.org/10.1126/sciadv.
095431. abj5790.
28. Felsenstein, J. (1985). Phylogenies and the Comparative Method. Am. Nat. 45. Bright, J.A., Marugán-Lobón, J., Cobb, S.N., and Rayfield, E.J. (2016). The
125, 1–15. https://doi.org/10.1086/284325. shapes of bird beaks are highly controlled by nondietary factors. Proc.
29. Redding, D.W., DeWOLFF, C.V., and Mooers, A.Ø. (2010). Evolutionary Natl. Acad. Sci. USA 113, 5352–5357. https://doi.org/10.1073/pnas.
Distinctiveness, Threat Status, and Ecological Oddity in Primates. 1602683113.
Conserv. Biol. 24, 1052–1058. https://doi.org/10.1111/j.1523-1739.2010. lu, Ç.H. (2016). The avian scavenger crisis:
46. Buechley, E.R., and Sxekerciog
01532.x. Looming extinctions, trophic cascades, and loss of critical ecosystem
30. Chira, A.M., and Thomas, G.H. (2016). The impact of rate heterogeneity on functions. Biol. Conserv. 198, 220–228. https://doi.org/10.1016/j.biocon.
inference of phylogenetic models of trait evolution. J. Evol. Biol. 29, 2502– 2016.04.001.
2518. https://doi.org/10.1111/jeb.12979. 47. DeVault, T.L., Beasley, J.C., Olson, Z.H., Moleón, M., Carrete, M.,
31. Harmon, L.J., Losos, J.B., Jonathan Davies, T., Gillespie, R.G., Gittleman, Margalida, A., and Sánchez-Zapata, J.A. (2016). Ecosystem Services
J.L., Bryan Jennings, W., Kozak, K.H., McPeek, M.A., Moreno-Roark, F., Provided by Avian Scavengers. In Why Birds Matter: Avian Ecological
Near, T.J., et al. (2010). Early Bursts of Body Size and Shape Evolution Function and Ecosystem Services, Ç. Sekercioglu, D.G. Wenny, and
Are Rare in Comparative Data. Evolution 64, 2385–2396. https://doi.org/ C.J. Whelan, eds. (University of Chicago Press), pp. 235–270. https://
10.1111/j.1558-5646.2010.01025.x. doi.org/10.7208/9780226382777.
32. O’Meara, B.C., Ane , C., Sanderson, M.J., and Wainwright, P.C. (2006). 48. Moleón, M., Sánchez-Zapata, J.A., Margalida, A., Carrete, M., Owen-
Testing for Different Rates of Continuous Trait Evolution Using Smith, N., and Donázar, J.A. (2014). Humans and Scavengers: The
Likelihood. Evolution 60, 922–933. https://doi.org/10.1111/j.0014-3820. Evolution of Interactions and Ecosystem Services. Bioscience 64,
2006.tb01171.x. 394–403. https://doi.org/10.1093/biosci/biu034.
33. Venditti, C., Meade, A., and Pagel, M. (2011). Multiple routes to mamma- 49. Ogada, D.L., Torchin, M.E., Kinnaird, M.F., and Ezenwa, V.O. (2012).
lian diversity. Nature 479, 393–396. https://doi.org/10.1038/nature10516. Effects of vulture declines on facultative scavengers and potential implica-
34. Losos, J.B. (2008). Phylogenetic niche conservatism, phylogenetic signal tions for mammalian disease transmission. Conserv. Biol. 26, 453–460.
and the relationship between phylogenetic relatedness and ecological https://doi.org/10.1111/j.1523-1739.2012.01827.x.
similarity among species. Ecol. Lett. 11, 995–1003. https://doi.org/10. 50. Markandya, A., Taylor, T., Longo, A., Murty, M.N., Murty, S., and Dhavala,
1111/j.1461-0248.2008.01229.x. K. (2008). Counting the cost of vulture decline—An appraisal of the human
3836 Current Biology 32, 3830–3837, September 12, 2022ll
Report OPEN ACCESS
health and other benefits of vultures in India. Ecol. Econ. 67, 194–204. 61. Morton, O., Scheffers, B.R., Haugaasen, T., and Edwards, D.P. (2021).
https://doi.org/10.1016/j.ecolecon.2008.04.020. Impacts of wildlife trade on terrestrial biodiversity. Nat Ecol Evol 5,
51. Jetz, W., Thomas, G.H., Joy, J.B., Redding, D.W., Hartmann, K., and 540–548. https://doi.org/10.1038/s41559-021-01399-y.
Mooers, A.O. (2014). Global distribution and conservation of evolutionary 62. Hughes, E.C., Edwards, D.P., and Thomas, G.H. (2022). Data from: The
distinctness in birds. Curr. Biol. 24, 919–930. https://doi.org/10.1016/j. homogenisation of avian morphological and phylogenetic diversity under
cub.2014.03.011. the global extinction crisis (The University of Sheffield). Dataset. ORDA
52. EDGE of Existence (2022). Top 100 EDGE Birds. http://www. provided by Figshare. https://doi.org/10.15131/shef.data.20004806.v1.
edgeofexistence.org/birds/. 63. Core Team, R. (2021). R: A language and environment for statistical
53. IPBES (2019). In Global assessment report on biodiversity and ecosystem computing (R Foundation for Statistical Computing).
services of the Intergovernmental Science-Policy Platform on Biodiversity 64. RStudio Team (2021). RStudio: Integrated Development for R (RStudio,
and Ecosystem Services, E.S. Brondizio, J. Settele, S. Dı́az, and H.T. Ngo, PBC).
eds. (IPBES Secretariat), p. 1148. https://doi.org/10.5281/zenodo. 65. Jetz, W., Thomas, G.H., Joy, J.B., Hartmann, K., and Mooers, A.O. (2012).
3831673. The global diversity of birds in space and time. Nature 491, 444–448.
54. Petchey, O.L., and Gaston, K.J. (2006). Functional diversity: back to ba- https://doi.org/10.1038/nature11631.
sics and looking forward. Ecol. Lett. 9, 741–758. https://doi.org/10.1111/ 66. Wilman, H., Belmaker, J., Simpson, J., de la Rosa, C., Rivadeneira, M.M.,
j.1461-0248.2006.00924.x. and Jetz, W. (2014). EltonTraits 1.0: Species-level foraging attributes of the
55. Faith, D.P. (2008). Threatened Species and the Potential Loss of world’s birds and mammals. Ecology 95, 2027. https://doi.org/10.1890/
Phylogenetic Diversity: Conservation Scenarios Based on Estimated 13-1917.1.
Extinction Probabilities and Phylogenetic Risk Analysis. Conserv. Biol. 67. Guillerme, T. (2018). dispRity: A modular R package for measuring
22, 1461–1470. https://doi.org/10.1111/j.1523-1739.2008.01068.x. disparity. Methods Ecol. Evol. 9, 1755–1763. https://doi.org/10.1111/
56. Flynn, D.F.B., Mirotchnick, N., Jain, M., Palmer, M.I., and Naeem, S. 2041-210X.13022.
(2011). Functional and phylogenetic diversity as predictors of biodiver- 68. Tsirogiannis, C., and Sandel, B. (2016). PhyloMeasures: a package for
sity–ecosystem-function relationships. Ecology 92, 1573–1581. https:// computing phylogenetic biodiversity measures and their statistical mo-
doi.org/10.1890/10-1245.1. ments. Ecography 39, 709–714. https://doi.org/10.1111/ecog.01814.
57. Blackburn, T.M., Bellard, C., and Ricciardi, A. (2019). Alien versus native 69. Hackett, S.J., Kimball, R.T., Reddy, S., Bowie, R.C.K., Braun, E.L., Braun,
species as drivers of recent extinctions. Front. Ecol. Environ. 17, M.J., Chojnowski, J.L., Cox, W.A., Han, K.L., Harshman, J., Huddleston,
203–207. https://doi.org/10.1002/fee.2020. C.J., Marks, B.D., Miglia, K.J., Moore, W.S., Sheldon, F.H., Steadman,
58. Socolar, J.B., Gilroy, J.J., Kunin, W.E., and Edwards, D.P. (2016). How D.W., Witt, C.C., Yuri, T., and Harshman, J. (2008). A phylogenomic study
should beta-diversity inform biodiversity conservation? Trends Ecol. of birds reveals their evolutionary history. Science 320, 1763–1768.
Evol. 31, 67–80. https://doi.org/10.1016/j.tree.2015.11.005. https://doi.org/10.1126/science.1157704.
59. Yang, Q., Weigelt, P., Fristoe, T.S., Zhang, Z., Kreft, H., Stein, A., Seebens, 70. Puttick, M.N., Ingram, T., Clarke, M., and Thomas, G.H. (2020). MOTMOT:
H., Dawson, W., Essl, F., König, C., et al. (2021). The global loss of floristic Models of trait macroevolution on trees (an update). Methods Ecol. Evol.
uniqueness. Nat. Commun. 12, 7290. https://doi.org/10.1038/s41467- 11, 464–471. https://doi.org/10.1111/2041-210X.13343.
021-27603-y. 71. Pagel, M. (1997). Inferring evolutionary processes from phylogenies.
60. Anderson, S.H., Kelly, D., Ladley, J.J., Molloy, S., and Terry, J. (2011). Zool. Scripta 26, 331–348. https://doi.org/10.1111/j.1463-6409.1997.
Cascading Effects of Bird Functional Extinction Reduce Pollination and tb00423.x.
Plant Density. Science 331, 1068–1071. https://doi.org/10.1126/science. 72. Pagel, M. (1999). Inferring the historical patterns of biological evolution.
1199092. Nature 401, 877–884. https://doi.org/10.1038/44766.
Current Biology 32, 3830–3837, September 12, 2022 3837ll
OPEN ACCESS Report
STAR+METHODS
KEY RESOURCES TABLE
REAGENT or RESOURCE SOURCE IDENTIFIER
Deposited data
Original data and code Hughes et al.62 https://doi.org/10.15131/shef.data.20004806.v1
Software and algorithms
R Version 4.1.1 The R Foundation for Statistical Computing63 https://cran.r-project.org
R Studio Version 1.4.1717 RStudio64 https://rstudio.com/products/rstudio/download/
Other
Global bird species distribution maps Birdlife International43 http://datazone.birdlife.org/home
Avian taxonomy Wilman et al.65 http://birdtree.org/
IUCN Red List categories IUCN19 https://www.iucnredlist.org/
Bird traits Hughes et al.9 and Wilman et al.66 https://doi.org/10.15131/ shef.data.16733224
https://esapubs.org/archive/
Terrestrial biome and ecoregion Olson et al.42 https://www.sciencebase.gov/catalog/item/
polygons 508fece8e4b0a1b43c29ca22
RESOURCE AVAILABILITY
Lead contact
Further information and requests for resources should be directed to and will be fulfilled by the lead contact, Emma Hughes
(echughes8@gmail.com).
Materials availability
This study did not generate new unique reagents.
Data and code availability
Original datasets and code supporting the results are available in the University of Sheffield’s ORDA repository, provided by figshare:
https://doi.org/10.15131/shef.data.20004806.v1.
EXPERIMENTAL MODEL AND SUBJECT DETAILS
Morphological trait space
We used a raw dataset of ecologically relevant morphological traits from Hughes et al. 20229 for 8455 of 9993 bird species. Our
selected traits include the main seven principal components of beak shape (accounting for 98.9% of the total variation in beak shape)
and bill size (centroid size) derived from 3D scans of museum specimens,9,17,35 and tarsus length (mm) and wing length (mm) taken
from the corresponding museum specimens.9 In addition, body size (g) was taken from the EltonTraits database.66 These types of
morphological traits have been closely linked to avian dietary and foraging ecology.16,18 Bill size, wing length, tarsus length and body
size were log10-transformed, and all trait data were then centred and re-scaled by standardising each to a mean of zero and unit
variance (z-transformation). Finally, a principal components analysis (PCA) was run on the traits, and we selected the first eight
PC axes (96.1% of total variation) from the resultant morphospace for analysis. Loadings for each individual trait on each principal
component are provided in Table S2.
Threat status
We used data from the IUCN Red List,19 to obtain threat statuses for each species with complete trait data (n = 8489), following the
BirdTree65 taxonomy used in our dataset. Species categorised as Data Deficient (DD) (n = 20), Extinct in the Wild (EW)/ Extinct (EX)
(n = 4) or Critically Endangered (Possibly Extinct) (CR(PE)) (n = 9) were excluded from our dataset. Where a species under the BirdTree
taxonomy was listed as multiple species in the IUCN Red List taxonomy, we assigned the mean categorisation value. The resultant
dataset contained 8455 species, with 6731 categorised as Least Concern (LC), 812 as Near Threatened (NT), 527 as Vulnerable (VU),
274 as Endangered (EN), and 111 as Critically Endangered (CE).
e1 Current Biology 32, 3830–3837.e1–e3, September 12, 2022ll
Report OPEN ACCESS
Species pools
We defined a global pool of 8455 extant species with complete trait and threat status data. To account for regional and local spatial
scales, we also generated species pools for 14 biomes and 814 ecoregions,42 excluding ‘‘Lake’’ and ‘‘Rock and Ice’’ categorisations.
To do this, we obtained global breeding and resident distribution maps for all extant and probably extant species in our dataset from
BirdLife International,43 and projected these, as well as a spatial layer of ecoregions, onto a 100 km x 100 km equal area grid under
Behrman cylindrical equal-area projection. Next, we recorded the presence/ absence of each species, and the dominant ecoregion in
each grid cell. As each ecoregion exists in only one biome, we further matched biome identity to each grid cell. All 8384 species
across 820 ecoregions and 14 biomes were categorised in this way, and for each ecoregion and biome we extracted a species
list. Forty-two species that were not categorised during this process as a result of very small distributions, were manually assigned
to the correct biomes and ecoregions. Due to the dimensionality of the trait data, at least nine species are needed for trait space
calculations and thus six ecoregions with fewer than nine species were removed from our dataset. Three species were found exclu-
sively in one of the removed ecoregions, and these were also dropped from our ecoregion species pools. Therefore, our final fourteen
biome and 814 ecoregion species pools comprised 8426 and 8423 of 9993 (84.3%) species, respectively, with complete trait, con-
servation status, and range data present.
METHOD DETAILS
Avian morphological and phylogenetic diversity measures
Our analyses were carried out at a global scale (across all 8455 bird species), regional scales (within biomes), and local scales (within
ecoregions).
For each species pool, we first calculated the mean distance to centroid (i.e., the mean Euclidean distance from the morphospace
centroid, also known as Functional Dispersion20), as a measure of morphospace size using the dispaRity R package (version 1.6.0).67
Next, we sequentially dropped species from the most to least threatened IUCN category (CR > EN > VU > NT) and re-calculated the
mean distance to centroid for the remaining species. Our focus was to examine changes in morphospace size as threatened species
were lost from their respective pools. A reduction in morphospace size (i.e., a lower mean distance to centroid) is indicative of
morphological homogenisation as species with more unique trait combinations than average are lost. We note that increases in
mean distance to centroid can occur where species are primarily lost from the centre of morphospace. In addition, species could
be lost such that no change in mean distance to centroid occurs. We therefore stress that this should not be used as evidence
that species loss in these areas is not of conservation concern. Identifying significant incidences of morphological diversity loss is
of crucial importance, alongside species loss, as the ecological consequences of morphological homogenisation are a particular
conservation concern.
To account for phylogenetic uncertainty, we calculated phylogenetic diversity3 on all 200 phylogenetic trees65 for each species
pool using the function pd.query in the R package PhyloMeasures (version 2.1).68 Phylogenetic diversity calculations were repeated
for each species pool after sequentially dropping species from each IUCN category (CR, EN, VU, NT).
QUANTIFICATION AND STATISTICAL ANALYSIS
All data quantification, analysis and visualisation were conducted in RStudio64 version 1.4.1717 and R63 version 4.1.1.
Phylogenetic signal across morphological traits
To assess the potential for decoupling of morphological diversity from phylogenetic history, we tested for multivariate phylogenetic
signal across our morphological traits. We downloaded 200 complete species-level phylogenetic trees based on the Hackett back-
bone69 from http://birdtree.org/ and65 pruned each so that it only consisted of species in our dataset. We then used the transform-
Phylo.ML function in the R package MOTMOT (version 2.1.3)70 to calculate the multivariate phylogenetic signal (Pagels l
(lambda)71,72) of our eight PCs across every tree (n=200) (See results and discussion and Figure S1). A value of 1 shows high and
a value of 0 shows no phylogenetic signal in traits.
Simulating the impact of threatened species loss on morphological and phylogenetic diversity
As morphological and phylogenetic diversity correlate with species richness,9,25,26 we constructed null models to test whether the
species remaining after losing each IUCN category had mean distance to centroid and phylogenetic diversity values that deviated
from expected given the observed species richness. To do this, we sampled 1000 null assemblages for each value of species rich-
ness after losing CR, EN, VU, and finally NT species. For the global analysis, species sampled could be from the whole avian class; for
each biome, species could be drawn from that focal biome species pool; and for each ecoregion, species were sampled from that
focal ecoregion pool. For each of the 1000 null assemblages, we calculated the mean distance to centroid, before calculating the
mean and standard deviation of these 1000 values. Next, we calculated the standard effect size (SES) for each global (Figure 2),
biome (Figure 3), and ecoregion (Figure 4) community, by taking the null mean distance to centroid from the observed mean distance
to centroid and dividing by the standard deviation of the null values:
Current Biology 32, 3830–3837.e1–e3, September 12, 2022 e2ll
OPEN ACCESS Report
observed meanðnullÞ
SES =
sdðnullÞ
We followed the same protocol to calculate the SES for phylogenetic diversity. SES scores were calculated for each of the phylo-
genetic trees (n=200),65 and we took the average SES score for each global (Figure 2), biome (Figure 3), and ecoregion (Figure 4)
community after losing each IUCN threat category. A positive SES value indicates a higher mean distance to centroid or phylogenetic
diversity value than expected, whereas a negative SES indicates a lower value. Exceptional values of mean distance to centroid and
phylogenetic diversity were those that showed statistically significant deviation from expected (+/- 2), with exceptionally negative
values (< -2) indicating morphological or phylogenetic homogenisation of communities above that expected from species loss alone.
e3 Current Biology 32, 3830–3837.e1–e3, September 12, 2022You can also read