Clustering diurnal cycles of day-to-day temperature change to understand their impacts on air quality forecasting in mountain-basin areas
←
→
Page content transcription
If your browser does not render page correctly, please read the page content below
Atmos. Chem. Phys., 21, 14493–14505, 2021
https://doi.org/10.5194/acp-21-14493-2021
© Author(s) 2021. This work is distributed under
the Creative Commons Attribution 4.0 License.

Clustering diurnal cycles of day-to-day temperature change
to understand their impacts on air quality forecasting in
mountain-basin areas
Debing Kong1,2 , Guicai Ning3,4 , Shigong Wang3,5 , Jing Cong6 , Ming Luo4,7 , Xiang Ni1,2 , and Mingguo Ma1,2
1 Chongqing    Jinfo Mountain Karst Ecosystem National Observation and Research Station, School of Geographical Sciences,
Southwest University, Chongqing, 400715, China
2 Chongqing Engineering Research Center for Remote Sensing Big Data Application, School of Geographical Sciences,

Southwest University, Chongqing, 400715, China
3 The Gansu Key Laboratory of Arid Climate Change and Reducing Disaster, College of Atmospheric Sciences,

Lanzhou University, Lanzhou 730000, China
4 Institute of Environment, Energy and Sustainability, The Chinese University of Hong Kong, Shatin, N.T., Hong Kong, China
5 Sichuan Key Laboratory for Plateau Atmosphere and Environment, School of Atmospheric Sciences, Chengdu University of

Information Technology, Chengdu 610225, China
6 Tianjin Municipal Meteorological Observatory, Tianjin 300074, China
7 School of Geography and Planning, Guangdong Key Laboratory for Urbanization and Geo-simulation,

Sun Yat-sen University, Guangzhou 510275, China

Correspondence: Guicai Ning (ninggc09@lzu.edu.cn)

Received: 7 February 2021 – Discussion started: 26 March 2021
Revised: 1 August 2021 – Accepted: 4 August 2021 – Published: 30 September 2021

Abstract. Air pollution is substantially modulated by mete-      noon seems to improve air quality on the following day by
orological conditions, and especially their diurnal variations   enhancing the atmospheric-dispersion conditions on the fol-
may play a key role in air quality evolution. However, the be-   lowing day. The findings reported here are critical to improve
haviors of temperature diurnal cycles along with the associ-     the understanding of air pollution in mountain-basin areas
ated atmospheric condition and their effects on air quality in   and exhibit promising potential for air quality forecasting.
China remain poorly understood. Here, for the first time, we
examine the diurnal cycles of day-to-day temperature change
and reveal their impacts on winter air quality forecasting in
mountain-basin areas. Three different diurnal cycles of the      1   Introduction
preceding day-to-day temperature change are identified and
exhibit notably distinct effects on the day-to-day changes in    Air pollution is not only affected by anthropogenic emis-
atmospheric-dispersion conditions and air quality. The diur-     sions (Streets et al., 2001; Zhang et al., 2009; Kelly and
nal cycle with increasing temperature obviously enhances the     Zhu, 2016) but also controlled by atmospheric-dispersion
atmospheric stability in the lower troposphere and suppresses    conditions (Wei et al., 2011; Li et al., 2015; Ye et al., 2016;
the development of the planetary boundary layer, thus deteri-    Zhang et al., 2020). Stagnant meteorological conditions sig-
orating the air quality on the following day. By contrast, the   nificantly contribute to the formation and maintenance of
diurnal cycle with decreasing temperature in the morning is      heavy air pollution as they play important roles in regulat-
accompanied by a worse dispersion condition with more sta-       ing the increment of air pollutant concentrations (Deng et
ble atmosphere stratification and weaker surface wind speed,     al., 2014; Bei et al., 2016; Zhang et al., 2016; Wang et al.,
thereby substantially worsening the air quality. Conversely,     2018). It is noted that atmospheric-dispersion capacity is sub-
the diurnal cycle with decreasing temperature in the after-      stantially modulated by synoptic patterns, and hence the evo-

Published by Copernicus Publications on behalf of the European Geosciences Union.
14494 D. Kong et al.: Diurnal cycles of temperature changes and their effects on air quality
lutions of large-scale synoptic systems can lead to the im-
provement or deterioration of air quality (Yarnal, 1993; Miao
et al., 2017; Ning et al., 2019, 2020; Dong et al., 2020). In
China, high anthropogenic emissions from coal-fired heating
(Xiao et al., 2015), frequent temperature inversion (Xu et al.,
2019; Feng et al., 2020; Guo et al., 2020), and shallow plan-
etary boundary layer (PBL) structure (Li et al., 2017; Miao
et al., 2018; Su et al., 2020) result in frequent occurrence of
heavy-air-pollution events in winter. These factors highlight
the significance of further revealing the physical mechanism
of atmospheric-dispersion evolutions.
The behaviors of diurnal cycles of atmospheric-dispersion
conditions and their effects on air quality remain poorly
understood, although air pollution significantly modulated
by atmospheric-dispersion conditions has been well demon-
strated. For instance, as a typical synoptic process occur-
ring in winter in China, the cooling process could cause
rapid changes in meteorological and environmental condi-
tions. Cooling processes induce significant day-to-day tem-
perature variations and thus result in substantial changes in
air quality (Hu et al., 2018; Ning et al., 2018b; Kang et al.,
2019). Many previous studies revealed that cooling processes
could remove air pollutants by invading lots of cold fresh air-
flows (Kalkstein and Corrigan, 1986; Gimson, 1994; Hu et
al., 2018; Ning et al., 2018b) or exacerbate air pollution by
transporting air pollutants (Fu et al., 2008; Ding et al., 2013;
Luo et al., 2018; Kang et al., 2019). Nevertheless, most of
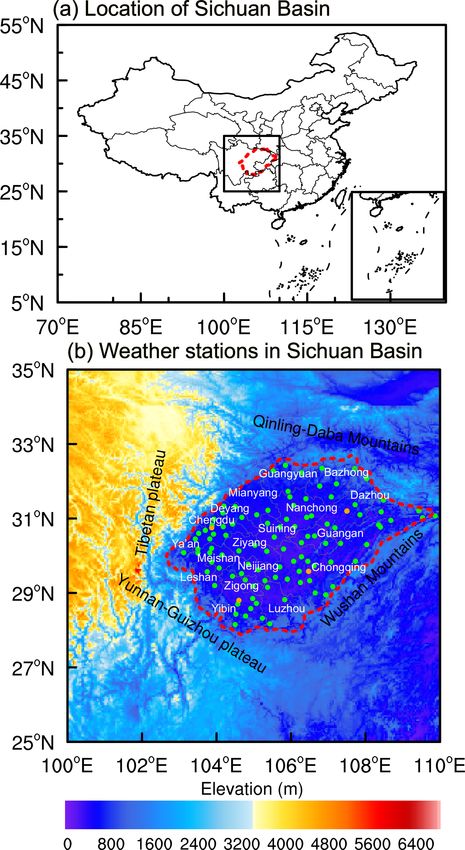
these studies did not consider the influences of diurnal cy- Figure 1. Map of the Sichuan Basin (SCB) in Southwest China.
cles of cooling processes on air quality. Are the influences of (a) Location of the SCB, (b) topography of the SCB (shading) and
cooling processes occurring during daytime and nighttime on the spatial distribution of 105 meteorological stations (dots) in the
air quality similar or different? There are two key questions. SCB. The dashed red line indicates the border of the SCB. The or-
The first one is what the behaviors of the diurnal cycles of ange dots indicate the meteorological stations with radiosonde mea-
surements. The white text indicates the name of the major cities in
atmospheric-dispersion conditions are, and the second one is
the SCB.
how these behaviors affect air quality, especially how the di-
urnal cycles of day-to-day temperature change affect air pol-
lution. Exploring the answers to these questions is critical for
fully understanding winter air pollution and is also urgently both the physical mechanism of atmospheric conditions’ ef-
needed for improving air quality forecasting in China. fects on air pollution and the air quality forecasting in the
The Sichuan Basin (SCB) is one of the areas with the SCB are more complicated than these in the eastern plain re-
heaviest air pollution in China (Zhang et al., 2012; Ning gions of China (Chen and Xie, 2012; Wang et al., 2014; Ning
et al., 2018a). With a high population density in the SCB, et al., 2019; Zhang et al., 2019). To better understand the
its heavy air pollution thus poses serious health hazards to formation mechanism of air pollution and improve air qual-
residents (Liao et al., 2017; Qiu et al., 2018; Zhu et al., ity forecasting in mountain-basin areas, the effects of diurnal
2018; Zhao et al., 2018). It is noted that the SCB has a variations in atmospheric-dispersion conditions on winter air
unique topography, with Qinling-Daba and Wu mountains quality in the SCB call for urgent examinations.
in the north and east and with Qinghai–Tibet Plateau and The scientific goals of this study are to first cluster the
Yunnan–Guizhou Plateau in the west and south of the basin typical diurnal cycles of day-to-day temperature change in
(Fig. 1). The combination of this complex topography re- the SCB during wintertime and then to examine the mecha-
sults in unique weather and climate, like the southwest vor- nisms underlying the effects of the identified typical diurnal
tex, the Huaxi autumn rain season, etc. The southwest vortex, cycles on the following day-to-day air quality changes. We
southern branch, and Qinghai–Tibet high pressure are often expect our study to help in better understanding the physi-
formed over the SCB or the Tibetan Plateau, and the complex cal mechanism of air quality evolutions and improve air pol-
synoptic systems significantly affect atmospheric-dispersion lution forecasting in mountain-basin areas. The rest of this
conditions (Wang et al., 1993; Wei et al., 2014; Feng et al., paper is organized as below. Data and methodology are in-
2016; Yu et al., 2016; Ning et al., 2019, 2020). Therefore, troduced in Sect. 2. Section 3 describes the results of our
Atmos. Chem. Phys., 21, 14493–14505, 2021 https://doi.org/10.5194/acp-21-14493-2021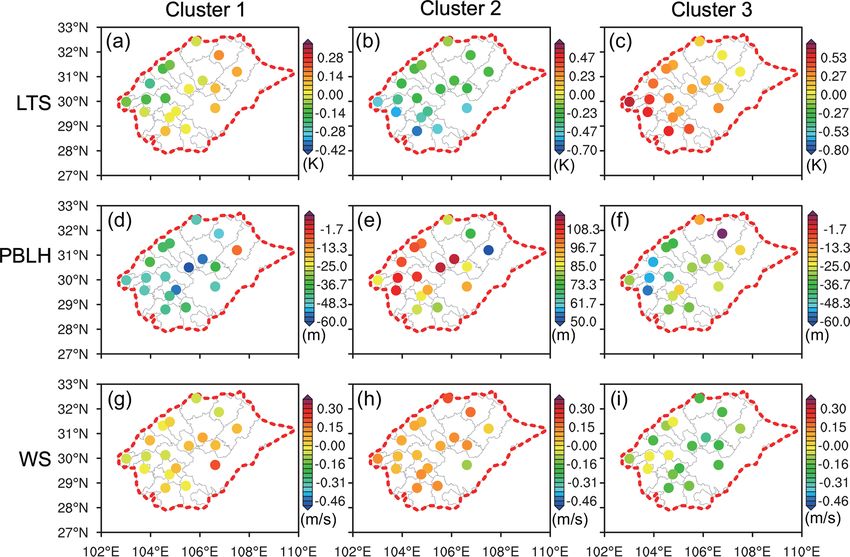
D. Kong et al.: Diurnal cycles of temperature changes and their effects on air quality                                   14495

study. Discussion related to our findings is given in Sect. 4.    pressure and air temperature at 2 m above the ground, to-
Our conclusions are summarized in Sect. 5.                        tal cloud cover, u-component wind, and vertical velocity
                                                                  (w) at multiple pressure levels from December 2014 to
                                                                  February 2020 are collected from daily ERA-5 reanalysis
2     Data and methodology                                        data (0.25◦ × 0.25◦ grids) (https://cds.climate.copernicus.eu/
                                                                  #!/search?text=ERA5, last access: 22 January 2020). We col-
2.1    Air quality data                                           lect the reanalysis data at four times each day (00:00, 06:00,
                                                                  12:00, and 18:00 UTC) to calculate their daily mean values.
Hourly concentrations of surface PM2.5 (particulate matter
                                                                  The PBL height (PBLH) data at 06:00 UTC (14:00 BJT) are
with an aerodynamic diameter equal to or less than 2.5 µm),
                                                                  also obtained. PBLH is defined as the lowest model level
PM10 (particulate matter with an aerodynamic diameter
                                                                  where the bulk Richardson number first reaches the threshold
equal to or less than 10 µm), SO2 (sulfur dioxide), NO2
                                                                  value of 0.25 (Beljaars, 2006).
(nitrogen dioxide), and CO (carbon monoxide) in the win-
ters (December–February) from December 2014 to February           2.4     Quantitative measurements of meteorological and
2020 in 18 cities of the SCB (Fig. 1) are obtained from the               air quality variables
Ministry of Ecology and Environment of the People’s Re-
public of China (http://www.mee.gov.cn/xxgk2018/, last ac-        2.4.1    Lower-troposphere stability
cess: 22 January 2020). We calculate the city-wide average
concentrations of the five air pollutants by arithmetically av-   The lower-troposphere stability (LTS) is defined as the dif-
eraging their concentration at the national air quality moni-     ferences in potential temperature between 700 hPa and the
toring sites located in the urban areas of that city based on     surface (Slingo, 1987). LTS can describe the thermal state
the technical regulation for ambient air quality assessment       of the lower troposphere and thus can evaluate the vertical
(on trial) (MEP, 2013; Ning et al., 2020). Among the 18           mixing of air pollutants in the lower troposphere (Guo et al.,
cities in the SCB, 10 (Leshan, Meishan, Ziyang, Guangyuan,        2016a, b). A larger LTS indicates a stronger stability in the
Bazhong, Ya’an, Dazhou, Suining, Guang’an, and Neijiang)          lower troposphere and a weaker vertical mixing of air pollu-
began monitoring air quality on 1 January 2015. Hence, the        tants.
starting date of air quality data for these 10 cities is 1 De-
cember 2015. The starting date of air quality data for the re-    2.4.2    Day-to-day changes in meteorological conditions
maining eight cities (Chengdu, Deyang, Mianyang, Zigong,                   and air quality
Yibin, Luzhou, Nanchong, and Chongqing) is 1 December
2014.                                                             The day-to-day temperature change for each hour of a given
                                                                  day is defined by the hourly temperature differences between
2.2    Meteorological observational data                          two neighboring days (Karl et al., 1995):

Hourly winter surface temperature data observed at 105 me-        T = Ti − Ti−1 ,                                            (1)
teorological stations in the SCB (Fig. 1) from December
2006 to February 2020 are also collected. Their regional av-      where T refers to day-to-day temperature change, and Ti and
erages are used to determine the diurnal cycles of day-to-day     Ti−1 are the hourly temperatures at the specific time of the
temperature change. Additionally, daily mean surface wind         day and the previous day, respectively. To reveal the possi-
speed in the 18 cities of the SCB is also collected. To explore   ble mechanism of the formation of diurnal cycles of day-to-
the thermodynamic structure of the lower troposphere, daily       day temperature change, we calculate the day-to-day changes
potential temperature profiles at 20:00 Beijing time (BJT;        in total cloud cover at 06:00 and 14:00 BJT and also cal-
UTC + 8 h) from four sounding stations in the SCB are also        culate the vertical west–east cross-sections of the day-to-
obtained. Four sounding stations, including Chengdu, Yibin,       day changes in wind vectors (synthesized by u and w) at
Dazhou, and Chongqing, are located in the northwest, south-       14:00 BJT.
west, northeast, and southeast of the basin, respectively (see       To investigate the effects of diurnal cycles of day-to-
the orange dots in Fig. 1). All these surface meteorologi-        day temperature change on air quality, we also calculate
cal observations are obtained from the China Meteorological       the day-to-day changes in air pollutant concentrations and
Administration (CMA) (http://data.cma.cn/data/, last access:      atmospheric-dispersion conditions following the temperature
22 January 2020).                                                 change within 1 d. The following day-to-day changes in air
                                                                  pollutant concentrations (or atmospheric-dispersion condi-
2.3    ERA-5 reanalysis data                                      tions) are defined by the differences in air pollutant concen-
                                                                  trations (or meteorological conditions) between the next day
To obtain winter lower-troposphere stability and reveal the       and the current day:
possible mechanism of the formation of diurnal cycles of
day-to-day temperature change, 700 hPa temperature, air           PC = PCi+1 − PCi ,                                         (2)

https://doi.org/10.5194/acp-21-14493-2021                                        Atmos. Chem. Phys., 21, 14493–14505, 2021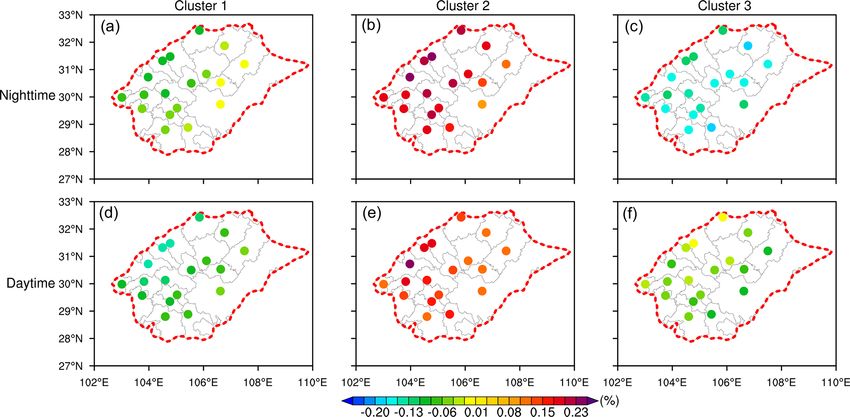
14496                                  D. Kong et al.: Diurnal cycles of temperature changes and their effects on air quality

Figure 2. Changes in Calinski–Harabasz values with different numbers of identified clusters.

Figure 3. Three identified diurnal cycles of day-to-day temperature change based on the K-means clustering method. The error bar denotes
the standard deviation of day-to-day temperature change.

where PC represents PBLH; LTS; vertical potential temper-              ing methods have been widely used in climate and environ-
ature (PT) profiles; surface wind speed (WS); or the concen-           mental research (Bardossy et al., 1995; Cavazos, 2000; Luo
trations of PM2.5 , PM10 , SO2 , NO2 , and CO. PC represents           and Lau, 2017; Bernier et al., 2019). In this study, the re-
the following day-to-day changes in PBLH, LTS, PT, WS,                 gional average values of day-to-day temperature change in
and five air pollutant concentrations. PCi+1 is the daily mean         the SCB and the K-means clustering method (MacQueen,
LTS, WS, and air pollutant concentrations or the PBLH at               1967) are selected to classify the diurnal cycles of day-to-
14:00 BJT and PT at 20:00 BJT on the next day. PCi is the              day temperature change because of the simplicity and con-
daily mean LTS, WS, and air pollutant concentrations or the            vergence characteristics of the K-means clustering method.
PBLH at 14:00 BJT and PT at 20:00 BJT on the current day.              The details of the K-means clustering method can refer to
                                                                       MacQueen (1967) and Mokdad and Haddad (2017) and are
2.5   K-means clustering                                               also provided in the Supplement. Additionally, the Calinski–
                                                                       Harabasz criterion, also known as the variance ratio criterion,
Clustering methods divide the objects into specific groups,            is utilized to determine the optimal number of clusters (Cal-
with the goal that all data objects assigned to the same               iński and Harabasz, 1974). The ultimate goal of the Calinski–
cluster have common characteristics, while different clus-             Harabasz criterion is to maximize the variance measure ratio
ters have distinct characteristics (Darby, 2005). The cluster-

Atmos. Chem. Phys., 21, 14493–14505, 2021                                                https://doi.org/10.5194/acp-21-14493-2021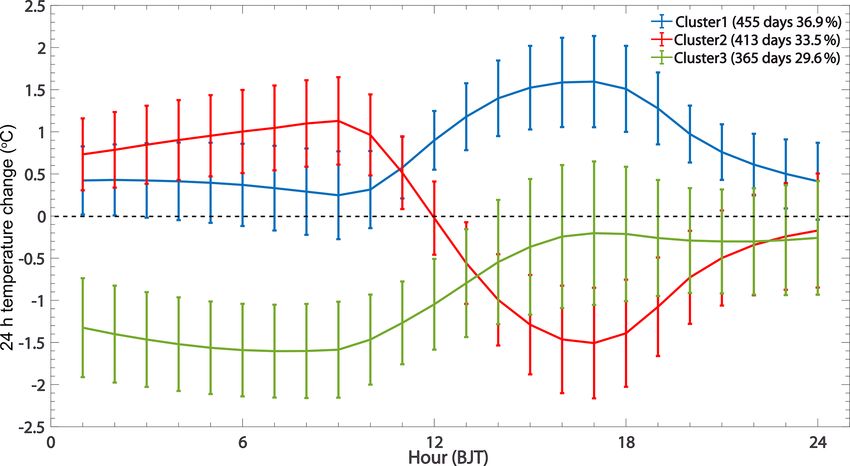
D. Kong et al.: Diurnal cycles of temperature changes and their effects on air quality                                              14497

Figure 4. The nighttime (a–c) and daytime (d–f) day-to-day changes in total cloud cover associated with the three diurnal cycles.

of homogeneity within a cluster and heterogeneity between               17:00 BJT, with a minimum value of −1.5◦ , indicating
clusters (Chikumbo and Granville, 2019).                                that the cooling process is obvious in the afternoon. After
                                                                        17:00 BJT, the absolute values of temperature change be-
                                                                        gin to decrease. The most prominent feature of Cluster 2 is
3     Results                                                           that the obvious decrease in temperature appears in the af-
                                                                        ternoon. In Cluster 3 (diurnal cycle with decreasing temper-
3.1    Diurnal cycles of day-to-day temperature change                  ature in the morning), all temperature changes are negative
                                                                        for 24 h throughout all days, and the obvious cooling process
The selection of an optimal number of clusters is illustrated           appears from 00:00 to 09:00 BJT. The temperature changes
in Fig. 2, which shows Calinski–Harabasz values associ-                 show the minimum value approaching −1.5◦ between 07:00
ated with the numbers of clusters ranging from 2 to 10.                 and 09:00 BJT. After 09:00 BJT, the absolute values of tem-
The Calinski–Harabasz value with three clusters reaches the             perature change gradually reduce and are close to zero in the
highest value, indicating that the optimal number of clus-              afternoon. The most prominent feature of Cluster 3 is that the
tering is three. Three dominant diurnal cycles of day-to-day            obvious decrease in temperature appears in the morning.
temperature change are therefore identified in the SCB. The                To reveal the underlying mechanism of the formation of
three typical diurnal cycles of day-to-day temperature change           the above three diurnal cycles of day-to-day temperature
are depicted in Fig. 3. The days for Cluster 1, Cluster 2, and          change, we also investigate the nighttime and daytime day-
Cluster 3 are 455 (accounting for 36.9 % of total days), 413            to-day changes in total cloud cover that could play a key
(33.5 %), and 365 d (29.6 %), respectively, indicating that the         role in temperature changes by modulating atmospheric ra-
differences in the occurrence frequency among the three di-             diations. Figure 4 shows the nighttime and daytime day-to-
urnal cycles are not noticeable. However, the diurnal cycles            day changes in total cloud cover associated with the three
of day-to-day temperature change among the three clusters               diurnal cycles. Corresponding to the diurnal cycle with in-
exhibit obvious differences.                                            creasing temperature (Cluster 1), the total cloud exhibits a
   In particular, in Cluster 1 (diurnal cycle with increas-             slight increase in the eastern SCB and a decrease in the west-
ing temperature), all the temperature changes are positive              ern SCB (Fig. 4a). The dipole spatial distribution could result
for 24 h throughout all days, indicating that temperature in-           in a weak change in the regional average temperature across
creases during the past 24 h and exhibits a maximum change              the SCB during nighttime (Fig. 3). During daytime, negative
approaching 1.5◦ between 16:00 and 17:00 BJT. In Clus-                  changes in total cloud cover are observed in the entire basin
ter 2 (diurnal cycle with decreasing temperature in the af-             (Fig. 4d) that are beneficial to the obvious increase in temper-
ternoon), the temperature changes show negative values af-              ature in the afternoon (Fig. 3). In contrast, both the nighttime
ter 12:00 BJT and drop to the trough between 16:00 and

https://doi.org/10.5194/acp-21-14493-2021                                              Atmos. Chem. Phys., 21, 14493–14505, 2021
14498 D. Kong et al.: Diurnal cycles of temperature changes and their effects on air quality
ture increase in the afternoon and thus plays a key role in the
day-to-day temperature change for these two diurnal cycles.
3.2 Air quality in relation to the identified diurnal
cycles
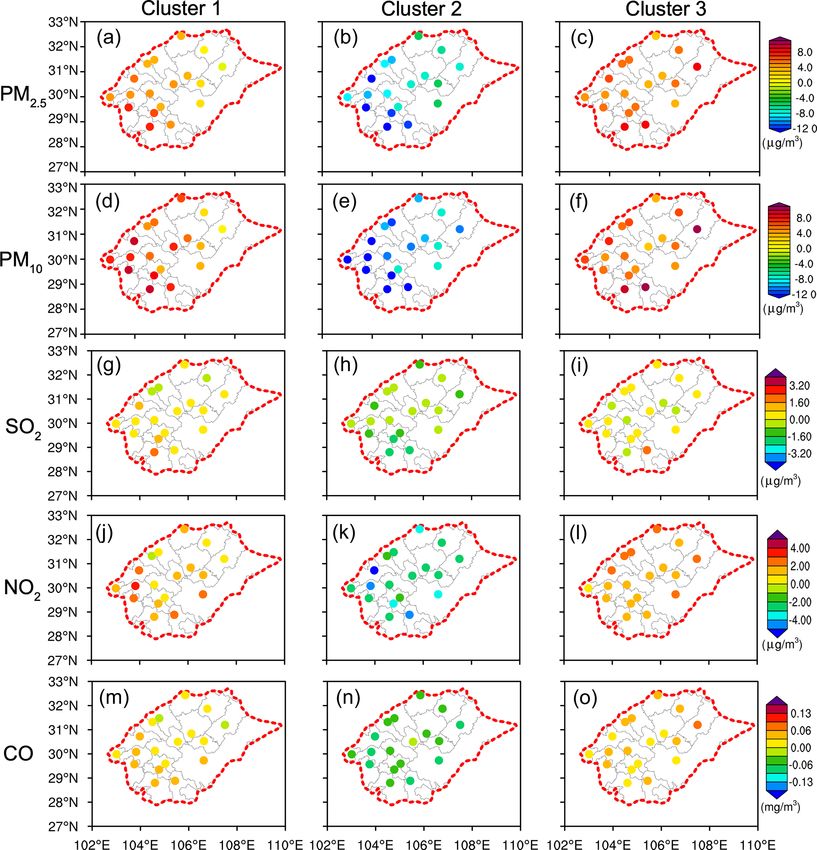
Heavy air pollution during winter in the SCB is mainly
caused by high concentrations of particulate matter (PM2.5
and PM10 ) (Ning et al., 2018a). Therefore, the day-to-day
changes in PM2.5 and PM10 concentrations following the
three identified diurnal cycles within 1 d and the percentage
values of the changes to the PM2.5 and PM10 concentrations
on the current day are investigated and are shown in Figs. 6
and S1. Figure 6 depicts the spatial distributions of the fol-
lowing day-to-day changes in PM2.5 and PM10 concentra-
tions associated with the three typical diurnal cycles. Un-
der the diurnal cycle with increasing temperature (Cluster 1),
nearly all parts of the SCB experience increases in PM2.5 and
PM10 concentrations on the following day (Fig. 6a, d), and
the increases are up to about 10% of the PM2.5 and PM10
concentrations on the current day (Fig. S1a, d). The regional
average changes in PM2.5 and PM10 concentrations are up to
+3.95 and +5.89 µg/m3 , respectively.
In contrast, negative changes in PM2.5 and PM10 concen-
trations are observed in the entire basin for the diurnal cy-
cle, with decreasing temperature in the afternoon (Cluster
2) (Fig. 6b, e), and account for about 8 % of the current-
Figure 5. Vertical west–east cross-sections of the day-to-day
changes in wind vectors (synthesized by u and w) at 14:00 BJT day concentrations (Fig. S1b, e), indicating the improvement
through the SCB (30.75◦ N) associated with the three diurnal cy- of air quality on the following day. The regional average
cles. Note that the vertical velocity is multiplied by −50 when plot- changes in PM2.5 and PM10 concentrations are up to −8.93
ting the wind vectors. The units for u and w are m/s and Pa/s, re- and −11.50 µg/m3 , respectively. Under the diurnal cycle with
spectively. The complex terrain is marked by gray shading. decreasing temperature in the morning (Cluster 3), all parts
of the SCB experience increases in PM2.5 and PM10 concen-
trations (Fig. 6c, f), and these increases account for 15 % of
and daytime changes in total cloud cover are positive in the current-day concentrations (Fig. S1c, f), indicating the de-
entire basin for Cluster 2 (Fig. 4b and e), which could induce terioration of air quality on the following day. It is noted
the increasing temperature during nighttime and decreasing that opposite changes in PM2.5 and PM10 concentrations
temperature during afternoon (Fig. 3). Corresponding to the are observed between Cluster 3 and Cluster 2 even though
diurnal cycle with decreasing temperature in the morning both of the two diurnal cycles show decreasing temperature.
(Cluster 3), obvious decreases in the total cloud cover are Compared with the diurnal cycle with increasing tempera-
observed in the entire basin during nighttime (Fig. 4c) that ture (Cluster 1), the increases in PM2.5 and PM10 concen-
are beneficial to the temperature decrease. trations are larger for Cluster 3, and the regional average
Moreover, the SCB is located in the eastern Tibetan changes in PM2.5 and PM10 concentrations are up to +5.36
Plateau, and the complex topography could play a key role and +5.91 µg/m3 , respectively.
in modulating the temperature changes over the SCB (Ning The contributions of gaseous pollutants in the SCB to win-
et al., 2018b, 2019). Therefore, the vertical west–east cross- ter air pollution are also very important as the SCB has a
sections of the day-to-day changes in wind vectors (synthe- large number of motor vehicles and industries (Ning et al.,
sized by u and w) at 14:00 BJT are also investigated to un- 2018a). Therefore, the following day-to-day changes in three
cover the physical and dynamics reasons of the formation of major gaseous (SO2 , NO2 , and CO) concentrations associ-
the above diurnal cycles of day-to-day temperature change. ated with the three diurnal cycles are also investigated. Simi-
As shown in Fig. 5b, a significant ascending motion is ob- lar to particulate matter, the relationships between the follow-
served over the SCB that could induce the obviously decreas- ing day-to-day changes in gaseous pollutant concentrations
ing temperature in the afternoon for Cluster 2 (Fig. 3). In and the three diurnal cycles are consistent with the results for
contrast, the descending motion prevails over the SCB for PM2.5 and PM10 . As shown in Figs. 6g–o and S1g–o, nearly
Cluster 1 and Cluster 3, which is beneficial to the tempera- all parts of the SCB experience increases in SO2 , NO2 , and
Atmos. Chem. Phys., 21, 14493–14505, 2021 https://doi.org/10.5194/acp-21-14493-2021D. Kong et al.: Diurnal cycles of temperature changes and their effects on air quality 14499
Figure 6. Spatial distribution of the day-to-day changes in surface PM2.5 (a–c), PM10 (d–f), SO2 (g–i), NO2 (j–l), and CO (m–o) concen-
trations following the three diurnal cycles within 1 d.
CO concentrations on the following day for Cluster 1 (diur- tial for winter air quality forecasting on the following day in
nal cycle with increasing temperature) and Cluster 3 (diurnal the SCB.
cycle with decreasing temperature in the morning). In con-
trast, negative changes in SO2 , NO2 , and CO concentrations 3.3 Mechanism of the identified diurnal cycle effects on
are observed in the entire basin for Cluster 2 (diurnal cycle air quality
with decreasing temperature in the afternoon).
Figures 6 and S1 collectively indicate that the air qual- To reveal the potential influence mechanism of the diur-
ity in the SCB corresponding to Cluster 1 and Cluster 3 will nal cycles of day-to-day temperature change on the fol-
deteriorate on the following day, while the air quality corre- lowing day-to-day changes in air quality, the atmospheric-
sponding to Cluster 2 will improve. These results suggest that dispersion conditions corresponding to the three identified
the modulations of the following day-to-day changes in win- diurnal cycles are investigated. Firstly, the following day-to-
ter air quality by diurnal cycles of day-to-day temperature day changes in PT vertical profiles at four sounding stations
change are obvious and important. Thus, the diurnal cycles in the SCB (Fig. 7) are examined to explore the thermody-
of day-to-day temperature change exhibit promising poten- namic structure in the lower troposphere. Then, the follow-
ing day-to-day changes in the three meteorological parame-
ters related to atmospheric-dispersion conditions, including
https://doi.org/10.5194/acp-21-14493-2021 Atmos. Chem. Phys., 21, 14493–14505, 202114500 D. Kong et al.: Diurnal cycles of temperature changes and their effects on air quality
Additionally, we also analyzed the following day-to-day
changes in surface wind speed as the wind speed can repre-
sent the horizontal dispersion capacity of air pollutants (Lu et
al., 2012; Deng et al., 2014). No noticeable decreases in wind
speed appear in the SCB (Fig. 8g). These results suggest that
the diurnal cycle with increasing temperature (Cluster 1) en-
hances atmospheric stability in the lower troposphere, which
can weaken the vertical exchange of airflow and then sup-
press the development of the PBL, resulting in a small disper-
sion space of air pollutants and poor air quality in the SCB
on the following day.
Compared with Cluster 1, an opposite vertical structure
of PT changes (Fig. 7b, e, h, k) is observed for the diurnal
cycle with decreasing temperature in the afternoon (Clus-
ter 2), which could weaken the atmospheric stability in the
lower troposphere. As shown in Fig. 8b, negative changes in
LTS appear in all parts of the SCB, enhancing the vertical
exchange of airflow and facilitating the development of the
PBL. As a result, increased PBLH is observed in all parts
of the SCB (Fig. 8e), and the regional average increment is
up to 93.0 m. At the same time, the weakened atmospheric
stability in the lower troposphere is also conducive to the de-
velopment of surface wind speed. As shown in Fig. 8h, the
surface wind speed in the entire SCB is strengthened obvi-
ously, indicating that the horizontal dispersion capacity of
air pollutants is also improved. These results suggest that the
diurnal cycle with decreasing temperature in the afternoon
weakens atmospheric stability in the lower troposphere and
Figure 7. Day-to-day changes in the PT vertical profiles at creates good vertical mixing of airflow, which can promote
20:00 BJT following the three identified diurnal cycles within 1 d the development of the PBL and surface wind speed, facili-
at four sounding stations. Chengdu (a–c), Yibin (d–f), Dazhou (g– tating the improvement of air quality on the following day.
i), and Chongqing (j–l). For the Cluster 3, the PT changes are not noticeable
below 850 hPa over the four sounding stations. As shown
in Fig. 7c, f, i, l, decreased PT is observed between 850
and 700 hPa, while obviously increased PT appears above
LTS (Fig. 8a–c), PBLH (Fig. 8d–f), and WS (Fig. 8g–i), are 700 hPa. This vertical structure of PT changes suggests that
also investigated to evaluate the evolutions of atmospheric- the atmospheric stability is enhanced above the PBL over the
dispersion capacity. SCB, which is demonstrated to play a key role in the forma-
Under the diurnal cycle with increasing temperature tion of winter heavy-air-pollution events in the basin (Ning
(Cluster 1), three sounding stations (Yibin, Dazhou, and et al., 2018b, 2019). As shown in Fig. 8c, increased LTS ap-
Chongqing) experience increases in PT between 950 and pears in the entire SCB, and the increments of LTS are obvi-
800 hPa on the following day (Fig. 7d,g, j). In Chengdu, de- ously larger than those for Cluster 1 (Fig. 8a), inhibiting the
creased PT is observed below 900 hPa, while increased PT vertical mixing of atmosphere and suppressing the develop-
appears between 900 and 750 hPa (Fig. 7a). All the PT pro- ment of the PBL. As a result, decreased PBLH is observed
files over the four sounding stations show higher temperature in all parts of the SCB. Compared with Cluster 1, the en-
change in the higher level (800–850 hPa) than the lower level hanced atmospheric stability above the PBL also suppresses
(900–950 hPa), which could enhance the atmospheric stabil- the development of surface wind speed. As shown in Fig. 8i,
ity in the lower troposphere. As shown in Fig. 8a, increased all parts of the SCB experience decreases in surface wind
LTS is observed in most of the cities in the SCB, indicating speed, weakening the horizontal dispersion capacity of air
that the atmospheric stratification in the lower troposphere pollutants. These results suggest that both the vertical and
becomes more stable. The stable atmospheric stratification horizontal dispersion capacity of air pollutants correspond-
inhibits the vertical mixing of the atmosphere and suppresses ing to Cluster 3 are worse than those corresponding to Clus-
the development of the PBL (Karppinen et al., 2001; Bei et ter 1. The differences in the atmospheric-dispersion condi-
al., 2016). As shown in Fig. 8d, obviously decreased PBLH tions between Cluster 3 and Cluster 1 can explain well that
is observed in all 18 cities of the SCB.
Atmos. Chem. Phys., 21, 14493–14505, 2021 https://doi.org/10.5194/acp-21-14493-2021D. Kong et al.: Diurnal cycles of temperature changes and their effects on air quality 14501
Figure 8. Spatial distribution of the day-to-day changes in LTS (a–c), PBLH (d–f), and WS (g–i) following the three identified diurnal cycles
within 1 d.
the air quality deterioration is more serious for Cluster 3 than for Cluster 3, decreased PT is observed between 850
Cluster 1 (Figs. 6 and S1). and 700 hPa, while obviously increased PT appears above
700 hPa (Fig. 7c, f, i, l). This special vertical structure of PT
is closely related to the foehn that is formed under the syn-
4 Discussion ergistic effects of cooling processes and the Tibetan Plateau
(Ning et al., 2019), indicating that a stable layer exits above
It is worth noting that the following day-to-day air quality the PBL and acts as a lid covering the PBL (Ning et al.,
changes between Cluster 2 and Cluster 3 in mountain-basin 2018b, 2019). The vertical structure of PT is demonstrated to
areas are opposite, even though both of the two diurnal cy- play key roles in the formation of winter heavy-air-pollution
cles are associated with cooling processes. In the cases of events in mountain-basin areas by inhibiting the development
the cooling process mainly occurring in the afternoon (Clus- of secondary circulation and the PBL (Ning et al., 2018b,
ter 2), the atmospheric-dispersion conditions are obviously 2019). These features suggest that the physical processes re-
improved, resulting in air quality improvement on the follow- lated to air pollution are more complex in mountain-basin
ing day. In contrast, the atmospheric-dispersion conditions areas than in the areas with flat terrain and urgently need to
are obviously inhibited when the cooling process mainly ap- be further explored in the future.
pears in the morning (Cluster 3), resulting in air quality dete- Our study highlights that the following day-to-day air
rioration on the following day. These findings could improve quality changes in mountain-basin areas are notably affected
our understanding of the effects of cooling processes on air by the diurnal cycles of day-to-day temperature changes. We
quality (Kalkstein and Corrigan, 1986; Gimson, 1994; Hu et find that the identified diurnal cycles of day-to-day temper-
al., 2018; Ning et al., 2018b; Kang et al., 2019) and sug- ature variation in our study can explain well the evolutions
gest that comprehensive investigations for the effects of diur- of atmospheric-dispersion conditions and air quality on the
nal cycles of atmospheric-dispersion conditions on air qual- following day and thus could be useful for air quality fore-
ity are urgently needed in the future to fully understand the casting in mountain-basin areas. Currently, numerical models
physical mechanism of air quality evolutions. (including the WRF-Chem model and CMAQ model) (Grell
Additionally, both Cluster 1 and Cluster 3 are associ- et al., 2005; Byun and Ching, 1999) and statistical models
ated with weakened atmospheric-dispersion conditions and (including statistical analysis, machine learning, the hybrid
lead to air quality deterioration on the following day. How- linear–nonlinear method, etc.) (Huang, 1992; Chelani and
ever, obvious differences in PT vertical profiles (Fig. 7) Devotta, 2006; Borse, 2020) are the two typical methods that
between Cluster 1 and Cluster 3 are observed. Especially
https://doi.org/10.5194/acp-21-14493-2021 Atmos. Chem. Phys., 21, 14493–14505, 202114502 D. Kong et al.: Diurnal cycles of temperature changes and their effects on air quality
have been widely used to forecast air quality by combining ML, XN, and MM provided interpretation and editing of the
weather conditions and emission sources (Gidhagen et al., manuscript. JC performed data analysis and provided useful com-
2005). In the future, our findings should therefore be com- ments.
bined with numerical models or statistical models to improve
air quality forecasting in mountain-basin areas.
Competing interests. The authors declare that they have no conflict
of interest.
5 Conclusions
Disclaimer. Publisher’s note: Copernicus Publications remains
Taking the SCB as an example, this study is the first exami- neutral with regard to jurisdictional claims in published maps and
nation of the behaviors of diurnal cycles of day-to-day tem- institutional affiliations.
perature change using hourly temperature observations and
their effects on the following day-to-day air quality changes
in mountain-basin areas. Three diurnal cycles of day-to-day Acknowledgements. This work was supported by the National Nat-
temperature change are identified, which notably affect the ural Science Foundation of China (grant nos. 91644226, 41830648,
following day-to-day air quality changes. Among them, two 41871029, and 41771453), the Major Scientific and Technologi-
diurnal cycles (i.e., Clusters 1 and 3) inhibit atmospheric- cal Projects in Sichuan Province (grant no. 2018SZDZX0023), the
dispersion conditions by enhancing atmospheric stability, Applied Basic Research project of the Sichuan Science and Tech-
nology Department (grant no. 2020YJ0425), the Technology Inno-
suppressing the PBL, and weakening surface wind speed,
vation Research and Development project of the Chengdu Science
thus leading to air quality deterioration on the following day. and Technology Department (grant no. 2018-YF05-00219-SN), and
Compared with the diurnal cycle with increasing temper- the National Major Projects on High-Resolution Earth Observation
ature (i.e., Cluster 1), the atmospheric-dispersion conditions Systems (grant no. 21-Y20B01-9001-19/22). The appointment of
are worse for the diurnal cycle with decreasing temperature Ming Luo at Sun Yat-sen University is partially supported by the
in the morning (i.e., Cluster 3) and cause more serious deteri- Pearl River Talent Recruitment Program of Guangdong Province,
oration of air quality. In contrast, the atmospheric-dispersion China (grant no. 2017GC010634). We would like to thank the fol-
condition with weakened atmospheric stability, a deepened lowing departments for the provided data: the Ministry of Ecology
PBL, and enhanced surface wind speed is obviously im- and Environment of the People’s Republic of China, the China Me-
proved for this type of diurnal cycle with decreasing temper- teorological Administration, and the European Centre for Medium-
ature in the afternoon (i.e., Cluster 2), which improves the Range Weather Forecasts. The authors are thankful to the anony-
mous reviewers, who provided valuable comments and suggestions.
air quality on the following day. These results suggest that
the identified diurnal cycles can explain well the evolutions
of atmospheric-dispersion conditions and air quality on the
Financial support. This research has been supported by the
following day. Our findings exhibit promising potential for
National Natural Science Foundation of China (grant nos.
air quality forecasting in mountain-basin areas. 91644226, 41830648, 41871029, and 41771453), the Major Sci-
entific and Technological Projects in Sichuan Province (grant
no. 2018SZDZX0023), the Applied Basic Research Project of
Data availability. The hourly air quality data were collected from the Sichuan Science and Technology Department (grant no.
the Ministry of Ecology and Environment of the People’s Republic 2020YJ0425), the Technology Innovation Research and Develop-
of China (http://www.mee.gov.cn/xxgk2018/, last access: 22 Jan- ment project of the Chengdu Science and Technology Depart-
uary 2020; MEP, 2012). The meteorological observation data and ment (grant no. 2018-YF05-00219-SN), and the National Major
the ERA-5 reanalysis data were obtained from the China Meteoro- Projects on High-Resolution Earth Observation Systems (grant no.
logical Administration (CMA) (http://data.cma.cn/data/, provided 21-Y20B01-9001-19/22). The appointment of Ming Luo at Sun
by the National Meteorological Information Centre of China, last Yat-sen University is partially supported by the Pearl River Tal-
access: 22 January 2020; SPC, 2017) and the European Centre for ent Recruitment Program of Guangdong Province, China (grant no.
Medium-Range Weather Forecasts (https://cds.climate.copernicus. 2017GC010634).
eu/, last access: 22 January 2020; Hersbach et al., 2018), respec-
tively.
Review statement. This paper was edited by Aijun Ding and re-
viewed by three anonymous referees.
Supplement. The supplement related to this article is available on-
line at: https://doi.org/10.5194/acp-21-14493-2021-supplement.
Author contributions. DK performed data analysis, prepared the
figures, and wrote original draft with contributions from all co-
authors. GN designed the research and wrote the manuscript. SW,
Atmos. Chem. Phys., 21, 14493–14505, 2021 https://doi.org/10.5194/acp-21-14493-2021D. Kong et al.: Diurnal cycles of temperature changes and their effects on air quality 14503
References pollution in the North China Plain, Sci. Total Environ., 735,
139559, https://doi.org/10.1016/j.scitotenv.2020.139559, 2020.
Feng, X., Liu, C., Fan, G., Liu, X., and Feng, C.: Climatol-
Bardossy, A., Duckstein, L., and Bogardi, I.: Fuzzy rule-based clas- ogy and structures of southwest vortices in the NCEP cli-
sification of atmospheric circulation patterns, Int. J. Climatol., mate forecast system reanalysis, J. Climate, 29, 7675–7701,
15, 1087–1097, https://doi.org/10.1002/joc.3370151003, 1995. https://doi.org/10.1175/JCLI-D-15-0813.1, 2016.
Bei, N., Xiao, B., Meng, N., and Feng, T.: Critical role of me- Feng, X., Wei, S., and Wang, S.: Temperature inversions in
teorological conditions in a persistent haze episode in the the atmospheric boundary layer and lower troposphere
Guanzhong basin, China, Sci. Total Environ., 550, 273–284, over the Sichuan Basin, China: climatology and im-
https://doi.org/10.1016/j.scitotenv.2015.12.159, 2016. pacts on air pollution, Sci. Total Environ., 726, 138579,
Beljaars, A.: Chapter 3: Turbulent transport and interactions with https://doi.org/10.1016/j.scitotenv.2020.138579, 2020.
the surface, Part IV: physical processes, IFS documentation, Fu, Q., Zhuang, G., Wang, J., Xu, C., Huang, K., Li, J.,
operational implementation 12 September 2006 Cy31r1 31, Hou, B., Lu, T., and Streets, D. G.: Mechanism of forma-
ECMWF, Shinfield Park, Reading, RG2 9AX, England, 2006. tion of the heaviest pollution episode ever recorded in the
Bernier, C., Wang, Y., Estes, M., Lei, R., Jia, B., Wang, Yangtze River Delta, China, Atmos. Environ., 42, 2023–2036,
S.-C., and Sun, J.: Clustering surface ozone diurnal cy- https://doi.org/10.1016/j.atmosenv.2007.12.002, 2008.
cles to understand the impact of circulation patterns in Gidhagen, L., Johansson, C., Langner, J., and Foltescu, V.
Houston, TX, J. Geophys. Res.-Atmos., 124, 13457–13474, L.: Urban scale modeling of particle number concen-
https://doi.org/10.1029/2019JD031725, 2019. tration in Stockholm, Atmos. Environ., 39, 1711–1725,
Borse, S. K.: A Review: predicting air quality using different tech- https://doi.org/10.1016/j.atmosenv.2004.11.042, 2005.
nique, Acta technica corviniensis-bulletin of engineering, Acta Gimson, N. R.: Dispersion and removal of pollutants during the pas-
Technica Corviniensis-Bulletin of Engineering, 13, 153–157, sage of an atmospheric frontal system, Q. J. Roy. Meteor. Soc.,
2020. 120, 139–160, https://doi.org/10.1002/qj.49712051509, 1994.
Byun, D. and Ching, J.: Science algorithms of the EPA models- Grell, G. A., Peckham, S. E., Schmitz, R., McKeen, S. A., Frost, G.,
3 community multiscale air quality model (CMAQ) model- Skamarock, W. C., and Eder, B.: Fully coupled “online” chem-
ing system, Rep. EPA/600/R-99, U.S. Environmental Protection istry within the WRF model, Atmos. Environ., 39, 6957–6975,
Agency, Research Triangle Park, NC, 22 pp., 1999. https://doi.org/10.1016/j.atmosenv.2005.04.027, 2005.
Caliński, T. and Harabasz, J.: A dendrite method Guo, J., Deng, M., Lee, S. S., Wang, F., Li, Z., Zhai, P., Liu, H.,
for cluster analysis, Commun. Stat., 3, 1–27, Lv, W., Yao, W., and Li, X.: Delaying precipitation and light-
https://doi.org/10.1080/03610927408827101, 1974. ning by air pollution over the Pearl River Delta. Part I: obser-
Cavazos, T.: Using self-organizing maps to investigate ex- vational analyses, J. Geophys. Res.-Atmos., 121, 6472–6488,
treme climate events: an application to wintertime pre- https://doi.org/10.1002/2015JD023257, 2016a.
cipitation in the Balkans, J. Climate, 13, 1718–1732, Guo, J., Miao, Y., Zhang, Y., Liu, H., Li, Z., Zhang, W., He, J., Lou,
https://doi.org/10.1175/1520-0442(2000)013 M., Yan, Y., Bian, L., and Zhai, P.: The climatology of plan-
2.0.CO;2, 2000. etary boundary layer height in China derived from radiosonde
Chelani, A. B. and Devotta, S.: Air quality forecasting using a and reanalysis data, Atmos. Chem. Phys., 16, 13309–13319,
hybrid autoregressive and nonlinear model, Atmos. Environ., https://doi.org/10.5194/acp-16-13309-2016, 2016b.
40, 1774–1780, https://doi.org/10.1016/j.atmosenv.2005.11.019, Guo, J., Chen, X., Su, T., Liu, L., Zheng, Y., Chen, D., Li, J., Xu,
2006. H., Lv, Y., and He, B.: The climatology of lower tropospheric
Chen, Y. and Xie, S.: Temporal and spatial visibility trends in the temperature inversions in China from radiosonde measurements:
Sichuan Basin, China, 1973 to 2010, Atmos. Res., 112, 25–34, roles of black carbon, local meteorology, and large-scale subsi-
https://doi.org/10.1016/j.atmosres.2012.04.009, 2012. dence, J. Climate, 33, 9327–9350, https://doi.org/10.1175/JCLI-
Chikumbo, O. and Granville, V.: Optimal clustering and clus- D-19-0278.1, 2020.
ter identity in understanding high-dimensional data spaces with Hersbach, H., Bell, B., Berrisford, P., Biavati, G., Horányi, A.,
tightly distributed points, Mach. Learn. Knowl. Extr., 1, 715– Muñoz Sabater, J., Nicolas, J., Peubey, C., Radu, R., Rozum, I.,
744, https://doi.org/10.3390/make1020042, 2019. Schepers, D., Simmons, A., Soci, C., Dee, D., and Thépaut, J.-
Darby, L. S.: Cluster analysis of surface winds in Houston, Texas, N.: ERA5 hourly data on pressure levels from 1979 to present,
and the impact of wind patterns on ozone, J. Appl. Meteorol. Copernicus Climate Change Service (C3S) Climate Data Store
Climatol., 44, 1788–1806, https://doi.org/10.1175/JAM2320.1, (CDS) [data set], available at: https://cds.climate.copernicus.eu/
2005. (last access: 22 January 2020), 2018.
Deng, T., Wu, D., Deng, X., Tan, H., Li, F., and Liao, B.: A vertical Hu, Y., Wang, S., Ning, G., Zhang, Y., Wang, J., and Shang,
sounding of severe haze process in Guangzhou area, Sci. China Z.: A quantitative assessment of the air pollution purifi-
Earth Sci., 57, 2650–2656, https://doi.org/10.1007/s11430-014- cation effect of a super strong cold-air outbreak in Jan-
4928-y, 2014. uary 2016 in China, Air Qual. Atmos. Hlth., 11, 907–923,
Ding, A., Wang, T., and Fu, C.: Transport characteristics and https://doi.org/10.1007/s11869-018-0592-2, 2018.
origins of carbon monoxide and ozone in Hong Kong, Huang, G.: A stepwise cluster analysis method for predicting air
South China, J. Geophys. Res.-Atmos., 118, 9475–9488, quality in an urban environment, Atmos. Environ., 26, 349–357,
https://doi.org/10.1002/jgrd.50714, 2013. https://doi.org/10.1016/0957-1272(92)90010-P, 1992.
Dong, Y., Li, J., Guo, J., Jiang, Z., Chu, Y., Chang, L., Yang, Y., and
Liao, H.: The impact of synoptic patterns on summertime ozone
https://doi.org/10.5194/acp-21-14493-2021 Atmos. Chem. Phys., 21, 14493–14505, 202114504 D. Kong et al.: Diurnal cycles of temperature changes and their effects on air quality Kalkstein, L. S. and Corrigan, P.: A Synoptic climatological ap- height and PM2.5 pollution in China based on four-year ra- proach for geographical analysis: assessment of sulfur diox- diosonde measurements, Environ. Pollut., 243, 1186–1195, ide concentrations, Ann. Assoc. Am. Geogr., 76, 381–395, https://doi.org/10.1016/j.envpol.2018.09.070, 2018. https://doi.org/10.1111/j.1467-8306.1986.tb00126.x, 1986. Mokdad, F. and Haddad, B.: Improved infrared precipitation es- Kang, H., Zhu, B., Gao, J., He, Y., Wang, H., Su, J., Pan, C., Zhu, T., timation approaches based on K-means clustering: application and Yu, B.: Potential impacts of cold frontal passage on air qual- to north Algeria using MSG-SEVIRI satellite data, Adv. Space ity over the Yangtze River Delta, China, Atmos. Chem. Phys., 19, Res., 59, 2880–2900, https://doi.org/10.1016/j.asr.2017.03.027, 3673–3685, https://doi.org/10.5194/acp-19-3673-2019, 2019. 2017. Karl, T. R., Knight, R. W., and Plummer, N.: Trends in high- Ning, G., Wang, S., Ma, M., Ni, C., Shang, Z., Wang, J., frequency climate variability in the twentieth century, Nature, and Li, J.: Characteristics of air pollution in different zones 377, 217–220, https://doi.org/10.1038/377217a0, 1995. of Sichuan Basin, China, Sci. Total Environ., 612, 975–984, Karppinen, A., Joffre, S. M., Kukkonen, J., and Bremer, P.: Evalua- https://doi.org/10.1016/j.scitotenv.2017.08.205, 2018a. tion of inversion strengths and mixing heights during extremely Ning, G., Wang, S., Yim, S. H. L., Li, J., Hu, Y., Shang, Z., Wang, J., stable atmospheric stratification, Int. J. Environ. Pollut., 16, 603– and Wang, J.: Impact of low-pressure systems on winter heavy air 613, https://doi.org/10.1504/IJEP.2001.000653, 2001. pollution in the northwest Sichuan Basin, China, Atmos. Chem. Kelly, F. J. and Zhu, T.: Transport solutions for cleaner air, Science, Phys., 18, 13601–13615, https://doi.org/10.5194/acp-18-13601- 352, 934–936, https://doi.org/10.1126/science.aaf3420, 2016. 2018, 2018b. Li, Y., Chen, Q., Zhao, H., Wang, L., and Tao, R.: Variations in Ning, G., Yim, S. H. L., Wang, S., Duan, B., Nie, C., Yang, PM10 , PM2.5 and PM1.0 in an urban area of the Sichuan Basin X., Wang, J., and Shang, K.: Synergistic effects of synop- and their relation to meteorological factors, Atmosphere, 6, 150– tic weather patterns and topography on air quality: a case of 163, 2015. the Sichuan Basin of China, Clim. Dynam., 53, 6729–6744, Li, Z., Guo, J., Ding, A., Liao, H., Liu, J., Sun, Y., Wang, T., Xue, https://doi.org/10.1007/s00382-019-04954-3, 2019. H., Zhang, H., and Zhu, B.: Aerosol and boundary-layer inter- Ning, G., Yim, S. H. L., Yang, Y., Gu, Y., and Dong, G.: Modu- actions and impact on air quality, Natl. Sci. Rev., 4, 810–833, lations of synoptic and climatic changes on ozone pollution and https://doi.org/10.1093/nsr/nwx117, 2017. its health risks in mountain-basin areas, Atmos. Environ., 240, Liao, T., Wang, S., Ai, J., Gui, K., Duan, B., Zhao, Q., Zhang, 117808, https://doi.org/10.1016/j.atmosenv.2020.117808, 2020. X., Jiang, W., and Sun, Y.: Heavy pollution episodes, transport Qiu, H., Yu, H., Wang, L., Zhu, X., Chen, M., Zhou, pathways and potential sources of PM2.5 during the winter of L., Deng, R., Zhang, Y., Pu, X., and Pan, J.: The 2013 in Chengdu (China), Sci. Total Environ., 584, 1056–1065, burden of overall and cause-specific respiratory morbidity https://doi.org/10.1016/j.scitotenv.2017.01.160, 2017. due to ambient air pollution in Sichuan Basin, China: a Lu, C., Deng, Q.-H., Liu, W.-W., Huang, B.-L., and Shi, L.- multi-city time-series analysis, Environ. Res., 167, 428–436, Z.: Characteristics of ventilation coefficient and its impact https://doi.org/10.1016/j.envres.2018.08.011, 2018. on urban air pollution, J. Cent. South Univ., 19, 615–622, Slingo, J. M.: The development and verification of a cloud predic- https://doi.org/10.1007/s11771-012-1047-9, 2012. tion scheme for the ECMWF model, Q. J. Roy. Meteor. Soc., Luo, M. and Lau, N.-C.: Heat waves in southern China: synoptic 113, 899–927, https://doi.org/10.1002/qj.49711347710, 1987. behavior, long-term change, and urbanization effects, J. Climate, Standards Press of China (SPC): National Standards of People’s 30, 703–720, https://doi.org/10.1175/JCLI-D-16-0269.1, 2017. Republic of China: Specifications for Surface Meteorological Luo, M., Hou, X., Gu, Y., Lau, N.-C., and Yim, S. H.- Observation, [data set] GB/T 35221–2017, available at: http: L.: Trans-boundary air pollution in a city under various //data.cma.cn/data/ (last access: 22 January 2020), SPC, Beijing, atmospheric conditions, Sci. Total Environ., 618, 132–141, 32 pp., 2017. https://doi.org/10.1016/j.scitotenv.2017.11.001, 2018. Streets, D. G., Gupta, S., Waldhoff, S. T., Wang, M. Q., Bond, MacQueen, J.: Some methods for classification and analysis of mul- T. C., and Yiyun, B.: Black carbon emissions in China, At- tivariate observations, Proceedings of the fifth Berkeley sympo- mos. Environ., 35, 4281–4296, https://doi.org/10.1016/S1352- sium on mathematical statistics and probability, 281–297, 1967. 2310(01)00179-0, 2001. MEP: Ministry of Environmental Protection of the People’s Repub- Su, T., Li, Z., Zheng, Y., Luan, Q., and Guo, J.: Abnormally shal- lic of China (MEP): Technical Regulation on Ambient Air Qual- low boundary layer associated with severe air pollution during ity Index (on Trial): HJ 633-2012, [data set] available at: http: the COVID-19 lockdown in China, Geophys. Res. Lett., 47, //www.mee.gov.cn/xxgk2018/ (last access: 22 January 2020), e2020GL090041, https://doi.org/10.1029/2020GL090041, 2020. 2012. Wang, W., Kuo, Y.-H., and Warner, T. T.: A diabatically driven MEP: Technical regulation on ambient air quality assessment (on mesoscale vortex in the lee of the Tibetan Plateau, Mon. trial) (HJ663-2013), China Environmental Science Press, Bei- Weather Rev., 121, 2542–2561, https://doi.org/10.1175/1520- jing, China, 14 pp., 2013. 0493(1993)121< 2542:ADDMVI>2.0.CO;2, 1993. Miao, Y., Guo, J., Liu, S., Liu, H., Li, Z., Zhang, W., and Zhai, Wang, X., Dickinson, R. E., Su, L., Zhou, C., and Wang, K.: PM2.5 P.: Classification of summertime synoptic patterns in Beijing pollution in China and how it has been exacerbated by terrain and and their associations with boundary layer structure affect- meteorological conditions, Bull. Am. Meteorol. Soc., 99, 105– ing aerosol pollution, Atmos. Chem. Phys., 17, 3097–3110, 119, https://doi.org/10.1175/BAMS-D-16-0301.1, 2018. https://doi.org/10.5194/acp-17-3097-2017, 2017. Wang, Y., Yao, L., Wang, L., Liu, Z., Ji, D., Tang, G., Zhang, Miao, Y., Liu, S., Guo, J., Huang, S., Yan, Y., and Lou, J., Sun, Y., Hu, B., and Xin, J.: Mechanism for the forma- M.: Unraveling the relationships between boundary layer tion of the January 2013 heavy haze pollution episode over Atmos. Chem. Phys., 21, 14493–14505, 2021 https://doi.org/10.5194/acp-21-14493-2021
D. Kong et al.: Diurnal cycles of temperature changes and their effects on air quality                                               14505

  central and eastern China, Sci. China Earth Sci., 57, 14–25,           Zhang, Q., Streets, D. G., Carmichael, G. R., He, K. B., Huo, H.,
  https://doi.org/10.1007/s11430-013-4773-4, 2014.                         Kannari, A., Klimont, Z., Park, I. S., Reddy, S., Fu, J. S., Chen,
Wei, P., Cheng, S., Li, J., and Su, F.: Impact of boundary-layer anti-     D., Duan, L., Lei, Y., Wang, L. T., and Yao, Z. L.: Asian emis-
  cyclonic weather system on regional air quality, Atmos. Environ.,        sions in 2006 for the NASA INTEX-B mission, Atmos. Chem.
  45, 2453–2463, https://doi.org/10.1016/j.atmosenv.2011.01.045,           Phys., 9, 5131–5153, https://doi.org/10.5194/acp-9-5131-2009,
  2011.                                                                    2009.
Wei, W., Zhang, R., Wen, M., Rong, X., and Li, T.: Impact of In-         Zhang, X. Y., Wang, Y. Q., Niu, T., Zhang, X. C., Gong, S. L.,
  dian summer monsoon on the South Asian High and its influence            Zhang, Y. M., and Sun, J. Y.: Atmospheric aerosol composi-
  on summer rainfall over China, Clim. Dynam., 43, 1257–1269,              tions in China: spatial/temporal variability, chemical signature,
  https://doi.org/10.1007/s00382-013-1938-y, 2014.                         regional haze distribution and comparisons with global aerosols,
Xiao, Q., Ma, Z., Li, S., and Liu, Y.: The impact of winter                Atmos. Chem. Phys., 12, 779–799, https://doi.org/10.5194/acp-
  heating on air pollution in China, PLoS One, 10, e0117311,               12-779-2012, 2012.
  https://doi.org/10.1371/journal.pone.0117311, 2015.                    Zhang, Y., Guo, J., Yang, Y., Wang, Y., and Yim, S. H. L.: Vertical
Xu, T., Song, Y., Liu, M., Cai, X., Zhang, H., Guo, J.,                    wind shear modulates particulate matter pollutions: A perspec-
  and Zhu, T.: Temperature inversions in severe polluted                   tive from radar wind profiler observations in Beijing, China, Re-
  days derived from radiosonde data in North China from                    mote Sens., 12, 546, https://doi.org/10.3390/rs12030546, 2020.
  2011 to 2016, Sci. Total Environ., 647, 1011–1020,                     Zhang, Z., Zhang, X., Gong, D., Kim, S.-J., Mao, R., and Zhao,
  https://doi.org/10.1016/j.scitotenv.2018.08.088, 2019.                   X.: Possible influence of atmospheric circulations on winter haze
Yarnal, B.: Synoptic climatology in environmental analysis: a              pollution in the Beijing–Tianjin–Hebei region, northern China,
  primer, Belhaven Press, London, 256 pp., 1993.                           Atmos. Chem. Phys., 16, 561–571, https://doi.org/10.5194/acp-
Ye, X., Song, Y., Cai, X., and Zhang, H.: Study on the synoptic flow       16-561-2016, 2016.
  patterns and boundary layer process of the severe haze events          Zhao, S., Yu, Y., Yin, D., Qin, D., He, J., and Dong, L.:
  over the North China Plain in January 2013, Atmos. Environ.,             Spatial patterns and temporal variations of six criteria air
  124, 129–145, https://doi.org/10.1016/j.atmosenv.2015.06.011,            pollutants during 2015 to 2017 in the city clusters of
  2016.                                                                    Sichuan Basin, China, Sci. Total Environ., 624, 540–557,
Yu, S., Gao, W., Xiao, D., and Peng, J.: Observational facts regard-       https://doi.org/10.1016/j.scitotenv.2017.12.172, 2018.
  ing the joint activities of the southwest vortex and plateau vortex    Zhu, S., Xia, L., Wu, J., Chen, S., Chen, F., Zeng, F., Chen, X.,
  after its departure from the Tibetan Plateau, Adv. Atmos. Sci.,          Chen, C., Xia, Y., Zhao, X., and Zhang, J.: Ambient air pollu-
  33, 34–46, https://doi.org/10.1007/s00376-015-5039-1, 2016.              tants are associated with newly diagnosed tuberculosis: a time-
Zhang, L., Guo, X., Zhao, T., Gong, S., Xu, X., Li, Y.,                    series study in Chengdu, China, Sci. Total Environ., 631, 47–55,
  Luo, L., Gui, K., Wang, H., Zheng, Y., and Yin, X.:                      https://doi.org/10.1016/j.scitotenv.2018.03.017, 2018.
  A modelling study of the terrain effects on haze pollu-
  tion in the Sichuan Basin, Atmos. Environ., 196, 77–85,
  https://doi.org/10.1016/j.atmosenv.2018.10.007, 2019.

https://doi.org/10.5194/acp-21-14493-2021                                               Atmos. Chem. Phys., 21, 14493–14505, 2021
You can also read