A SERUM METABOLOMICS STUDY OF PATIENTS WITH NAMD IN RESPONSE TO ANTI-VEGF THERAPY - NATURE
←
→
Page content transcription
If your browser does not render page correctly, please read the page content below
www.nature.com/scientificreports

            OPEN           A serum metabolomics study of
                           patients with nAMD in response to
                           anti-VEGF therapy
                           Yan Gao1, Yi Chong Kelvin Teo1,2, Roger W. Beuerman1,3,4, Tien Yin Wong1,2,3,4, Lei Zhou1,3,4* &
                           Chui Ming Gemmy Cheung1,2,4*
                           Intravitreal injection of anti-vascular endothelial growth factor (anti-VEGF) is the current standard
                           of treatment for choroidal neovascularization (CNV) secondary to neovascular age-related macular
                           degeneration (nAMD), but there are no diagnostic tools to predict response of these therapies. We
                           hypothesize that differences in baseline metabolic profiles of patients with nAMD may influence
                           responsiveness to anti-VEGF therapy, and thus provide prognosticating information for these patients.
                           A prospective study was performed on 100 patients with nAMD treated with anti-VEGF therapy. We
                           classified patients into two groups: responders (n = 54) and non-responders (n = 46). The expression
                           levels of glycerophosphocholine,LysoPC (18:2) and PS (18:0/20:4) were higher in non-responders
                           and these findings were verified in the validation cohort, implicating that reductions in these three
                           metabolites can be used as predictors for responsiveness to anti-VEGF therapy during the initial loading
                           phase for patients with nAMD. Our study also provided new insights into the pathophysiological
                           changes and molecular mechanism of anti- VEGF therapy for nAMD patients.

                           Age-related macular degeneration (AMD) is a common cause of blindness in elderly people1,2. The neovascular
                           form of AMD (nAMD) is characterized by abnormal vessel leakage and/or bleeding resulting in the formation of
                           fibrovascular tissue which leads to poor vision without treatment. Intravitreal injection of anti-vascular endothe-
                           lial growth factor (anti-VEGF) is the current standard of treatment for nAMD, showing excellent visual acuity
                           gains in large pivotal randomized controlled trials1,3,4.
                               However, there remains a broad range of responses to anti-VEGF treatment despite its overall efficacy in
                           the majority of patients. It has been suggested that exudation remains detectable in the eyes of >50% patients
                           after initial 3 months of treatment of anti-VEGF therapy5. Current methods used to identify “good” and “poor”
                           responders include stratifying disease status by markers of structure or function using tools such as optical
                           coherence tomography (OCT)6, fluorescein angiography for lesion type7, and visual acuity tests8. Some imaging
                           biomarkers such as the presence of intra retina fluid9–11 and clinical signs such as poor starting vision12,13 are
                           associated with long-term poor prognosis, but these biomarkers do not precisely predict response to anti-VEGF
                           treatment.
                               Patients with nAMD have been known to have systemic risk factors that are different from age-matched
                           controls, suggesting generalized alterations14. Metabolomics, the global quantitative assessment of endoge-
                           nous metabolites within a biological system15, may identify systemic metabolites responsible for differentiation
                           between individuals despite intra-individual variations16. This method could provide metabolite information
                           from environmental and lifestyle factors as well as individual characteristics such as dietary response and disease
                           history17. The metabolic profiling of a biological system can reflect the phenotype of the study subject and provide
                           information that is complementary to genomics, transcriptomics or proteomics studies18. The aim of our current
                           study is to examine baseline serum metabolic profile in patients with nAMD and to relate this to the anatomical
                           response from anti-VEGF therapy during the initial treatment phase over 3 months (typically referred to as the
                           “loading” dose phase).

                           1
                            Singapore Eye Research Institute, Singapore, Singapore. 2Singapore National Eye Centre, Singapore, Singapore.
                           3
                            Department of Ophthalmology, Yong Loo Lin School of Medicine, National University of Singapore, Singapore,
                           Singapore. 4Ophthalmology and Visual Sciences Academic Clinical Research Program, Duke-NUS Medical School,
                           National University of Singapore, Singapore, Singapore. *email: zhou.lei@seri.com.sg; gemmy.cheung.c.m@
                           singhealth.com.sg

Scientific Reports |   (2020) 10:1341 | https://doi.org/10.1038/s41598-020-58346-3                                                           1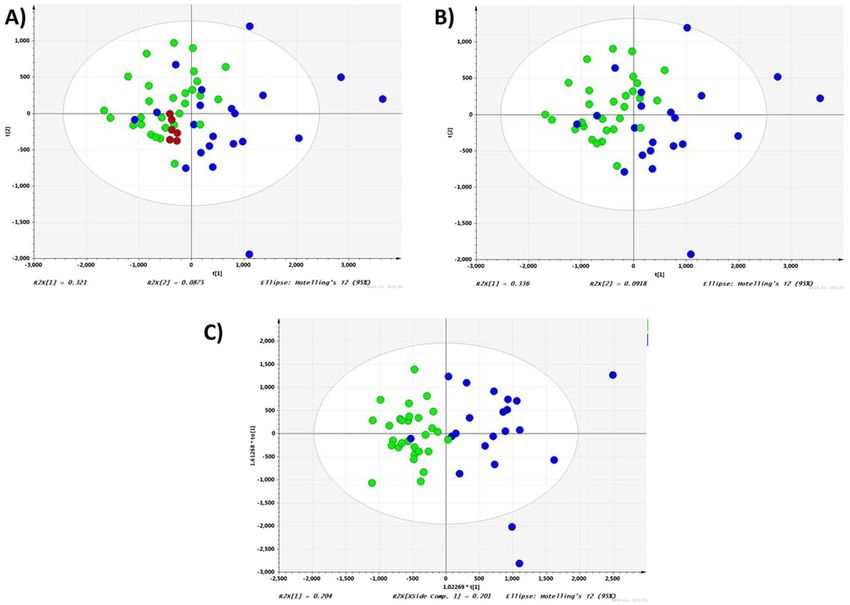
www.nature.com/scientificreports/                                                                                   www.nature.com/scientificreports

                                                           Testing set                                              Validation set
                                                           Responder               Non-responder          p-value   Responder               Non-responder        p-value
 Eyes, n                                                   29                      21                     —         25                      25                   —
 Age, years, mean (CI)                                     73.3 (69.8–76.8)        73.7 (69.2–78.2)       0.89      72.2 (68.6–75.8)        70.7 (67.3–74.1)     0.54
 Sex, male, n, (%)                                         15 (51.7)               13 (61.9)              0.48      16 (64.0)               13 (52.0)            0.4
 Systemic conditions at baseline
 IHD, n, (%)                                               3 (10.3)                0 (0.0)                0.13      2 (8.0)                 3 (12.0)             0.65
 Stroke, n, (%)                                            4 (13.8)                3 (14.3)               0.96      1 (4.0)                 0 (0)                0.32
 Diabetes, n, (%)                                          11 (37.9)               3 (14.3)               0.07      9 (36.0)                6 (24.0)             0.36
 Hyperlipidaemia, n, (%)                                   18 (62.1)               13 (61.9)              0.99      18 (72.0)               15 (60.0)            0.38
 Hypertension, n, (%)                                      20 (68.9)               13 (61.9)              0.61      15 (60.0)               20 (80.0)            0.13
 Smoking, n, (%)                                           3 (10.3)                4 (19.0)               0.39      6 (24.0)                7 (28.0)             0.75
 Chronic kidney disease, n (%)                             0 (0)                   0 (0)                  —         0 (0)                   0 (0)                —
 Clinical characteristics
 VA at baseline, logMAR units, (CI)                        0.89 (0.68–1.10)        0.88 (0.64–1.12)       0.94      0.89 (0.66–1.12)        0.63 (0.48–0.78)     0.07
 VA at month 3, logMAR units, (CI)                         0.60 (0.43–0.77)        0.71 (0.50–0.92)       0.32      0.55 (0.41–0.82)        0.65 (0.45–0.88)     0.71
 VA at month 12, logMAR units, (CI)                        0.50 (0.28–0.74)        0.68 (0.38–0.85)       0.51      0.52 (0.31–0.78)        0.63 (0.31–0.82)     0.52
 VA change from baseline to month 3, logMAR units, (CI)    −0.26 (−0.37–−0.08)     −0.15 (−0.31–0.02)     0.31      −0.28 (−0.35 – −0.10)   −0.05 (−0.25–0.01)   0.69
 VA change from baseline to month 12, logMAR units, (CI)   −0.38 (−0.45 – −0.12)   −0.14 (−0.30 − 0.02)   0.58      −0.30 (−0.35 – −0.09)   −0.03 (−0.23–0.01)   0.53
 CRT at baseline, μm, (CI)                                 488 (407–569)           488 (402–574)          0.99      426 (367–485)           476 (427–525)        0.21
 CRT at month 3, μm, (CI)                                  291 (252–330)           515 (399–631)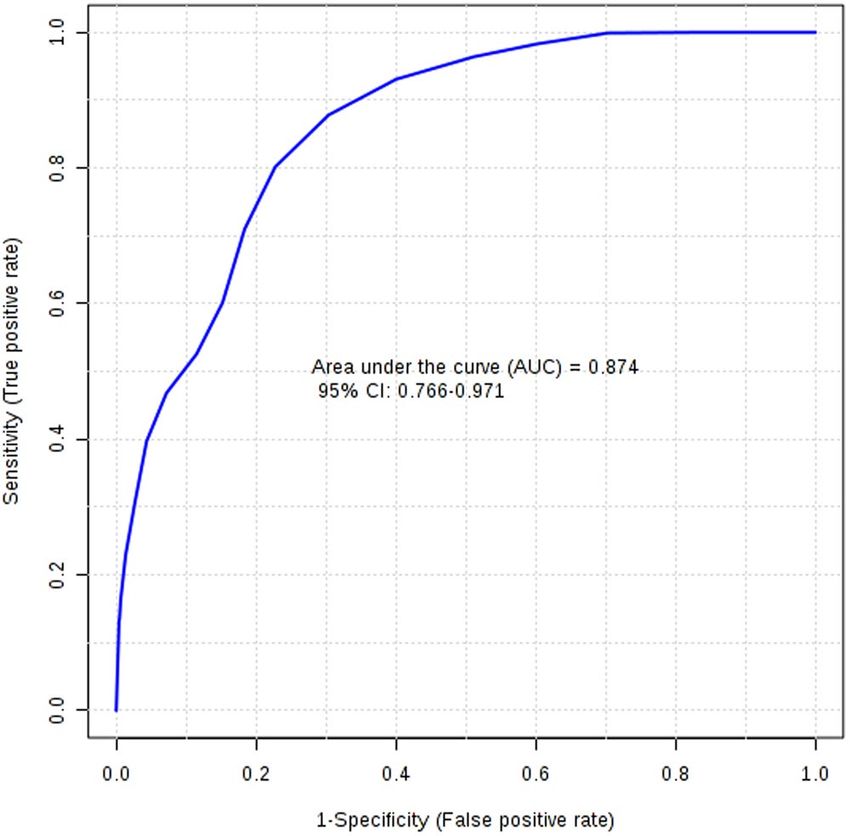
www.nature.com/scientificreports/                                                            www.nature.com/scientificreports

                           Figure 1. Volcano plot of serum metabolome comparing responders versus non-responders. Cutoff for p value
                           is < 0.05; fold change (nonresponders/responders) cutoff is >1.5 or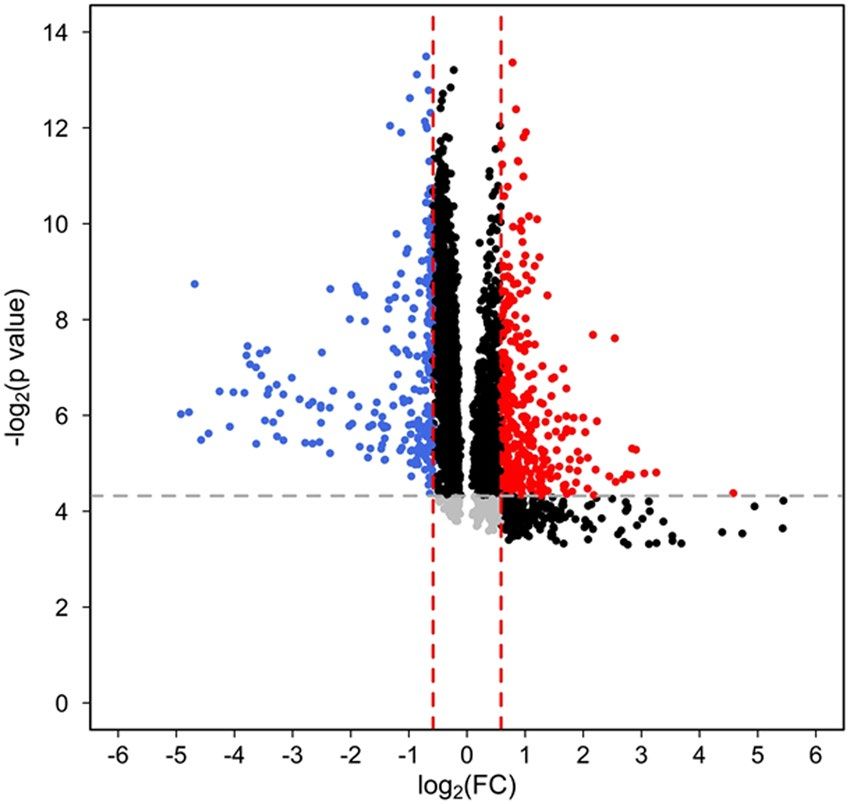
www.nature.com/scientificreports/                                                              www.nature.com/scientificreports

                           Figure 3. Receiver-operating characteristic curve for validation of metabolomics classification of responders
                           and non-responders.

                           VIP > 1) were selected as potential biomarkers. A list of identified metabolites can be found in Supplementary
                           Table S4.
                              The general metabolomics signature diagnostic for anti-VEGF responses in patients with nAMD was then
                           subjected to validation in an independent dataset consisting of 25 responders and 25 non-responders. The diag-
                           nostic signature had a sensitivity of 66.6% and a specificity of 82.7%. Overall the precision of the model (positive
                           predictive value) was 73.7%. The area under the receiver-operating characteristic (AUROC) was 0.874 (95% CI,
                           0.766–0.971) (Fig. 3).

                           Interpretation of metabolic differences between responders and non-responders. An analysis
                           of the LC-MS spectra was conducted to identify which metabolites were contributing to the metabolic profile
                           differentiation between responders and non-responders. Pathway analysis of these identified metabolites revealed
                           glycerophospholipid metabolism alteration (Fig. 4). Compared with profiles from non-responders, serum pro-
                           files from responders had significantly lower level of glycerophosphocholine, LysoPC (18:2) and PS (18:0/20:4)
                           in training set (p = 0.023, q = 0.0553; p = 0.020, q = 0.0529; p = 0.032, q = 0.0529). These results were confirmed
                           in the validation set (LysoPC (18:2) p = 0.031, q = 0.0743; PS (18:0/20:4) p = 0.038, q = 0.0743). Similar trend,
                           although not reaching statistical significance was also observed for glycerophosphocholine (p = 0.087, q = 0.1042)
                           (Fig. 5). Glycerophosphocholine was also verified by pure standards (see Supplementary Figure S1). The AUROC
                           for these three metabolites in training set and validation set was 0.833 and 0.762, respectively (Fig. 6).

                           Discussion
                           Previous metabolomics studies have shown patients with nAMD are different in metabolic profiles from similarly
                           aged persons without nAMD in pathways including tyrosine metabolism, sulfur amino acid metabolism, amino
                           acids related to urea metabolism16 and enrichment of glycerophospholipid pathway19,20. Osborn et al. found sig-
                           nificant differences in metabolites including peptides, bile acids and vitamin D in patients with nAMD com-
                           pared to age matched controls, and summarized that tyrosine and urea metabolism may be important in AMD
                           pathophysiology16. Another metabolomics study investigating AMD patients revealed that glycerophospholipid
                           pathway is associated with significantly altered metabolites between control group without any vitreoretinal dis-
                           ease and AMD group19. Our group has previously found higher serum level of glycerophospholipids, covalently
                           modified amino acids and di/tri-peptides, fatty acids and carnitines in patients with choroidal neovascularization
                           and polypoidal choroidal vasculopathy compared to healthy controls20. Small changes were also detected in the
                           levels of some amino acids, organic acids, dimethyl sulfone and specific moieties when investigating the plasma
                           metabolomics profiles of patients with AMD17. The intestinal microbiomes of nAMD patients were shown to be
                           enriched in genes of the L-alanine fermentation, glutamate degradation and arginine biosynthesis pathways and
                           decreased in genes of the fatty acid elongation pathways21. In this study, we now provide evidence that differences
                           in baseline metabolomics signatures in nAMD patients may also predict their responses to the initial treatment
                           (3 monthly anti-VEGF injections during the “loading phase”).
                               We found that the serum level of glycerophosphocholine (GPC) was higher in non-responders compared
                           to responders. GPC has been recognized as a degradation product of phosphatidylcholine, which is one of the
                           most important glycerophospholipids in mammalian cells22. Increased level of GPC has been detected in cer-
                           ebrospinal fluid of Alzheimer patients23 and a favorable response to neoadjuvant chemotherapy is associated

Scientific Reports |   (2020) 10:1341 | https://doi.org/10.1038/s41598-020-58346-3                                                           4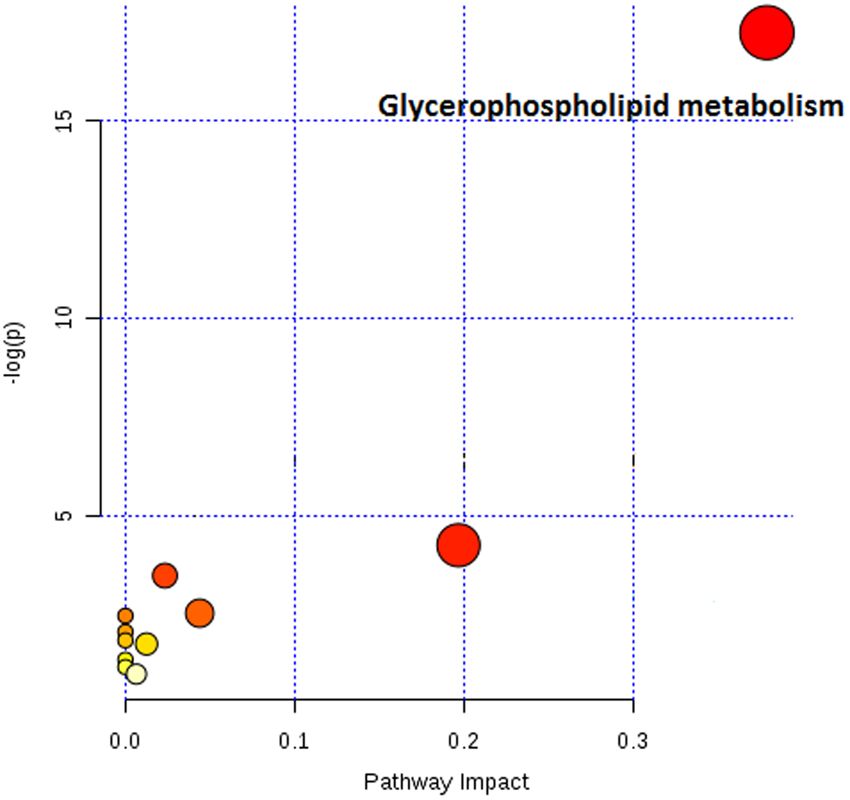
www.nature.com/scientificreports/                                                              www.nature.com/scientificreports

                           Figure 4. Graph showing pathway analysis based on metabolites associated with differentiation between
                           responders and non-responders of AMD patients. −log(p) = minus logarithm of the p value. The node color is
                           based on its p value and the node radius is determined based on their pathway impact values.

                           with a reduction in GPC concentration during the treatment for patients with breast cancer24. The breakdown
                           of phosphatidylcholine may be reflected in elevated concentrations of GPC in serum and results in altered phos-
                           phatidylcholine metabolism22,25. A correlation between phosphatidylcholine metabolism and tumor malignancy
                           and angiogenesis has been reported by Baek26 and Chen27. Higher concentration of GPC in non-responders may
                           be associated with increased angiogenesis that potentially can be used as a predictor of anti-VEGF therapy.
                               Elevated levels of LysoPC (18:2) and PS (18:0/20:4) were also detected and validated in non-responders.
                           Lysophosphatidylcholine (LysoPC) is a breakdown product of phosphatidylcholine and higher levels of LysoPC
                           have been linked to the cardiovascular complications associated with atherosclerosis28, ischemia29 and diabetes30.
                           LysoPC can be found in cell membrane or the polar surface of oxidized lipoproteins and plays an important role
                           in vascular development31.A study by Zou et al. revealed that higher level of LysoPC in aged aorta from rats is
                           likely responsible for reactive species generation, and thus enhances oxidative stress in old rat aorta32, suggesting
                           that increased level of LysoPC may play a significant role on redox balance during the vascular aging process.
                           LysoPCs are likely to be degraded from glycerophospholipids by the activity of phospholipase enzymes (sPLA2)33.
                           Glycerophospholipids are important for maintaining structural stability and membrane fluidity and have been
                           implicated in initiation and promulgation of oxidative stress in neurological disorders34. Accumulation of LysoPC
                           (18:2) in serum might have damaging effect on vascular modelling by induction of oxidative stress and thus result
                           in poor response to anti-VEGF therapy in our study. Phosphatidylserine (PS) is predominately localized in the
                           inner membrane leaflet and this asymmetry is actively maintained by ATP-dependent lipid transporters regula-
                           tions35. The loss of asymmetric distribution of phospholipid might results in changes of membrane biochemical
                           properties. Dysregulation of PS has been found in tumor microenvironment and antagonizes tumor immunity
                           development by acting as a global immunosuppressive signal in efferocytosis, infectious disease and cancer36.
                           Based on these evidences, agents targeting PS could have significant values in cancer and infectious disease ther-
                           apeutics. Similarly, Li et al. reported that PS is exposed in CNV endothelium and thus suggested antibodies tar-
                           geting exposed PS may have therapeutic value in CNV37. Therefore, up-regulation of PS (18:0/20:4) might have
                           side effects on AMD recovery.
                               Progressive Bruch’s membrane thickening and deposition of extracellular deposits with abundant lysophos-
                           pholipid and free fatty acids as drusen have been noted on histological sections of eyes with AMD, suggesting the
                           role of phosphatidylcholine hydrolysis as potential pathogenic mechanism in AMD38–42. However, the exact role
                           of serum lipid levels in AMD is not yet clear and studies on the association of serum lipid and AMD risk have
                           been inconsistent43–45. No significant difference in lipoprotein (a) concentrations was observed between AMD
                           patients with control groups in the study by Nowak et al.46 and there was no significant difference in total choles-
                           terol, triglycerides, phospholipids, high and low density lipoprotein-cholesterol concentration when compared
                           AMD patients with controls in another study45. On the other hand, Reynolds and colleagues revealed that higher
                           total cholesterol and low density lipoprotein were associated with increased risk whereas higher high density lipo-
                           protein levels tended to reduce AMD risk44. These controversial results might be due to high variability of lipid
                           and fatty acid levels and the use of medication and/or dietary intake47. Chen et al. detected elevated serum level
                           of glycerophospholipids in choroidal neovascularization and polypoidal choroidal vasculopathy group compared
                           to healthy controls in an untargeted metabolomics study20. Our results further support that phosphatidylcholine
                           hydrolysis may be more prominent in non-responders.
                               The current study has a number of limitations; firstly, a relatively small sample size was assessed. Secondly,
                           response was determined by anatomical changes after the initial treatment phase (after the first 3 treatments). The
                           anatomical change as assessed on OCT provides the best objective measure of response. Other functional outcomes

Scientific Reports |   (2020) 10:1341 | https://doi.org/10.1038/s41598-020-58346-3                                                            5
www.nature.com/scientificreports/ www.nature.com/scientificreports
Figure 5. Estimation plots of altered metabolites in responders and non-responders of AMD patients63. The mean
difference is depicted as a dot and the 95% confidence interval is indicated by the ends of the vertical error bar.
were also analysed at longer time points (12 months) but did not achieve statistical significance, most likely due to
the small sample size or the mismatch between functional and anatomical markers that is often observed in AMD
treatment48. Lastly, we considered all currently available anti-VEGF agents in this study with a vast majority of
patients receiving bevacizumab. This may have affected the proportion of responders versus non-responders.
It will be important to explore whether the findings from this study are reproducible in an independent
cohort and thus further testing in other clinical cohorts with nAMD will instruct on the utility of these diagnos-
tic biomarkers for screening. Further exploration into the reproducibility of findings in this study from differ-
ent ethnic groups should also be considered. It is also of interest to explore how metabolic profiles differentiate
among healthy control, responders and non-responders. A metabolomics study of all participating patients after
3 months’ treatment will also provide valuable information to confirm if these metabolite biomarkers are still
significantly altered.
Conclusion
In this study, we investigated serum metabolomics profile for responders and non-responders to anti-VEGF ther-
apy during the initial 3 monthly “loading” phase of treatment among a cohort of nAMD patients, which was
validated in an independent dataset. We found increased levels of GPC, LysoPC (18:2) and PS (18:0/20:4) in
non-responders, implicating significant impairment to glycerophospholipid metabolism. These biomarkers could
Scientific Reports | (2020) 10:1341 | https://doi.org/10.1038/s41598-020-58346-3 6www.nature.com/scientificreports/ www.nature.com/scientificreports
Figure 6. Receiver-operating characteristic curve for three metabolite biomarkers (glycerophosphocholine
LysoPC (18:2) and PS (18:0/20:4)) in training set (A) and validation set.
be used as predictive responses to initial anti-VEGF therapy. By differentiating responders and non-responders
to the current treatment early in patients’ treatment journey, we suggest that such biomarker information may
offer an indication to consider an early switch to different agent or class of drug. This is especially relevant now
with newer therapies with different pharmacokinetics and modes of action such as brolucizumab and faricimab
currently under study5,49. Our findings might provide treatment information for AMD patients and offer novel
targets for AMD pathogenesis.
Materials and Methods
Study design and participants. We performed a prospective case-control study using baseline serum
from a total of 100 participants with nAMD who participated in a prospective clinical cohort study, the Asian
AMD Phenotyping Study as described previously50,51. Briefly, the study prospectively recruited consecutive treat-
ment-naıve participants with nAMD from the retinal clinic of the Singapore National Eye Centre from March
2010 and is still ongoing. The study was approved by the SingHealth Institutional Review Board (IRB Approval
number: 2009/788/A) and was conducted in accordance with the Declaration of Helsinki (protocol number
R697/47/2009 and R498/47/2006). Informed consent was obtained from all participants.
Demographic and medical history. Baseline socio-demographic and medical history was collected using
an interviewer-administered questionnaire which was previously validated52–54. Data included information on
participants’ lifestyle factors, history of smoking, current medications, systemic medical and surgical history.
Clinical measurement variables. At the baseline visit, all patients underwent a full ophthalmic examina-
tion, color fundus photography, fluorescein and indocyanine green angiography and optical coherence tomogra-
phy (OCT) (Heidelberg Engineering GmbH, Dossenheim, Germany). Baseline measure of best corrected visual
acuity (VA) recorded as whichever reading was best: uncorrected, corrected or pinhole, was expressed as the
logarithm of the minimum angle of resolution (logMAR). Central retinal thickness (CRT) was obtained using
the in-built software where an automated segmentation algorithm was used to produce retinal thickness map of
the central 1 mm zone.
All patients received three injections at monthly intervals of intravitreal anti-VEGF. The choice of agent type
(aflibercept, bevacizumab or ranibizumab) was decided by the treating physician.
Patients were evaluated at month 3 and categorized into treatment responders (responder group, n = 54) or
treatment non responders (non-responder group, n = 46). Treatment response was based on OCT findings of
disease activity. Responders were defined as eyes with no sub- or intra-retinal fluid at month 3. Non-responders
were defined by persistent sub- or intra- retinal fluid at month 3. All OCT scans were qualitatively analysed by 2
graders blinded to each other’s decision (KYCT, CMGC). Any grading disagreement was openly arbitrated and
the final decision was made by the senior grader (CMGC).
LC-MS based metabolic profiling analysis. The recruited samples were randomly divided into two
independent cohorts, i.e. a training set and a validation set. The training set, including 29 responders and 21
non-responders, was used to establish if serum metabolomics profiles could distinguish between patients with
nAMD regarding their response to anti-VEGF injections. The validation set, comprising 25 responders and 25
non-responders, was used to independently validate the metabolite biomarkers and assess the effect of anti-VEGF
on nAMD patients.
After enrolment, blood was extracted from the cubital vein of each participant. The blood was then imme-
diately transferred to the collection tube and kept at room temperature for 30 min to allow clotting. The clotted
Scientific Reports | (2020) 10:1341 | https://doi.org/10.1038/s41598-020-58346-3 7www.nature.com/scientificreports/ www.nature.com/scientificreports
blood samples were centrifuged at 3000 g at 4 °C for 20 min to eliminate the supernatant serum and then quickly
stored at −80 °C prior to metabolomics detection.
Metabolites were extracted from 200 µl serum samples using 800 ul ice cold 1:1:1(v/v/v) methanol/acetone/
acetonitrile, incubated at −20 °C for 30 min, and centrifuged at 16,000 g for 15 min (4 °C) to remove protein. Each
sample extract was divided into two equal aliquots and dried in a vacuum concentrator before LC-MS analysis.
Each sample was analyzed both on reverse phase (RP) column and hydrophilic interaction chromatography
(HILIC) column in positive and negative ionization modes, i.e. RP + , RP-, HILIC + , HILIC- (Table S1). Aliquots
for RP injection were reconstituted in 25 µl 2% acetonitrile and aliquots for HILIC column injections were recon-
stituted in 25 µl 80% acetonitrile. Metabolites separation was performed on an ACQUITY I-class UPLC system
(Waters, Milford, Massachusetts, US). The injection volume was 10 µl and flow rate was 0.6 ml/min. The column
and auto-sampler were maintained at 40 °C and 10 °C, respectively. Table S1 listed the columns, mobile phases and
gradients for RP and HILIC. Quality control samples were prepared by pooling equal volume of all serum samples
in this study to monitor the stability and repeatability during LC-MS analysis. The pretreatment of QC samples
was the same as that of real samples and were injected after every ten samples.
Mass detection was achieved on a TripleTOF 5600 fitted with a DuoSpray ion source (SCIEX, Foster,
California, US). Mass calibration was automatically performed after every 20 injections by the automated cali-
bration delivery system. The source voltage was set to 5500 V for positive ionization and 4500 V for negative
ionization mode. The declustering potential was 80 V and source temperature was 500 °C for both polarities.
The curtain gas flow, nebulizer and heater gas were set to 30, 55 and 60 arbitrary units, respectively. Information
dependent acquisition (IDA) was used to collect full scan MS and MSMS information simultaneous with an m/z
mass range of 100–1000. The instrument performed a TOFMS survey with 160 ms accumulation time, followed
by 5 MSMS scans with 18 ms accumulation time. The collision energy was linearly ramped from 20 to 40 V. The
following parameters were also applied to data acquisition: dynamic background subtraction, charger monitoring
to exclude multiple charged ions and dynamic exclusion of former target ions for 1 s.
Peak extraction and quantification of ion intensities were performed using both XCMS online55 and
Markerview (SCIEX), which provide lists containing m/z values, retention time and integrated ion intensity for
each m/z features.
Statistical analysis. Descriptive data are presented as mean (confidence interval) or number (percentage).
Statistical tests such as Student’s t-test, and chi squared test were used where appropriate to compare demographic
and clinical characteristics between the responder and non-responder groups. Analyses for demographic and
clinical characteristics were calculated using R V3.3.156.
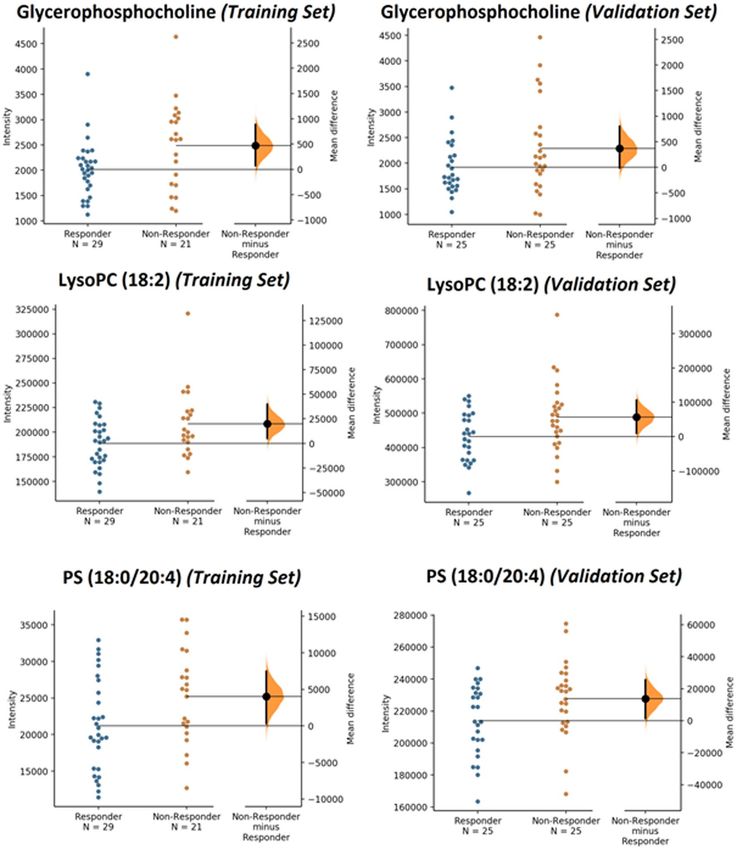
A combination of analysis of the variance (ANOVA) and multivariate analysis methods including principle
component analysis (PCA) and orthogonal partial least squares-discriminant analysis (OPLS-DA) using SMICA
(Umertrics, Umea, Sweden) were used to select potential metabolites which are the most responsible for the
differentiation between groups. Student’s t-test was used for statistical comparison of pairs of groups and a p
value < 0.05 and q value < 0.1 (adjusted using logistic regression) was considered as a priori to be statically sig-
nificant. The peak lists from both positive and negative mode were normalized by total ion intensity and Pareto
scaled first. A PCA was first performed to show a trend of intergroup separation on the score plots. The tight clus-
ter of QC samples in PCA score plot indicated robustness of our metabolic profiling platform (Fig. 2A). R2Y and
Q2Y scores were used for assessment of variance coverage by predictive component and model predictability in a
seven times cross-validation, respectively57. A 999 times permutation test was carried out to confirm the stability
and robustness of OPLS-DA model. A Q2 intercept of zero or below from permutation test demonstrates the
stability and non-randomness of the model and thus strongly supports the validity of the model58.
Metabolite annotation and pathway analysis. Metabolites identification was achieved by database
search against accurate m/z and MS/MS spectra with METLIN59 and HMDB60. MetaboAnalyst was used for
pathway analysis61. Selected metabolites were further validated by commercially available pure standards. GPC
was purchased from Sigma-Aldrich (St. Louis, Missouri, US).
Data availability
All the metabolomics datasets described in our study can be accessed at MetaboLights62 (https://www.ebi.ac.uk/
metabolights/) (Project ID: MTBLS950). All other data supporting the findings of this study are included in this
published article as Supplementary Data.
Received: 5 July 2019; Accepted: 9 January 2020;
Published: xx xx xxxx
References
1. Lim, L. S., Mitchell, P., Seddon, J. M., Holz, F. G. & Wong, T. Y. Age-related macular degeneration. Lancet 379, 1728–1738 (2012).
2. Wong, W. L. et al. Global prevalence of age-related macular degeneration and disease burden projection for 2020 and 2040: a
systematic review and meta-analysis. Lancet Glob. Heal. 2, e106–e116 (2014).
3. Kiviat, N. B., Holmes, K. K., Ph, D., Koutsky, L. A. & Ph, D. Ranibizumab for Neovascular Age-Related Macular Degeneration. N.
Engl. J. Med. 355, 1419–1431 (2016).
4. Brown, D. M. et al. Ranibizumab versus Verteporfin for Neovascular Age-Related Macular Degeneration. N. Engl. J. Med. 355,
1432–1444 (2006).
5. Dugel, P. U. et al. HAWK and HARRIER: phase 3, multicenter, randomized, double-masked trials of brolucizumab for neovascular
age-related macular degeneration. Ophthalmology, https://doi.org/10.1016/j.ophtha.2019.04.017 (2019).
6. Ying, G. et al. Baseline predictors for one-year visual outcomes with ranibizumab or bevacizumab for neovascular age-related
macular degeneration. Ophthalmology 120, 122–129 (2013).
Scientific Reports | (2020) 10:1341 | https://doi.org/10.1038/s41598-020-58346-3 8www.nature.com/scientificreports/ www.nature.com/scientificreports
7. Boyer, D. S. et al. Subgroup analysis of the MARINA study of ranibizumab in neovascular age-related macular degeneration.
Ophthalmology 114, 246–252 (2007).
8. Kaiser, P. K. et al. Ranibizumab for predominantly classic neovascular age-related macular degeneration: subgroup analysis of first-
year ANCHOR results. Am. J. Ophthalmol. 144, 850–857 (2007).
9. Vogl, W.-D. et al. Analyzing and Predicting Visual Acuity Outcomes of Anti-VEGF Therapy by a Longitudinal Mixed Effects Model
of Imaging and Clinical Data. Invest. Ophthalmol. Vis. Sci. 58, 4173–4181 (2017).
10. Ying, G. et al. Association of Baseline Characteristics and Early Vision Response with 2-Year Vision Outcomes in the Comparison
of AMD Treatments Trials (CATT). Ophthalmology 122, 2523–31.e1 (2015).
11. Jaffe, G. J. et al. Macular Morphology and Visual Acuity in Year Five of the Comparison of Age-related Macular Degeneration
Treatments Trials. Ophthalmology 126, 252–260 (2019).
12. Nguyen, V. et al. Projection of Long-Term Visual Acuity Outcomes Based on Initial Treatment Response in Neovascular Age-Related
Macular Degeneration. Ophthalmology 126, 64–74 (2019).
13. Chae, B. et al. Baseline Predictors for Good Versus Poor Visual Outcomes in the Treatment of Neovascular Age-Related Macular
Degeneration With Intravitreal Anti-VEGF Therapy. Invest. Ophthalmol. Vis. Sci. 56, 5040–5047 (2015).
14. Cheung, C. M. G. & Wong, T. Y. Is age-related macular degeneration a manifestation of systemic disease? New prospects for early
intervention and treatment. J. Intern. Med. 276, 140–153 (2014).
15. Spratlin, J. L., Serkova, N. J. & Eckhardt, S. G. Clinical applications of metabolomics in oncology: A review. Clin. Cancer Res. 15,
431–440 (2009).
16. Osborn, M. P. et al. Metabolome-Wide Association Study of Neovascular Age-Related Macular Degeneration. PLoS One 8, e72737
(2013).
17. Laíns, I. et al. Human plasma metabolomics in age-related macular degeneration (AMD) using nuclear magnetic resonance
spectroscopy. PLoS One 12, e0177749 (2017).
18. Latonen, L. et al. Integrative proteomics in prostate cancer uncovers robustness against genomic and transcriptomic aberrations
during disease progression. Nat. Commun. 9, 1176 (2018).
19. Laíns, I. et al. Human Plasma Metabolomics Study across All Stages of Age-Related Macular Degeneration Identifies Potential Lipid
Biomarkers. In Ophthalmology 125, 288–294 (2018).
20. Chen, G. et al. Customized Consensus Spectral Library Building for Untargeted Quantitative Metabolomics Analysis with Data
Independent Acquisition Mass Spectrometry and MetaboDIA Workflow. Anal. Chem. 89, 4897–4906 (2017).
21. Zinkernagel, M. S. et al. Association of the Intestinal Microbiome with the Development of Neovascular Age-Related Macular
Degeneration. Sci. Rep. 7, 40826 (2017).
22. Zablocki, K., Miller, S. P., Garcia-Perez, A. & Burg, M. B. Accumulation of glycerophosphocholine (GPC) by renal cells: osmotic
regulation of GPC:choline phosphodiesterase. Proc. Natl. Acad. Sci. 88, 7820 LP–7824 (1991).
23. Walter, A. et al. Glycerophosphocholine is elevated in cerebrospinal fluid of Alzheimer patients. Neurobiol. Aging 25, 1299–1303
(2004).
24. Cao, M. D. et al. Prognostic value of metabolic response in breast cancer patients receiving neoadjuvant chemotherapy. BMC Cancer
12, 39 (2012).
25. Klein, J. Membrane breakdown in acute and chronic neurodegeneration: focus on choline-containing phospholipids. J. Neural
Transm. 107, 1027–1063 (2000).
26. Baek, H.-M., Yu, H. J., Chen, J.-H., Nalcioglu, O. & Su, M.-Y. Quantitative correlation between 1H MRS and dynamic contrast-
enhanced MRI of human breast cancer. Magn. Reson. Imaging 26, 523–531 (2008).
27. Chen, J.-H. et al. Clinical characteristics and biomarkers of breast cancer associated with choline concentration measured by 1H
MRS. NMR Biomed. 24, 316–324 (2011).
28. Matsumoto, T., Kobayashi, T. & Kamata, K. Role of lysophosphatidylcholine (LPC) in atherosclerosis. Curr. Med. Chem. 14,
3209–3220 (2007).
29. Daleau, P. Lysophosphatidylcholine, a metabolite which accumulates early in myocardium during ischemia, reduces gap junctional
coupling in cardiac cells. J. Mol. Cell. Cardiol. 31, 1391–1401 (1999).
30. Iwase, M. et al. Lysophosphatidylcholine contents in plasma LDL in patients with type 2 diabetes mellitus: relation with lipoprotein-
associated phospholipase A2 and effects of simvastatin treatment. Atherosclerosis 196, 931–936 (2008).
31. Choi, J. et al. Lysophosphatidylcholine is generated by spontaneous deacylation of oxidized phospholipids. Chem. Res. Toxicol. 24,
111–118 (2011).
32. Heo, H.-S. et al. Lysophosphatidylcholine Enhances Oxidative Stress Via the 5-Lipoxygenase Pathway in Rat Aorta During Aging.
Rejuvenation Res. 12, 15–24 (2009).
33. Adibhatla, R. M. & Hatcher, J. F. Phospholipase A(2), reactive oxygen species, and lipid peroxidation in CNS pathologies. BMB Rep.
41, 560–567 (2008).
34. Farooqui, A. A., Horrocks, L. A. & Farooqui, T. Interactions Between Neural Membrane Glycerophospholipid and Sphingolipid
Mediators: A Recipe for Neural Cell Survival or Suicide. J. Neurosci. Res. 85, 1834–1850 (2007).
35. Vance, J. E. & Tasseva, G. Formation and function of phosphatidylserine and phosphatidylethanolamine in mammalian cells.
Biochim. Biophys. Acta 1831, 543–554 (2013).
36. Birge, R. B. et al. Phosphatidylserine is a global immunosuppressive signal in efferocytosis, infectious disease, and cancer. Cell Death
Differ. 23, 962 (2016).
37. Li, T. et al. Phosphatidylserine (PS) Is Exposed in Choroidal Neovascular Endothelium: PS-Targeting Antibodies Inhibit Choroidal
Angiogenesis In Vivo and Ex VivoAntibody Targeting of Exposed PS on CNV. Invest. Ophthalmol. Vis. Sci. 56, 7137–7145 (2015).
38. Hageman, G. S. et al. An Integrated Hypothesis That Considers Drusen as Biomarkers of Immune-Mediated Processes at the RPE-
Bruch’s Membrane Interface in Aging and Age-Related Macular Degeneration. Prog. Retin. Eye Res. 20, 705–732 (2001).
39. Wang, L. et al. Lipoprotein particles of intraocular origin in human bruch membrane: An unusual lipid profile. Investig. Ophthalmol.
Vis. Sci. 50, 870–877 (2009).
40. Curcio, C. A., Johnson, M., Huang, J.-D. & Rudolf, M. Apolipoprotein B-containing lipoproteins in retinal aging and age-related
macular degeneration. J. Lipid Res. 51, 451–467 (2010).
41. Curcio, C. A., Johnson, M., Huang, J. D. & Rudolf, M. Aging, age-related macular degeneration, and the response-to-retention of
apolipoprotein B-containing lipoproteins. Prog. Retin. Eye Res. 28, 393–422 (2009).
42. Cheung, C. M. G. et al. Plasma lipoprotein subfraction concentrations are associated with lipid metabolism and age-related macular
degeneration. J. Lipid Res. 58, 1785–1796 (2017).
43. Yang, J. et al. Changes in retinal metabolic profiles associated with form deprivation myopia development in Guinea pigs. Sci. Rep.
7, 1–9 (2017).
44. Reynolds, R., Rosner, B. & Seddon, J. M. Serum Lipid Biomarkers and Hepatic Lipase Gene Associations with Age-Related Macular
Degeneration. Ophthalmology 117, 1989–1995 (2018).
45. Abalain, J.-H. et al. Is age-related macular degeneration associated with serum lipoprotein and lipoparticle levels? Clin. Chim. Acta.
326, 97–104 (2002).
46. Nowak, M. et al. Changes in lipid metabolism in women with age-related macular degeneration. Clin. Exp. Med. 4, 183–187 (2005).
47. Kersten, E. et al. Systemic and ocular fluid compounds as potential biomarkers in age-related macular degeneration. Surv.
Ophthalmol. 63, 9–39 (2018).
Scientific Reports | (2020) 10:1341 | https://doi.org/10.1038/s41598-020-58346-3 9www.nature.com/scientificreports/ www.nature.com/scientificreports
48. Fukui, M. et al. Serum uric acid is associated with microalbuminuria and subclinical atherosclerosis in men with type 2 diabetes
mellitus. Metabolism. 57, 625–629 (2008).
49. Khanani, A. M. Simultaneous Inhibition of VEGF and Ang-2 with Faricimab in Neovascular AMD: STAIRWAY Phase 2 Results. in
(Presented at the 2018 American Academy of Ophthalmology (AAO) Annual Meeting; 2018).
50. Cheung, C. M. G. et al. Asian age-related macular degeneration phenotyping study: rationale, design and protocol of a prospective
cohort study. Clin. Experiment. Ophthalmol. 40, 727–735 (2012).
51. Cheung, C. M. G. et al. A prospective study of treatment patterns and 1-year outcome of asian age-related macular degeneration and
polypoidal choroidal vasculopathy. PLoS One 9 (2014).
52. Fenwick, E. K. et al. Change in vision-related quality of life and influencing factors in Asians receiving treatment for neovascular
age-related macular degeneration. Br. J. Ophthalmol. 102, 377–382 (2018).
53. Fan, Q. et al. HDL-cholesterol levels and risk of age-related macular degeneration: a multiethnic genetic study using Mendelian
randomization. Int. J. Epidemiol. 46, 1891–1902 (2017).
54. Sabanayagam, C. et al. Urinary Isoprostane Levels and Age-Related Macular Degeneration. Invest. Ophthalmol. Vis. Sci. 58,
2538–2543 (2017).
55. Tautenhahn, R., Patti, G. J., Rinehart, D. & Siuzdak, G. XCMS Online: A Web-Based Platform to Process Untargeted Metabolomic
Data. Anal. Chem. 84, 5035–5039 (2012).
56. R Core Team. R: A Language and Environment for Statistical Computing. (2014).
57. Farshidfar, F. et al. A validated metabolomic signature for colorectal cancer: exploration of the clinical value of metabolomics. Br. J.
Cancer 115, 848–857 (2016).
58. Triba, M. N. et al. PLS/OPLS models in metabolomics: the impact of permutation of dataset rows on the K-fold cross-validation
quality parameters. Mol. BioSyst. 11, 13–19 (2015).
59. Smith, C. A. et al. METLIN: a metabolite mass spectral database. Ther Drug Monit 27, 747–751 (2005).
60. Wishart, D. S. et al. HMDB 3.0—The Human Metabolome Database in 2013. Nucleic Acids Res. 41, D801–D807 (2013).
61. Xia, J., Sinelnikov, I. V., Han, B. & Wishart, D. S. MetaboAnalyst 3.0—making metabolomics more meaningful. Nucleic Acids
Research 43, W251–W257 (2015).
62. Haug, K. et al. MetaboLights—an open-access general-purpose repository for metabolomics studies and associated meta-data.
Nucleic Acids Res. 41, D781–D786 (2012).
63. Ho, J., Tumkaya, T., Aryal, S., Choi, H. & Claridge-Chang, A. Moving beyond P values: Everyday data analysis with estimation plots.
bioRxiv 377978, https://doi.org/10.1101/377978 (2019).
Acknowledgements
This work was supported by an A-STAR Strategic Positioning Fund (SPF2014/002) to SIPRAD, SERI (Singapore
Eye Research Institute) IMCB (Institute of Molecular and Cell Biology) Programme in Retinal Angiogenic
Diseases and National Medical Research Council Open Fund Large Collaborative Grant: NMRC/LCG/004/2018.
The authors would like to thank SingHealth Foundation for supporting the proteomics core facility at the
Singapore Eye Research Institute and Centre Grant CG 2013 and CG 2017 from Singapore National Medical
Research Council (NMRC).
Author contributions
L.Z. and C.M.G.C. conceived the idea and designed the research. Y.G. performed the metabolomics analysis,
Y.G. and L.Z. contributed to the interpretation of data. Y.C.K.T. and C.M.G.C. collected sample and clinical
information. R.W.B. and T.Y.W. contributed to data discussion. Y.G., Y.C.K.T., L.Z. and C.M.G.C. discussed the
results and wrote the manuscript text.
Competing interests
The authors declare no competing interests.
Additional information
Supplementary information is available for this paper at https://doi.org/10.1038/s41598-020-58346-3.
Correspondence and requests for materials should be addressed to L.Z. or C.M.G.C.
Reprints and permissions information is available at www.nature.com/reprints.
Publisher’s note Springer Nature remains neutral with regard to jurisdictional claims in published maps and
institutional affiliations.
Open Access This article is licensed under a Creative Commons Attribution 4.0 International
License, which permits use, sharing, adaptation, distribution and reproduction in any medium or
format, as long as you give appropriate credit to the original author(s) and the source, provide a link to the Cre-
ative Commons license, and indicate if changes were made. The images or other third party material in this
article are included in the article’s Creative Commons license, unless indicated otherwise in a credit line to the
material. If material is not included in the article’s Creative Commons license and your intended use is not per-
mitted by statutory regulation or exceeds the permitted use, you will need to obtain permission directly from the
copyright holder. To view a copy of this license, visit http://creativecommons.org/licenses/by/4.0/.
© The Author(s) 2020
Scientific Reports | (2020) 10:1341 | https://doi.org/10.1038/s41598-020-58346-3 10You can also read