A Social Cost of Carbon for the ACT - DRAFT Prepared for the ACT Government By Nicki Hutley, Rovingstone Advisory Pty Ltd
←
→
Page content transcription
If your browser does not render page correctly, please read the page content below
A Social Cost of Carbon for the ACT

  DRAFT Prepared for the ACT Government
  By Nicki Hutley, Rovingstone Advisory Pty Ltd
                                                  1
  18 March 2021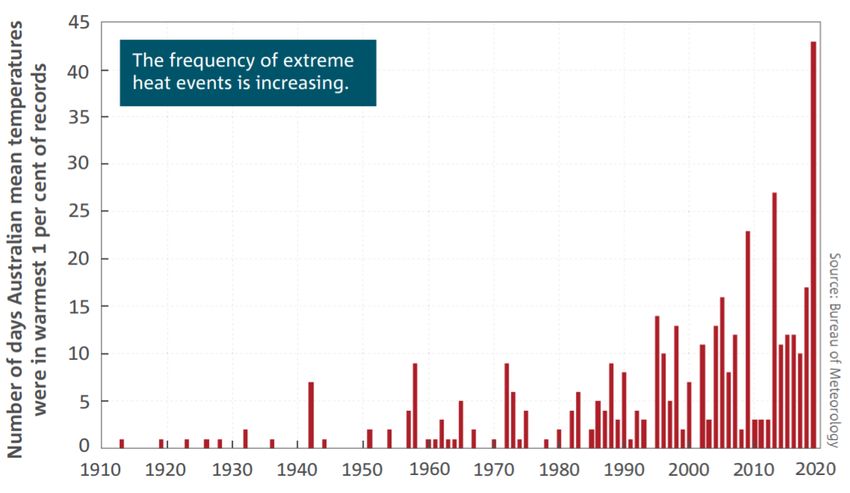
Table of Contents
Acronyms and Abbreviations .................................................................................................................... 2
Executive Summary .................................................................................................................................. 3
1      Background ....................................................................................................................................... 8
    1.1      Options for a Cost of Carbon ................................................................................................................. 8
       1.1.1        Market price .................................................................................................................................. 8
       1.1.2        Social Cost of carbon ..................................................................................................................... 9
    1.2      Structure of report .............................................................................................................................. 10
2      A Social Cost of Carbon – theory and practice ............................................................................... 12
    2.1      The US ................................................................................................................................................. 12
    2.2      Canada ................................................................................................................................................ 15
    2.3      United Kingdom .................................................................................................................................. 15
    2.4      Germany.............................................................................................................................................. 17
    2.5      Conclusions ......................................................................................................................................... 17
3      A Social Cost of Carbon for the ACT................................................................................................ 19
    3.1      Global or regional? .............................................................................................................................. 19
    3.2      Forecast values for the ACT ................................................................................................................. 19
4      Discount rates for a Social Cost of Carbon ..................................................................................... 21
5      A Social Cost of Carbon – limitations .............................................................................................. 24
    5.1      Economic and population growth ....................................................................................................... 24
    5.2      Emissions, climate pathways and damages ......................................................................................... 24
    5.3      Considerations .................................................................................................................................... 25
6      Emerging Scientific evidence .......................................................................................................... 27
    6.1      Heat waves .......................................................................................................................................... 27
       6.1.1        Scientific evidence on outlook for heatwaves ............................................................................. 28
       6.1.2        Economic and social impacts ....................................................................................................... 29
    6.2      Bushfires ............................................................................................................................................. 30
       6.2.1        Scientific evidence on the outlook for bushfires ......................................................................... 31
       6.2.2        Economic and social impacts ....................................................................................................... 31
    6.3      Drought ............................................................................................................................................... 32
    6.4      Hail ...................................................................................................................................................... 33
7      Conclusions and recommendations ............................................................................................... 34
Appendix A: SCC forecasts for ACT from 2020 to 2050 .......................................................................... 36

                                                                                                                                                                         1
Acronyms and Abbreviations
BoM Bureau of Meteorology
CBA Cost Benefit Analysis
C02 Carbon Dioxide
CSIRO Commonwealth Scientific and Industrial Research Organisation
DICE Dynamic Integrated Climate Change (IAM model)
EPA Environmental Protection Agency
ETS Emissions Trading Scheme
EU European Union
EUA European Union Allowance (carbon permit unit)
FFDI Forest Fire Danger Index
FUND Framework for Uncertainty, Negotiation and Distribution (IAM model)
GHG Greenhouse gas
IAM Integrated Assessment Model
IPCC Intergovernmental Panel on Climate Change
IWG Interagency Working Group
NPV Net Present Value
PAGE Policy Analysis of the Greenhouse Effect (IAM model)
RGGI (US) Regional Greenhouse Gas Initiative
SCC Social Cost of carbon
2Executive Summary
The ACT Government is committed to achieving net zero in greenhouse gas emissions by 2045. Such a
goal will require significant investment by the government. Approaches by governments to evaluate
potential investments vary but the most common and rigorous is Cost Benefit Analysis. Other
approaches include Cost Effectiveness Analysis or a Social Return on Investment framework.
Whatever the approach chosen, it is important that costs and benefits evaluated are as
comprehensively and robustly as possible. For climate-related policies and investments, one of the
most crucial elements to measure to ensure investment opportunities are being carefully weighed is
putting an appropriate value on the Greenhouse Gas emissions that will be avoided – most commonly
carbon dioxide (CO2). This ensures that government delivers a return on its investment that is at least
equal to the cost.
This paper explores the opportunities and challenges associated with adopting the most appropriate
price for (avoided) carbon emissions, for use in the economic analysis of potential mitigation policies
and investments.
Carbon pricing options
There are two key methods to pricing carbon: a market price or the Social Cost of Carbon (SCC),
sometimes also referred to a “damages” price.
Governments around Australia provide little formal guidance on pricing carbon in economic analysis.
NSW Treasury Guidelines are the most prescriptive, stating that a market price should be used where
this is reliable; otherwise, a “damages” approach to carbon pricing should be used.
It is well-recognised, however, that market mechanisms, where they exist, are not very reliable due
to a combination of design flaws, over-supply of permits, soft economic activity and imperfect
information. A damages approach (the SCC) is therefore more robust and meaningful for public
decision- making.
The SCC uses Integrated Assessment Models (IAMs), which combine scientific and economic
information across thousands of complex interactions, to estimate the net present value (NPV) of
climate change impacts (negative and positive) as a result of one additional tonne of carbon dioxide
emitted to the atmosphere today.
An alternative approach, referred to as “shadow pricing”, uses these economic models to estimate
the cost of containing emissions to achieve a particular level of atmospheric carbon concentration
required to limit temperature rise and damages.
3Economic concepts: Net Present Value and discount rates
Net present value (NPV) measures the current dollar value of future dollars, such as returns to an
investment over time, recognising that individuals typically value a dollar today more than a dollar in
the future. NPV is calculated by “discounting” expected future cash flows or benefits from an
investment using a discount rate, which typically reflects the rate of return required to receive a
dollar in the future, rather than now. For example, an individual typically requires a return of
between 0% and 4% to have an incentive to invest their money, rather than spend it now. Businesses
usually require a higher rate of return.
International practice
Many countries around the world have adopted a SCC. The most well-known estimates are those
developed by the US Interagency Working Group (IWG) and published by the US Environmental
Protection Agency. Three IAMs, each using numerous scientific and economic assumptions and
scenarios, are used to derive average estimates for an SCC to 2050. A stylised diagram of key IAMs
relationships is shown below.
Climate and economic relationships in IAMs
Source: Rovingstone Advisory, based on https://deconstructingrisk.com/tag/integrated-assessment-models/
4Under the Trump administration, the IWG was disbanded and the models have not been updated
since 2016. Estimates based on US-only damages and a 7% discount rate were instead adopted.
President Biden reversed this decision by executive order in January 2021 and the IWG will be
reinstated and models updated.
Given the advancement in our understanding of climate science and the potential damages climate
change can create, current US estimates likely represent an underestimate of the true SCC.
Nevertheless, they are the most comprehensive and robust available. Other countries, such as
Canada and Germany, that also use an SCC base their estimates on these same models, but apply
global damages estimates and a 3% discount rate.
Global or local?
While country-level estimates of SCCs can be useful for understanding localised impacts, they are not
considered appropriate for economic modelling of policy analysis. Greenhouse gas emissions
produced by any one country affect the global environment, society and economy. For example, it is
estimated that for every tonne of CO2 emitted in the US, 85% of the damages occur externally. Using
a country- or regional-level SCC would ignore total damages caused and could limit the potential for
coordinated global action. In a 2016 US Court of Appeals case, the Court ruled that “global effects are
an appropriate consideration when looking at a national policy.”
Discount rates
The most controversial aspect of modelling a SCC is the discount rate chosen. Because estimates of
damages in IAMs are projected out to 2300, the rate chosen has a very significant effect on estimates.
Most economists agree that a Social Rate of Time Preference should be used – typically between 0%
and 4% – reflecting an individual’s willingness to postpone consumption now in order to consume
later, but do not agree on what value to set. The debate is largely ethical rather than economic in that
the rate chosen reflects the value we place on future generations compared to our own.
In a survey of 197 expert climate economists, the average long-term discount rate preferred was
2.25%. The typical central-case rate chosen by countries using an SCC is 3%. Importantly, following a
review of relevant scientific literature, the UN Intergovernmental Panel on Climate Change stated
that there is “no justification” for applying discount rates as high as 5% p.a. for climate change
analysis.
Limitations
As with any economic model, IAMs are subject to limitations, chiefly associated with underlying
assumptions around emissions pathways and the resulting climate and damages outcomes. Concerns
are largely based on the lag times between new understanding of climate science and updating of the
models themselves, which are not fully comprehensive in their coverage of all potential damages.
5While representing a potential underestimate, current SCCs provide the most comprehensive
measure of the cost of emitting carbon. Updates by the US IWG over the coming two years, which will
incorporate the next round of UN IPCC assessments as well as more detailed damage functions, will
help address some of these limitations.
Emerging Scientific evidence
It is clear that climate change and its impacts are accelerating and awareness in Australia and around
the world of the consequences is increasing. Average temperatures are now 1.1°C above
pre-industrial levels and have led to significant increases in the number of heatwaves and bushfires.
Forecasts for coming decades by the CSIRO and Bureau of Meteorology will see further increases in
these events in the ACT, causing large economic, social and environmental losses.
In particular, researchers are becoming increasingly aware of the health costs associated with these
events, with both heatwaves and bushfire smoke leading to substantial rises in ambulance call-outs,
emergency department admissions and deaths.
Over time, as evidence and understanding around climate impacts and their associated costs
increase, the SCC used by the ACT government will need to be reviewed and updated. The most
practical way to do this would be to adopt updates to SCC values based on revised estimates by the
US IWG which will in turn reflect new iterations of IAMS that draw on the most detailed information
from IPCC reporting. The next IPCC round of comprehensive assessments – AR6 – will be published in
2022.
Recommendation
The SCC as estimated by the US IWG in 2016, while likely underestimating the full cost of climate
change impacts, still appears to be the most comprehensive and reasonable measure of the costs of
climate inaction. Updates to the science which underpins the models, as well as the IAMs themselves,
will improve our understanding over time. But the limitations of these SCCs do not appear to be
sufficient to reject their use in ACT Government analysis.
It is therefore recommended that ACT Government adopt US EPA 2016 SCC estimates, updated into
current Australian dollar terms. Reflecting prevailing economic attitudes to the most appropriate
choice of for the social discount rate, a SCC value based on a 3% rate is recommended for central case
analysis, with sensitivity testing at 2.5%. Sensitivity testing at the high impact damages values may
also be warranted, given current SCC estimates are deemed to be conservative in this aspect.
Estimates for use by the ACT Government are presented below.
6Recommended estimates for an ACT Social Cost of CO2 (2020 A$ dollars per tonne CO2)
High Impact
Year 3% Average 2.5% Average
(95th pct at 3%)
2020 71 104 207
2025 77 114 232
2030 84 123 255
2035 92 131 282
2040 101 141 307
2045 107 149 331
2050 116 160 356
Source: Rovingstone estimates, based on US EPA and US Bureau of Labour Economics analysis and Reserve Bank of Australia for $A
(using five-year average to February 2021, AUD$0.73)
71 Background
The ACT Government has set an ambitious target of achieving net zero in greenhouse gas (GHG)
emissions by 2045, with interim targets including a 50–60% (below 1990 levels) reduction in
emissions by 2025. These targets will require significant investment in emissions reduction programs,
policies and investments.
To accurately measure the net costs and benefits of potential initiatives, and to prioritise actions, the
ACT Government needs to adopt an appropriate price of carbon for its Cost Benefit Analyses (CBAs)
or other approaches used to consider policy analysis, budget decisions, procurement or capital works
investment. It may also be appropriate to use a SCC in This paper explores carbon pricing options and
the benefits and challenges associated with adopting a Social Cost of Carbon for use in the economic
analysis.
1.1 Options for a Cost of Carbon
There is currently no consistent practice among Australian state and territory governments, or at the
Federal level, in determining an appropriate carbon price for use in economic analysis; in fact, most
jurisdictions provide no formal guidance at all. However, economists use two options for determining
a carbon price for use in economic analyses: a market price, or a social cost of carbon (SCC).
1.1.1 Market price
While Australia no longer has a carbon trading scheme, the World Bank notes that “Some 40
countries and more than 20 cities, states and provinces already use carbon pricing mechanisms.”1
NSW Treasury CBA Guidelines state that these “market prices should be used as a basis for valuing
the costs of carbon emissions, where reliable evidence can demonstrate that those market prices are
not significantly biased as a direct consequence of scheme design.” Where a market price cannot be
reliably determined, estimates of damages (the social cost) may be used.2
The question of reliability is an important one. In theory, the market price for carbon should reflect
the cost of containing emissions to a specified pathway. The United Nations Intergovernmental Panel
on Climate Change (IPCC) states that a carbon concentration no higher than 430 parts per million
(ppm) is consistent with 1.5°C warming3, which would require higher prices than are currently seen in
many markets.4
The most frequently cited carbon (permit) price, because of its size and longevity, is that associated
with the European Union (EU) Emissions Trading Scheme (ETS). A permit is known as an EU Allowance
(EUA). This is the benchmark recommended by the NSW Government for mining and coal seam gas
1
https://www.worldbank.org/en/programs/pricing-carbon accessed 16 February 2021
2
NSW Treasury (2017), NSW Government Guide to Cost benefit Analysis, TPP17-03; author’s emphasis
3
IPCC (2014), Summary for Policymakers in: Climate Change 2014: Mitigation of Climate Change. Contribution of Working
Group III to the Fifth Assessment Report of the Intergovernmental Panel on Climate Change
4
IPCC (2018), Global Warming of 1.5°C – Special Report chapter 2 at https://www.ipcc.ch/sr15/chapter/chapter-2/
8appraisals.5 However, a soft economy and significant oversupply of permits6 for much of its existence
has left the price of EUAs at or below €10/tonne CO2 ($A$15.57) for much of the decade to 2018.
Increasing demand for permits since then has seen prices rising, reaching a high of €38.95 (A$60.63)
in early February 2021. Further, the prices quoted are for short term (one or two year) contracts, and
so do not reflect the increasing cost of climate change over time on current emissions pathways.
In the eleven US states that make up the Regional Greenhouse Gas Initiative (RGGI) – a cap and trade
system – the price varies from US$5 to US$15.
According to IHS Markit’s Global Carbon Index, which is made up of prices from the California
Compliance Allowance (20.1%), RGGI (10.6%), and European Allowance (69.2%) prices, the weighted
global price on carbon was US$27.17 (A$35.06) as at 16 February 2021.7
Figure 1 Weighted Global Carbon Price
Source: HIS Markit
Relying on international market prices exposes the user to both uncertainty and volatility as a result
of design factors. More importantly, however, a market price is not considered the most appropriate
mechanism by many economists as it does not take into account the long-run economic, social and
environmental costs of climate change in the face of failure to mitigate.
1.1.2 Social Cost of carbon
The SCC, sometimes referred to as the ‘damage cost’ estimate, is the net present value (NPV) of net
climate change impacts as a result of one additional tonne of carbon (or carbon dioxide and
equivalents) emitted to the atmosphere today. It is considered perhaps “the single-most important
5
NSW Department of Planning and Environment, 2018, Technical Notes supporting the Guidelines for the Economic
Assessment of Mining and Coal Seam Gas Proposals
6
Bayer, P. and Aklin, M. (2020), The European Union Emissions Trading System reduced CO2 emissions despite low prices
PNAS April 21, 2020 117 (16) 8804-8812; first published April 6, 2020; https://doi.org/10.1073/pnas.1918128117
7
https://indices.ihsmarkit.com/Carbonindex accessed 17 February 2021
9economic concept in the economics of climate change.”8 In the US alone, regulations have been
adopted with more than US$1 trillion in benefits, based on economic analysis that uses a SCC.9
However, measuring the SCC is fraught with complexity and subject to much debate among
economists. Integrated Assessment Models (IAMs) incorporate scientific and economic models,
which reflect expectations around emissions pathways, climate-related damages, abatement costs,
and socio-demographic and economic parameters. IAMs allow us to understand the net total cost of
climate change along different pathways. The assumptions underpinning these models, however, are
subject to debate, reflecting both uncertainty in climate risk outcomes as well as debate over
economic theory and practice.
Indeed, in the US alone, three separate IAMs are used to model the SCC, which has been estimated
hundreds of times over the past three decades using a range of assumptions about core parameters
such as social discount rate, economic and population growth and climate impacts. Recent estimates
for the SCC range from approximately US$10 (A$12.90) per tCO2 to as much as US$1,000 (A$1,290)
per tCO2.10
In July 2018, the ACT Climate Change Council, in briefing prepared for the ACT Government, noted
that a “suitable” estimate for the SCC for use in ACT government assessments at that time was A$70
per tCO2, as per the 2016 IWG estimates.11 The Council’s recommendation was based on a US report
responding to President Trump’s decision to disband IWG recommendations 12; this decision has since
reversed by President Biden.
Despite the inherent uncertainty and debate surrounding the “true” value of a SCC, for a number of
advanced economies it is still the preferred measure of carbon price for cost benefit analysis because
it provides a best estimate of the total impact of unchecked climate change. Moreover, both the
science and the economics of climate change are advancing at a rapid pace, giving greater confidence
in model outputs.
This paper will examine key issues related to the SCC and recommend best practice values for a SCC
for use on ACT economic analysis. This paper will focus on the economic value and application of a
SCC; it is not within scope to address the climate modelling which underpin IAMs.
1.2 Structure of report
This report is structured as follows:
8
Nordhaus, W. (2017), PNAS February 14, 2017 114 (7) 1518-1523; at https://doi.org/10.1073/pnas.1609244114
accessed 15 February 2021
9
Ibid.
10
Ricke, K. et al. (2018), Country-level social cost of carbon. Nature Climate Change 8, 895–900.
https://doi.org/10.1038/s41558-018-0282-y
11
ACT Climate Change Council (2018) The Social Cost of Carbon and public investment to reduce
ACT greenhouse gas emissions, Briefing paper prepared for ACT Government
12
Resvesz, R. et al (2017), Best cost estimates of greenhouse gases at
https://policyintegrity.org/files/publications/Science_SCC_Letter.pdf accessed 7 March 2021
10• Section 2 addresses current theory and practice in an international context.
• Section 3 looks at global, country and regional level SCCs and what this means for a SCC for
the ACT.
• Section 4 discusses approaches to determining appropriate discount rates for estimating a
SCC.
• Section 5 examines the limitations in using a SCC.
• Section 6 explores emerging scientific evidence re the potential impact of heatwaves,
bushfires and other climate-related events on the ACT economy, and implications for a SCC
for the ACT.
• Section 7 draws conclusions from the research and makes recommendations for a SCC to be
adopted by the ACT Government, including forecasts to 2045 under different discount rate
assumptions.
112 A Social Cost of Carbon – theory and
practice
2.1 The US
The US Environmental Protection Agency (EPA) and other federal agencies adopted a SCC for cost
benefit analysis of federal climate-related policies in 2010.
Separate estimates have since been calculated and are used for other greenhouse gasses (GHGs) such
as methane (CH4) and nitrous oxide (N2O).
The SCC was calculated by a US Government Interagency Working Group (IWG) on the Social Cost of
Carbon13, drawing on three separate IAMs.
• DICE (Dynamic Integrated Climate-Economy model), developed by William Nordhaus, a
professor of economics at Yale University.
• FUND (Framework for Uncertainty, Negotiation and Distribution model), developed by
Richard Tol, a professor at the University of Sussex, and now co-developed by Tol and David
Anthoff, assistant professor at the University of California.
• PAGE (Policy Analysis of the Greenhouse Effect model) is developed by Chris Hope from the
University of Cambridge, UK.
All three models are built around four core pillars – socioeconomic factors, climate, damages and
discounting. However, there are some major differences in model variables and specific features
within each model, 14 producing quite different SCC estimates. A stylized illustration of the
relationship between key inputs to IAM is presented in Figure 2 below.
The IWG averages outcomes across the models each with some 50,000 estimates15 across
socio-economic and emissions scenarios16 to produce estimates.
Since its introduction, the SCC has been updated three times (2013, 2015 and 2016) to reflect
increased knowledge, particularly relating to climate pathways and damages estimates.
13
Subsequently change to the IWG on the Social Cost of Greenhouse Gases
14
Rose, S., Diaz, D. and Blanford, G. (2017), understanding the social cost of carbon: a model diagnostic and inter-
comparison study, Energy and Environmental Analysis Research Group, Electric Power Research Institute
15
Ibid.
16
Interagency Working Group on Social Cost of Carbon, United States Government (2010), Technical Support Document –
Social Cost of Carbon for Regulatory Impact Analysis.
12Figure 2 Climate and economic relationships in IAMs
Source: Rovingstone Advisory, based on https://deconstructingrisk.com/tag/integrated-assessment-models/
One particular aspect of divergence in the modelling relates to the discount rate used. Issues related
to the choice of discount rate are discussed in more detail in Chapter 4 but the SCC is particularly
sensitive to the rate chosen. For this reason, the IWG presents four estimates for the SCC. The first
three represent average model outcomes at discount rates of 2.5%, 3.0% and 5%, while the fourth
represents catastrophic outcomes (at the 95th percentile) at a 3.0% discount rate. The most recent
values (2016) are shown in Table 1 below.
13Table 1 US Social Cost of CO2 (2018 US$ dollars per tonne CO2)
High Impact
Year 5% Average 3% Average 2.5% Average
(95th pct at 3%)
2020 14 50 74 147
2025 17 55 81 165
2030 19 60 87 181
2035 21 66 93 200
2040 25 72 100 218
2045 27 76 106 235
2050 31 82 113 253
Source: Rovingstone calculation of 2018 prices based on US EPA and US Bureau of economic analysis
In 2017, the Trump administration disbanded the IWG by executive order and, shortly thereafter, the
EPA cut the SCC to between US$1 and US$6 per tonne of CO 2. This revised value reflected modelling
based on only domestic emissions and a 7% discount rate and are about seven time lower than
previous estimates.17
In the same year, US National Academies of Sciences, Engineering, and Medicine proposed building a
single new climate-economy model to replace DICE, PAGE and FUND. The US Government
Accountability Office (GAO) reviewed this recommendation and concluded that this recommendation
be addressed as it could “strengthen analysis”18, but no action was taken.
The first comprehensive independent review of the models was undertaken in 2017 and reported the
need for greater transparency and technical understanding of the models, given their importance in
policy making.19 President Biden signed an executive order in January 2021 to begin a process to
revise the SCC. It will shortly publish an interim value of the SCC for immediate use and will reform
the IWC.
17
US Government Accountability Office (2020), Social Cost of Carbon Identifying a Federal Entity to address the National
Academies’ recommendations could strengthen regulatory analysis, GAO-20-254
18
Ibid
19
Rose, S., Diaz, D. and Blanford, G. (2017), understanding the social cost of carbon: a model diagnostic and inter-
comparison study, Energy and Environmental Analysis Research Group, Electric Power Research Institute
14California, Minnesota, Nevada and New York states continue to develop and use prior estimates of
the SCC, based on a 3% discount rate. Estimates for 2020 are centred around US$50/t CO 2 (2018
dollars).20
2.2 Canada
Environment and Climate Change Canada conducted a review of approaches to valuing emissions in
cost benefit analysis in 2010 and 2011. The Canadian Government requires all departments and
agencies to conduct cost benefit analysis of high-impact regulatory analysis.21 Examples of use
include policies related to heavy vehicle usage and methane regulations for the oil and gas industry. A
number of Canadian provinces (e.g., Quebec and Ontario) also use an SCC in cost-benefit analysis.
Between 2021 and 2040, regulations currently proposed by the Canadian Government are estimated
to reduce CO2 emissions by 221Mt, valued at C$20.6bn.22
The Canadian review recommended adopting a SCC based on the US IWG analysis, but using only two
estimates: the 3% discount rate prior estimates as well as the high-impact (95th percentile) for
sensitivity analysis.23 Values were updated in 2016, reflecting changes to US model outputs and EPA
estimates; these are shown in Table 2 below. Canadian values are lower than the US at the 3% central
estimate, but higher for the high impact (95th percentile) estimate.
Table 2 Canada Social Cost of CO2 (2018 US$ per tonne CO2)
Year At 95th percentile, 3% discount
At 3% discount rate
rate
2020 38 159
2030 45 197
2050 62 267
Source: US GAO analysis of data from Environment and Climate Change Canada
2.3 United Kingdom
All centrally-funded public spending proposals in the UK, regardless of whether they are approved at
Departmental level or by Treasury or Cabinet, are required to be supported by a business cases
20
ibid
21
Environment and Climate Change Canada (2017), Canada’s Approach on the Social Cost of Greenhouse Gases, National
Academy of Sciences Symposium, June 2017
22
Government of Canada (2020) Canada Gazette, Part 1, Volume 154, Number 51: Clean Fuel regulations at
https://canadagazette.gc.ca/rp-pr/p1/2020/2020-12-19/html/reg2-eng.html accessed 8 March 2021
23
Environment and Climate Change Canada (2016), Technical Update to Environment and Climate Change Canada’s Social
Cost of Greenhouse Gas estimates.
15following stringent guidelines.24 Guidance on the use of a carbon price is provided in a range of
documents including supplementary guidance to the UK’s Green Book on Appraisal and Evaluation in
Central Government.25
The UK first recommended the use of the SCC for informing national policies on GHG emissions in
2002 and commissioned a series of reports to examine the issue. The most widely known of these
reports is the Stern Review. The SCC values estimated by Stern differ from the values used by the U.S.
government in a number of ways. For example, Stern used a lower discount rate and included equity
weighting of countries, reflecting the disproportionate impacts of climate change on low-GDP
economies. Based on the Stern Review, the UK government set a value for the SCC in 2007 of US$50
per tonne of CO2 (2007 dollars), increasing at 2 % per annum. This was to be used to determine the
most appropriate limit on emissions.
However, in 2009, the UK moved away from using an SCC approach, citing uncertainty surrounding
SCC estimates as well as assumptions about emissions pathways based on what other countries might
decide.
The UK government, along with France, now uses a “shadow price” of carbon for policy evaluation.
This monetary value for carbon is based on economic model estimates of the cost of reducing
emissions to target objective levels. Where the SCC reflects the costs of damages for a given
emissions pathway, the shadow price reflects the cost to achieve an emissions target (typically
consistent with the Paris Agreement). The UK applies separate shadow prices for its emissions-traded
and non-traded sectors although these converge over time.
Table 3 UK and France Social Cost of CO2 (2018 US$ per tonne CO2)
Year UK UK France
(emissions-trading sectors) (non-traded sectors)
2020 19 93 103
2030 108 108 295
2050 309 309 916
Source: US GAO analysis of data from the United Kingdom’s Department for Business, Energy & Industrial Strategy and
France Stratégie
Shadow pricing is also used by a number of institutions including the World Bank, the International
Finance Corporation (IFC) and the European Bank for Reconstruction and Development (EBRD). EBRD
pricing is based on the modeling of High-Level Commission on Carbon Prices, established in 2016,
which recommends that carbon should be priced at US$40-80 in 2020, rising over time and reaching
US$50-100 by 2030.26
24
UK Treasury (2018), Guide to developing the project business case
25
UK Treasury (2019) Valuation of energy use and greenhouse gas
26
EBRD.com/news/2019/what-is-shadow-carbon-pricing.html accessed 19 February 2021
162.4 Germany
The German Environment Agency has developed and continues to use its own estimates of an SCC in
cost benefit analysis, across a wide range of projects, placing a priority on measuring social impacts.
German estimates are based on the FUND model, but using discount rates that change over time to
reflect the intergenerational impact of emissions.27 Central estimates of the discount rate start at
close to 3%, declining to 2% by 2250. Sensitivity is conducted with 2% and 1% rates respectively. As
with the Stern estimates, German SCC estimates include regional equity weightings. This produces
significantly higher values than for the US or Canada.
Current estimates are presented in Table 4 below. The Environment Agency is currently reviewing the
FUND model and its outputs.
Table 4 Germany Social Cost of CO2 (2018 US$ per tonne CO2)
Year At 95th percentile, 3% discount
At 3% discount rate
rate
2020 218 776
2030 248 812
2050 291 885
Source: US GAO analysis of data from German Federal Environment Agency
2.5 Conclusions
There are a number of differing approaches adopted across different countries for a SCC, which can
be seen to deliver a very wide range of potential values. However, all are based around the same
IAMs but differ principally around core assumptions, especially the discount rate applied. The shadow
pricing approach adopted in the UK and elsewhere brings with it similar challenges around robustness
of assumptions. SCC estimate ranges are shown in Table 5 below. Canadian estimates are currently
the lower end of the spectrum, and are under review due to criticisms that they are too low. German
values represent the high-end of the range, with the exception of 2050, which is the UK (traded-
sector) value.
27
US Government Accountability Office (2020), Social Cost of Carbon Identifying a Federal Entity to address the National
Academies’ recommendations could strengthen regulatory analysis, GAO-20-254
17Table 5 Range of country estimates for Social Cost of CO2 (2018 US$ per tonne CO2)a
Year Low High
2020 38 776
2030 45 812
2050 62 885
a Based on 3% discount rate values or lower (see Section 4 for more explanation)
There is also some concern that these models have yet to be updated with the latest scientific
assessments, given the disbanding of the IWG in 2017. This will be remedied by the Biden
administration and new values will be available in due course.
In general, there is significant support for adopting US EPA-recommended values (prior to 2017) as
interim values for cost benefit analysis in policy making, until such time as models can be updated.
The average of three separate IAMs and sensitivity around discount rates allows for useful
comparisons of how well projects and policies measure on a cost-benefit basis.
183 A Social Cost of Carbon for the ACT
In deliberating on an appropriate SCC for the ACT, there are two key considerations. Firstly, should a
localised (regional) SCC apply? And, secondly, which model values are most appropriate?
3.1 Global or regional?
One consideration that has been made, most notably by former President Trump in the US (see
Section 2.1 above), is that a global SCC (GSCC), does not isolate the impacts felt by any one country
and that costs or benefits felt in other jurisdictions should not be considered in domestic policy
analysis.
There are numerous circumstances in which a regional SCC (RSCC) might be useful rather than a
global SCC (GSCC). For example, the governance of climate issues and impacts of non-cooperative
behaviour among some countries are significant issues for understanding future global emissions
pathways. Country level estimates can also support more focussed understanding of local impacts
and required measures for adaptation or compensation.28
However, GHG emissions produced by any one country affect the global environment, society and
economy. For example, it is estimated that for every tonne of CO 2 emitted in the US, 85% of the
damages occur externally.29 Using a country (or even sub-regional) based SCC would ignore total
damages and could limit the potential for coordinated global action. For this reason, Canadian and
German analysis of this issue supports using a GSCC.30 In a 2016 US Court of Appeals case against a US
Department of Energy decision related to commercial refrigeration equipment, the Court ruled that
“global effects are an appropriate consideration when looking at a national policy.” 31
3.2 Forecast values for the ACT
As described in Chapter 2, there are a number of global SCC values which the ACT Government could
adopt for a SCC. While the range of values adopted by different countries is quite wide, there is
nevertheless a consistency of approach in modelling the SCC, based on the most sophisticated
modelling available by the US IWG.
28
Ricke, K. et al. (2018) Country-level social cost of carbon. Nature Climate Change 8, 895–900 at
https://doi.org/10.1038/s41558-018-0282-y
29
. Wagner, G et al (2021), Eight priorities for calculating the social cost of carbon at
https://www.nature.com/articles/d41586-021-00441-0 accessed 16 February 2021
30
US Government Accountability Office (2020), Social Cost of Carbon Identifying a Federal Entity to address the National
Academies’ recommendations could strengthen regulatory analysis, GAO-20-254
31
US Court of Appeals for the Seventh Court (2016), On Petitions for Review of Final Regulations of the United States
Department of Energy at http://media.ca7.uscourts.gov/cgi-bin/rssExec.pl?Submit=Display&Path=Y2016/D08-08/C:14-
2159:J:Ripple:aut:T:fnOp:N:1807496:S:0 accessed 22 February 2021
19For the ACT Government to develop its own modelling would involve substantial time and financial
and human resources and it is unclear that this would produce more robust results.
The advantage in using the 2016 EPA SCC values is that they average the three IAMs on which many
others also draw, allowing a moderation of the assumptions that drive each model. The EPA also
allows users to determine which discount rate they deem most appropriate as a central case
estimate, with sensitivity analysis if required. Sensitivity testing – testing the values of modelling
outputs by varying the value of key inputs – allows policy makers to address uncertainties that may
exist. This is particularly relevant for the impacts of climate change where there are significant levels
of uncertainty, albeit typically biased at present to under-represent damages associated with climate
change.
While 2016 estimates are not as up-to-date or comprehensive as they could be, no other country yet
provides widely-accepted updated alternatives. A review encompassing updated scientific knowledge
and economic dependencies will now take place under the Biden Administration and SCC forecasts
can be updated when these become available.
204 Discount rates for a Social Cost of
Carbon
A discount rate is used in cost benefit analysis to adjust future dollar values into current dollar terms,
recognizing that individuals tend to place a higher value on a monetary unit today than in the future.
Because IAMs estimate the impacts of climate change over almost three centuries to 2300, the
impact of discounting on SCC values chosen will be profound.
Further, estimates for the SCC increase over time because future emissions are expected to produce
larger incremental damages, as physical and economic systems become more stressed in response to
greater climatic change, and because GDP and populations – and therefore the potential for damages
– are increasing over time.
Discounting assumptions are therefore one of the biggest determinants of differences between
estimations of the SCC are subject to the greatest amount of debate. The effect is also demonstrated
in Figure 3 below.
Figure 3 US SCC forecasts – impact of discount rate choice
100
80
60
40
20
0
2020 2025 2030 2035 2040 2045 2050
5% Average 3% Average 2.5% Average
Source: Carbon Brief
There are two key methods for calculating a discount rate for a SCC.
• Social Rate of Time Preference (SRTP) – this represents a measure of an individual’s
willingness to postpone private consumption now in order to consume later. An indicator of
SRTP is the earnings rate on their savings (i.e., the rate at which individuals will choose to save
rather than to consume. SRTP is typically between 0% and 4%.
• Social Opportunity Cost of Capital (SOC) – this reflects the marginal earnings rate for private
business (market) investments. It is significantly higher than SRTP.
The majority of economists agree that a SRTP is most appropriate for calculating the SCC, but do not
agree on the rate itself (as demonstrated by actual rates adopted by different countries, discussed in
Chapter 2). While some argue for prevailing interest rates (currently at historic lows around the
globe) as the most relevant proxy, others state that such rates fail to accurately account for societal
21views about how we view the “value” of future generations themselves and therefore are potentially
too high.32 Nicholas Stern – who favours a discount rate close to zero – states that current interest
rates are not valid because these rates do not tell us “how do we, acting together, evaluate our
responsibilities to future generations.”33 Future generations cannot retrospectively alter current
practices.
Nobel Laureate William Nordhaus specifies a SRTP discount rate of 3%, based on actual capital
market returns.34 Nordhaus has famously made the argument that future generations will be
better-off economically and technologically than past generations and therefore better equipped to
deal with climate change impacts. This is a highly disputed concept.
In a survey of 197 expert climate economists, the average long-term discount rate preferred was
2.25%. The survey found that the vast majority of survey participants accepted a rate of between 1
and 3%, with only a few favouring higher rates.35 Early US Government guidance suggested a lower
rate is appropriate for estimating multi-generational values, given the “special ethical values”
attached.36 Indeed, the same survey showed 46% of respondents recommended using a declining
discount rate for intergenerational effects, but most SCCs use a constant rate.
After a review of relevant scientific literature, the IPCC stated that there is no justification for
applying discount rates as high as 5% p.a. for climate change analysis. 37
There is scope to undertake more study in this area, although the ultimate choice of discount rate
comes down to moral, rather than economic, considerations. This is one reason why several
estimates are produced by the EPA.
Given the weight of economic sentiment across many governments and academics favours a lower
discount rate, a 3% central case scenario appears reasonable, but sensitivity should be undertaken
with lower rates such as the 2.5% presented in EPA estimates. Upper estimates for damages (95 th
percentile) may also be considered appropriate.
Although Australian governments’ practice is typically to use a central case discount rate of 7% in
policy and investment appraisals (noting Victoria uses a lower rate for investments in social
infrastructure, such as schools and hospitals), for the reasons cited above, this is not considered
appropriate for calculating the SCC.
32
Kelleher, J.P. (2012), Energy Policy and the Social Discount Rate, Ethics, Policy and Environment 15(1)
33
Stern. N. (2010), The Economics of Climate Change, in: Gardiner, S., Caney, S., Jamieson, D., Shue, H., & Pachauri, R. K.
(eds.), Climate Ethics: Essential Readings, (Oxford: Oxford University Press)
34
William D. Nordhaus PNAS February 14, 2017 114 (7) 1518-1523; first published January 31, 2017;
https://doi.org/10.1073/pnas.1609244114 accessed 21 February 2021
35
Howard, P. and Sylvan, D (2015), Expert Consensus on the economics of climate change, Institute for Policy Integrity,
New York University School of Law
36
US e Office of Management and Budget (2003), Regulatory Analysis, Circular A-4 at
https://www.transportation.gov/sites/dot.gov/files/docs/OMB%20Circular%20No.%20A-4.pdf accessed 20 February
2021.
37
Kolstad, C. et al (2014), Social, economic and ethical concepts and methods. IPCC 5th Assessment report, Working
Group III, Chapter 3
22Impact of discount rate choice and SCC values on economic analysis: an example
It is common practice for Australian federal, state, territory and local governments to undertake
sensitivity analysis as part of cost benefit and other economic analyses. This practice is recommended
in the ACT’s Best Practice Guidelines for Preparing Regulatory Impact Statements. When there is
uncertainty around a particular assumption, this is important to understand how well the chosen
policy or investment option holds up to variations in assumptions; in other words, how robust is the
assessment of value?
As a hypothetical example, the ACT Government may wish to assess the merits of a program
encouraging home-owners to invest in energy efficiency actions. The estimated cost of the program is
$1,000 per household, and this is expected to reduce household emissions by 20% or approximately
1t CO2 per annum. The NPV of benefits of reduced emissions over a twenty-year period, from 2021 to
2041, would be $1,293 using the 3% central case SCC or a benefit cost ratio of 1:1.3. The value of
avoided emissions increases using a 2.5% SCC ($1,853) and the High Impact SCC estimate ($3,896),
but falls to just $413 (BCR 1: 0.5) at a 5% SCC.
However, as noted in this chapter, a 5% discount rate is generally considered too high and the
investment would therefore be rational for all other values of the SCC.
235 A Social Cost of Carbon – limitations
While numerous countries, states and cities have adopted a SCC and the concept itself is robust,
current models and the estimates produced are not without their limitations. As the US Interagency
Working Group noted at the time of publishing the first estimates:
The [SCC] estimates are presented with an acknowledgement of the many
uncertainties involved and with a clear understanding that they should be
updated over time to reflect increasing knowledge of the science and
economics of climate impacts.38
While this is not a technical report into IAM model specification, in considering the validity of the IWG
SCC estimates based on the three main IAMs it is worth considering some uncertainties in model
parameters that have raised concerns. These uncertainties, which can significantly affect SCC values,
fall into three key areas:
• the discount rate
• economic and population growth
• emissions, climate pathways and damages.
Issues associated with the discount rate were discussed in the previous chapter.
5.1 Economic and population growth
Forecasts for economic and population growth in IAMs are subject to the same uncertainty that is
inherent in any economic model. However, because of the length of the model forecast period and its
correlation with assumptions on how countries respond to climate change (mitigating and adapting)
there is an additional layer of uncertainty. There has been criticism, for example, that two of the five
core scenarios may embed inconsistencies between GDP and emissions pathways. 39 One of these is a
high-growth, low-emissions pathway; however, given certain technological advances, this scenario is
plausible.
These concerns, while valid, are not considered sufficient to warrant discarding the models.
5.2 Emissions, climate pathways and damages
The greater uncertainties inherent in SCC forecasts lie in the underlying emissions forecasts, their
impacts on climate and the resulting environmental, economic and social damages. Climate science is
evolving quickly and there is broad recognition that the impacts of global warming are much more
widespread and also closer than thought even just a few years ago; nevertheless, there remains
38
Interagency Working Group on Social Cost of Carbon, United States Government, 2010, Technical Support Document:
Social Cost of Carbon for Regulatory Impact Analysis Under Executive Order 12866
39
Nordhaus, W. (2017), Integrated Assessment Models of Climate Change, National Bureau of Economic Research, Issue
no. 3 September 2017
24significant uncertainty about future climate pathways, including around if, and how, countries’
emissions targets might be met.
Since 1988, the most comprehensive reviews of climate science and vulnerabilities have been
undertaken by the IPCC through its working groups. The Sixth IPCC assessment (AR6) is currently
underway, with findings to be reported in 2022. Numerous interim special reports have been
released since 2015, most notably ‘Global Warming of 1.5°C’ in 2018, which are yet to be
incorporated in SCC models.
Indeed, the IAMs used by the US government (and others) to calculate the SCC aren’t generally
considered fully up to date in terms of the latest science relating to sea level rise, heat extremes,
tropical cyclones, agriculture and labour productivity.40
The findings of the last IPCC comprehensive assessment – the Fifth (AR5) – were released in 2015 and
are not incorporated into the last round of IWG estimates. The IPCC AR5 observed that the omission
of various potential physical and social damages from IAMs meant that damages were too low, and
current SCC values represent an underestimate. 41 Both the DICE and FUND models have had new
iterations since the last major IWG computation,42 but even their inputs are not current with latest
research.
There are other concerns around the model design for the three IAMs used to calculate the US SCC,43
particularly as these models are highly complex and lacking in transparency. However, a technical
assessment of the models is outside the scope of this report. A review of the three IWG IAM models
undertaken in 2017 suggests that improvements can be made, but does not suggest the IAMs should
be abandoned.44
5.3 Considerations
With any economic model there is an element of uncertainty. The extreme complexity of the IAMs
exacerbates this uncertainty. However, the model and the IWG process for calculating the SCC using
model outputs have been extensively reviewed and are accepted by the broad scientific and
economic community. Despite room for improvement, the IWG SCC, and the IAMs on which it is
modelled, are accepted by numerous countries and international organisations.
The current limitations of models and estimates are highly likely to be biased to the downside.
However, until models can be updated, current SCC values represent a more accurate reflection of
40
https://www.carbonbrief.org/qa-social-cost-carbon citing, Moore, F. et al (2016), Welfare Changes from Climate
Change Impacts on the Agricultural Sector: New Damage Functions from Over 1000 Yield Studies, 19th Annual Conference
on Global Economic Analysis Conference paper
41Kolstad, C. et al (2014), Social, economic and ethical concepts and methods. IPCC 5th Assessment report, Working
Group III, Chapter 3
42
Rose, S., Diaz, D. and Blanford, G. (2017), understanding the social cost of carbon: a model diagnostic and inter-
comparison study, Energy and Environmental Analysis Research Group, Electric Power Research Institute
43
Ibid
44
Ibid
25the potential costs associated with climate inaction and benefits of policy action than existing market
prices.
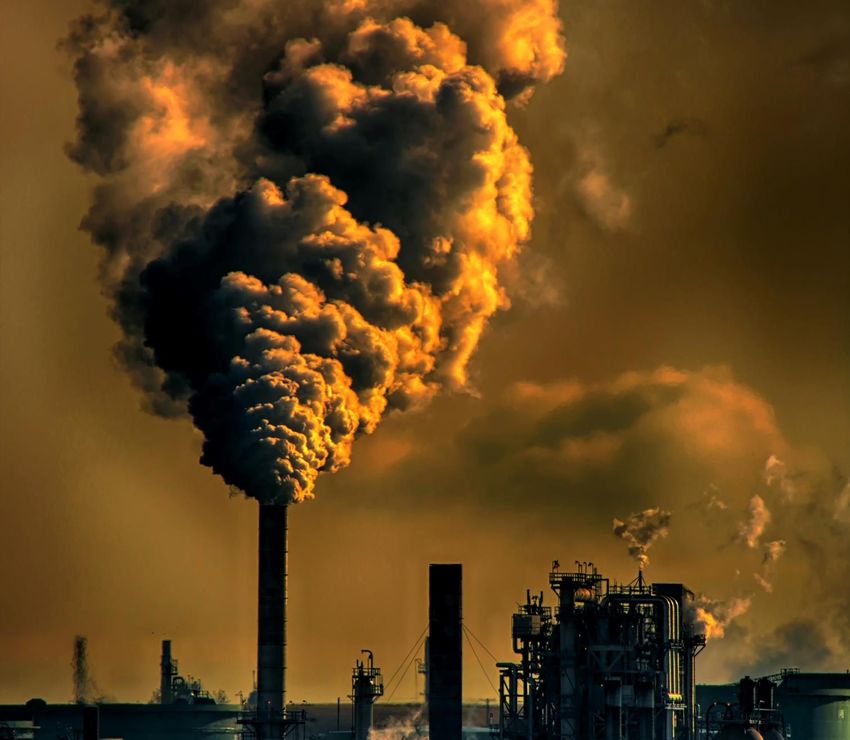
266 Emerging Scientific evidence
In the ACT, key climate risks are associated with rising average temperatures and increased risk of
bushfires. Economic evidence regarding the potential nature and scale of impact of these threats,
particularly on human health, is increasing, especially in the wake of the 2019-20 Summer of
Bushfires.
As discussed in Chapter 3, this paper supports use of a global rather than regional SCC. Nevertheless,
understanding the potential level of impact specific to the ACT helps to understand the quantum of
specific regional risks and costs associated with climate impacts, as well as the nature of possible
adaptation measures.
6.1 Heat waves
The Bureau of Meteorology (BoM) defines a heatwave as three or more consecutive days when day-
and night-time temperatures are “unusually hot” relative to past weather in a region. This persistent
heat creates the conditions for heat stress that can affect human health, the economy, agriculture
and ecosystems45 as well as the effective operation of infrastructure (energy, water, transport and
communications).46
While there is no single temperature threshold for a heatwave in Australia, temperatures at or above
35°C are generally considered the benchmark. The BoM classifies heatwaves into three categories:
low-intensity, severe and extreme. Severe heatwaves are likely to affect vulnerable groups such as
the elderly and those with existing medical conditions while extreme heatwaves present a problem
for all people, especially those who work outside. Since 1890, heatwaves have killed more Australians
than bushfires, cyclones, earthquakes, floods, and severe storms combined.47
Extremes of heat also affect agricultural production, both directly and through water shortages, as
well as wildlife populations and ecosystems.
Australia’s climate has warmed on average by 1.44 ± 0.24 °C since national records began in 1910,
which has led to an increase in the frequency of extreme heat events as shown in Figure 4 below48
and heatwaves in Australia over the last two decades have increased in frequency, intensity and
duration.49
45
Trancoso, R. et al (2020), Heatwaves intensification in Australia: A consistent trajectory across past, present and future,
Science of the Total Environment, Volume 742 November 2020 at
https://www.sciencedirect.com/science/article/pii/S0048969720340432 accessed 23 February 2021
46
http://www.bom.gov.au/australia/heatwave/knowledge-centre/understanding.shtml
47
Coates et al. (2014), Exploring 167 years of vulnerability: An examination of extreme heat events in Australia 1844–2010
at www.sciencedirect.com/science/article/pii/S1462901114000999
48
CSIRO and Australian Bureau of Meteorology (2020), State of the Climate 2020
49
Trancoso, R. et al (2020), Heatwaves intensification in Australia: A consistent trajectory across past, present and future,
Science of the Total Environment, Volume 742 November 2020 at
https://www.sciencedirect.com/science/article/pii/S0048969720340432 accessed 23 February 2021
27Figure 4 Frequency of extreme heat events in Australia
6.1.1 Scientific evidence on outlook for heatwaves
Extreme heat events are projected to continue to increase across Australia if GHG emissions continue
along a business-as-usual trajectory. Even if the Paris Agreement to limit global temperature rise to
below 2°C is met, summer heatwaves in Australian eastern capital cities are likely to reach highs of
50°C by 2040.50
Modelling by the BoM and CSIRO,51 based on IPCC pathway RCP 8.5, projects the average number of
summer days above 35°C in the ACT will rise from the current average of 6.2 days, to 13.9 days by
2050 and 23.2 days by 2090. However, these are average estimates: already over the 2018-19
summer, there were 24 days above 35°C, five times the summer average.52 2019-20 was the next
hottest year on record after 2018-19. Australia had its hottest day on record on 18 December 2019 at
41.88°C with six other days that month exceeding previous records. On 4 January 2020, Canberra
reached 44.0 °C, 1.2 °C above the previous record for any ACT site.53
Note that the impacts of extreme heat days discussed here are separate to the impact of prolonged
drought.
Research by the University of Queensland predicts heatwaves across Australia may be 85% more
frequent if global warming increases from 1.5°C to 2.0°C, and could last up to a month under
50
Lewis S, King AD and Mitchell DM (2017) Australia’s Unprecedented Future Temperature Extremes Under Paris Limits to
Warming. October 2017. Geophysical Research Letters, 44(19). DOI: 10.1002/2017gl074612.
51
CSIRO and Australian Bureau of Meteorology (2020), State of the Climate 2020
52
Climate Council (2020), Hottest of the Hot: Extreme heat in Australia at
https://www.climatecouncil.org.au/resources/hottest-of-the-hot-extreme-heat-in-
australia/?atb=DSA01b&gclid=EAIaIQobChMIoMq57O_t7gIVU7eWCh2PsACJEAAYASAAEgI8yvD_BwE
53
Australian Bureau of Meteorology (2020), Special Climate Statement 73—extreme heat and fire
weather in December 2019 and January 2020 at http://www.bom.gov.au/climate/current/statements/scs73.pdf
28You can also read