A Summary of the Risk Assessment of Threats to New Zealand Sea lions - ISSN No: 2253-394X (online)
←
→
Page content transcription
If your browser does not render page correctly, please read the page content below
A Summary of the Risk
Assessment of Threats to
New Zealand Sea lions
MPI Information Paper No: 2016/03

Prepared for MPI and DOC
By Igor Debski and Nathan Walker

ISBN No: 978-1-77665-201-3 (online)
ISSN No: 2253-394X (online)

March 2016
Disclaimer
While every effort has been made to ensure the information in this publication is accurate, the
Ministry for Primary Industries does not accept any responsibility or liability for error of fact,
omission, interpretation or opinion that may be present, nor for the consequences of any decisions
based on this information.

Requests for further copies should be directed to:

Publications Logistics Officer
Ministry for Primary Industries
PO Box 2526
WELLINGTON 6140

Email: brand@mpi.govt.nz
Telephone: 0800 00 83 33
Facsimile: 04-894 0300

This publication is also available on the Ministry for Primary Industries website at
http://www.mpi.govt.nz/news-and-resources/publications/

© Crown Copyright 2016 - Ministry for Primary Industries
Contents
1.      Summary ................................................................................................................................... 3
2.      Introduction .............................................................................................................................. 4
3.      Risk assessment approach ......................................................................................................... 5
     3.1       Sites ................................................................................................................................... 5
     3.2       Data .................................................................................................................................. 6
     3.3       Demographic analysis of available data ................................................................. 7
     3.4       Threat identification ................................................................................................... 7
     3.5       Threat characterisation .............................................................................................. 8
4.      Results Auckland Islands and Otago ........................................................................................... 9
     4.1       Risk triage ...................................................................................................................... 9
        4.1.1         Auckland Islands ......................................................................................................... 9
        4.1.2         Otago Peninsula ....................................................................................................... 11
     4.2       Demographic scenario projections ........................................................................ 12
     4.3       Population projections assessing the effects of threats................................... 14
        4.3.1         Auckland Islands ....................................................................................................... 14
        4.3.2         Otago Peninsula ....................................................................................................... 18
     4.4       Retrospective analysis of Auckland Island decline ........................................... 19
5.      Results Campbell and Stewart Islands ...................................................................................... 22
     5.1       Campbell Island .......................................................................................................... 22
     5.2       Stewart Island ............................................................................................................. 22
6.      Discussion................................................................................................................................ 22
7.      Acknowledgements ................................................................................................................. 24
8.      References............................................................................................................................... 24
9.      Appendices .............................................................................................................................. 25
     Appendix 1. Threat scenarios ....................................................................................................... 25
     Appendix 2. New Zealand sea lion pup mortality workshop: notes ............................................... 25
     Appendix 3. Development of the Threat Management Plan for New Zealand sea lions: NZSL Threat
     workshop 1.................................................................................................................................. 25
     Appendix 4. Development of the Threat Management Plan for New Zealand Sea Lions: NZSL Threat
     Workshop 2 ................................................................................................................................. 25

A Summary of the Risk Assessment of Threats to New Zealand Sea lions                                                                                 •1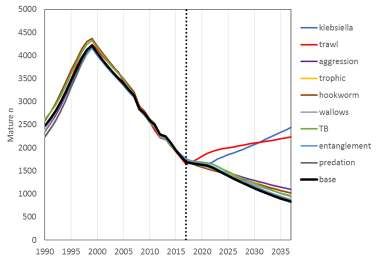
A Summary of the Risk Assessment of Threats to New Zealand Sea lions •2
1. Summary
This report describes the work undertaken, as part of the development process of a draft Threat
Management Plan (TMP), to assess risks to New Zealand sea lions, a nationally critical and endemic
species to New Zealand. The TMP assesses all threats on the population, prioritises threats for
management and mitigation, and covers all sub-populations and breeding sites.

Risk assessments provide a systematic framework for evaluating the potential implications of different
management decisions. The risk assessment process used for the development of the TMP aimed to
quantify which threats pose most risk to the population, and inform the prioritisation of management
actions that would meet the management goals of the TMP. The approach involved the development
of demographic models, compilation of data on threats, a risk triage process and detailed modelling
of key threats where sufficient data was available. A panel of national and international experts was
convened to guide and review the process and provide opinion-based input where data availability
was poor.

The quantitative components of the risk assessment focussed on the Auckland Islands sub-population,
where the greatest declines have been observed, and the Otago coast breeding area. These were the
two areas with most data available.

For the Auckland Islands, the greatest risks identified from the triage were; Klebsiella disease,
commercial trawl fishing, male aggression, trophic effects/prey availability, hookworm disease and
wallows. For the Otago coast, the greatest risks identified from the triage were; setnet fishing,
deliberate human mortality, entanglement and male sea lion aggression

Results from the risk assessment at the Auckland Islands indicated alleviation of any one threat will
not result in an increasing population. Similarly none of the major threats assessed were sufficient
alone to explain the observed decline in pup production at the Auckland Islands. Clearly multiple
factors were acting on the population, and for management to recover the species a holistic view must
be adopted. Further studies will be needed to fully understand, and development management
options for some of the key threats, such as trophic effects and Klebsiella disease.

The Otago breeding area contains small numbers of breeding females, making it susceptible to small
levels of risks. The risk assessment has identified leading risks, such as deliberate human impacts,
which must be managed to maximise future population growth to encourage the establishment of a
new sub-population.

A more qualitative process of data collation and expert review identified key threats for the Campbell
Island sup-population and Stewart Island breeding area, where insufficient data was available to build
adequate population models.

The risk assessment approach developed for New Zealand sea lions will allow for a quantitative
assessment of progress towards achieving stated management goals, and some components could
readily be applied in other situations.

A Summary of the Risk Assessment of Threats to New Zealand Sea lions                               •3
2. Introduction
The New Zealand sea lion (Phocarctos hookeri, Gray, 1844) is New Zealand’s only endemic otariid (the
family of eared seals, such as fur seals and sea lions) and is listed as Nationally Critical under the New
Zealand Threat Classification System (Baker et al 2010). In response to a series of declining pup counts
at the Auckland Islands, the most important breeding area, the Department of Conservation (DOC)
and the Ministry for Primary Industries (MPI) have developed a draft Threat Management Plan (TMP)
for the species. The TMP assesses all threats on the population, prioritises threats for management
and mitigation, and covers all sub-populations and breeding sites.

This report describes the work undertaken, as part of the TMP development process, to assess risks
to New Zealand sea lions. The report has been produced to complement the TMP consultation paper,
part of the public consultation process on the TMP, by providing more detailed information on risks
and how they have been prioritised. The consultation paper has appendices providing a wider
overview of New Zealand sea lion biology, its status, threats and previous management actions.

Ecological Risk Assessments (ERAs) provide a systematic framework for evaluating the potential
implications of different management decisions when information is sparse, incomplete or uncertain
(Burgman et al. 1993). Broadly speaking, the challenge of any risk assessment is to assemble whatever
relevant knowledge is available—whether quantitative or qualitative, objective or subjective—and
devise a means to utilise that knowledge in the most rigorous and objective way possible to estimate
the likely consequences of actual or potential actions. It should also maintain transparency about the
requisite assumptions and inputs, and associated uncertainty.

Discussion of the risk assessment process is often fraught with confusion arising from vague and
inconsistent use of language, and the term ‘risk assessment’ is commonly applied to a wide range of
loosely related analytic approaches. The scoring framework of Hobday et al (2007) describes
qualitative, semi-quantitative, quantitative or ‘model-based’ approaches. The choice of approach and
methodology is often driven by the nature and availability of data on both the population and the
threats.

The risk assessment process used for the development of the TMP aimed to quantify which threats
pose most risk to the population, and inform the prioritisation of management actions that would
meet the management goals of the TMP. Threats are defined as any extrinsic factor or activity that
may negatively affect the New Zealand sea lion population, either by killing individual animals, i.e.
direct threats, or by changing their population characteristics (e.g. resulting in reduced reproductive
output), i.e. indirect threats.

New Zealand sea lions are relatively well studied at some breeding areas (e.g. Enderby Island at the
Auckland Islands), but not at others (e.g. Campbell Island). Similarly, some threats are data rich and
relatively well understood (e.g. commercial trawl fishing) whilst others are not (e.g. indirect trophic
effects). Because of this, a process that incorporated both highly quantitative modelling approaches,
and more qualitative approaches, was developed, and this is described in more detail in Section 3.

A Summary of the Risk Assessment of Threats to New Zealand Sea lions                                  •4
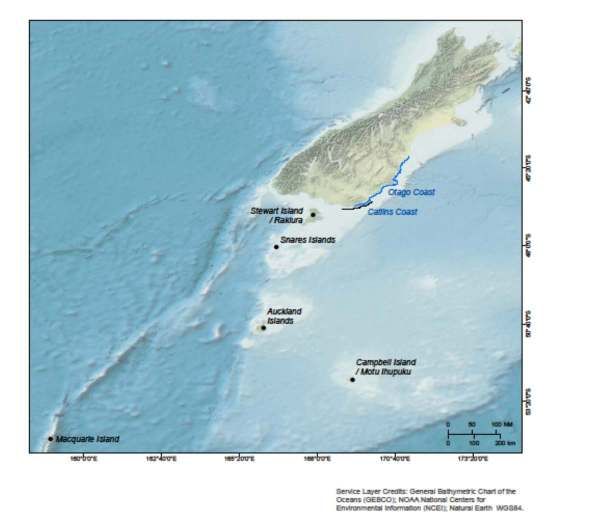
3. Risk assessment approach
The risk assessment process implemented for New Zealand sea lions during 2014-15 involved the
development of demographic operating models based on available field data. Threats were identified
and characterised based on available data and using expert opinion where data was poor or not
available. All of the compiled threats were then included in a risk triage process to prioritise the threats
for more detailed modelling. Population projections were developed using a quantitative risk
assessment model, based on the demographic operating model, for the threats that were carried
through the triage process. The threat characterisation and risk assessment model were reviewed at
two stages of development by an expert panel to ensure the final risk assessment results were as
robust as possible within the timeframe available. Full details of the methodological approach are
provided by Roberts et al (2016).

3.1     Sites
New Zealand sea lions breed in southern and subantarctic New Zealand. The breeding strongholds are
in the subantarctic, at the Auckland Islands and Campbell Island, with smaller numbers breeding at
Stewart Island and on the Otago coast (including the Catlins) of South Island (Figure 1). New Zealand
sea lions are primarily colonial breeders, though scattered births may occur, particularly where
population densities are low. What is known of the historic distribution is summarised in the
consultation document.

Within the Auckland Islands, where approximately 70% of New Zealand sea lion pups are born,
breeding occurs on three smaller islands, Dundas Island, Enderby Island (previously at two areas on
the island, but now only at Sandy Bay) and Figure of Eight Island. On Campbell Island, new colonial
breeding sites have recently become established and the majority of pups are now born at Davis Point
or Paradise Point (Childerhouse et al 2015). Since 1994, small numbers of pups (up to ten) have been
born on the Otago coast, and breeding at Stewart Island has been confirmed within the last 5 years,
with 36 pups recorded in 2015. There have been occasional, infrequent, breeding records at the Snares
Islands (Childerhouse & Gales 1998). Further population information is provided in appendices to the
consultation document.

In addition to the number of animals in a population, the population structure is also important in
assessing the recovery of a threatened species. Indeed, threat classification schemes consider the
number of sub-populations in determining threat status. Definitions for terminology referring to
populations for the purposes of the TMP are based on the New Zealand Threat Classification Scheme
and the IUCN RedList (Townsend et al 2008, IUCN RedList 2015). The New Zealand sea lion population
is considered the total number of animals across the range and a sub-population is a breeding area
with an annual pup production of at least 35 pups born per year for 5 years with an immigration rate
of less than one adult female area each year. A breeding area is used to describe a geographically
defined area where New Zealand sea lions breed, regardless of whether the area is considered a sub-
population. Using these definitions, there are currently two sub-populations at the Auckland Islands
and Campbell Island. Note, immigration between different breeding areas on the Auckland Islands (i.e.
Dundas, Enderby and Figure of Eight Islands) occurs, so these areas together form a single sub-

A Summary of the Risk Assessment of Threats to New Zealand Sea lions                                    •5
population. The Stewart Island breeding area is approaching the size required for a sub-population,
but pup production will need to be sustained at or above current levels for several more years.

Figure 1.       Overall map of New Zealand sea lion distribution – which includes the Auckland, Campbell,
                Stewart, Snares Islands, and Macquarie Islands and the Otago/Catlins coasts.

3.2     Data
There were several sources of available data for the risk assessment modelling.

For the Auckland Islands sub-population, sufficient data were available to develop a demographic
model. Pup production estimates were available for breeding areas dating from 1966-2015 for Sandy
Bay, and 1995 -2015 for other Auckland Island areas. Mark-resight data of tagged sea lions provided
observations of female sea lions marked from 1990-2014 and resighted from 1998-2014. The most
common form of marking has been flipper tags using one tag attached to each pectoral flipper when
they are pups. A smaller number of sea lions have been marked with micro-chips and even fewer with
brands. Behavioural observations of marked female animals at Sandy Bay were also used to determine
breeding status during each field season. Each animal was categorised as a confirmed pupper,
confirmed non-pupper, unknown or immature. Rates of tag loss were estimated using the field
observations of the number of flipper tags seen on each sea lion and compared with observations of
those sea lions that were also micro-chipped or branded.

A Summary of the Risk Assessment of Threats to New Zealand Sea lions                                 •6
For the sea lions breeding on the New Zealand mainland, the New Zealand Sea Lion Trust has been collecting data based on photographs, from which individual sea lions are identified and tracked over time similar to the marked sea lions on the Auckland Islands. The population data from Campbell and Stewart Islands were not considered sufficient to develop a demographic model for this risk assessment process. Estimates of pup production for sea lions breeding on Campbell Island have been infrequent, using several different methods. Mark-resight studies have been undertaken more recently, however the number of tags, resightings and the time between studies meant this dataset was insufficient at present for developing a demographic operating model adequate for this risk assessment. Over the last five years, sea lion pups have been counted and tagged on Stewart Island in late March. Few of these have been resighted. As the survey work has been conducted late in the breeding season, pup mortality may have occurred before the researchers have been present, underestimating the pup production at this breeding area. 3.3 Demographic analysis of available data The first stage of the analytical process was a demographic assessment made by constructing a population model based on the observed census, mark-resighting and age distribution data from the most well studied breeding areas at Sandy Bay on the Auckland Islands and at Otago. The aim of this demographic modelling was to construct operating models (female only) as a basis for risk assessment and future projections. These models needed to be able to reflect the observed population trends. Full details of the modelling approach is provided by Roberts et al (2016). A panel of national and international independent experts, supported by relevant subject matter advisors, was convened to provide guidance on the level of threats to New Zealand sea lions and review the demographic assessment. The first of two workshops was held 28 April to 1 May 2015 and built on previous discussions at a pup mortality workshop held in June 2014 (see Appendix 1 for minutes of this workshop), but considered all threats to all sea lion age groups. The initial stage of the risk assessment model – the demographic assessment, was completed in advance of the first workshop, in order for the panel to review and provide recommendations for model improvements. Notes, outcomes and recommendations from this workshop are provided in Appendix 2. 3.4 Threat identification To ensure the risk assessment process considered the full range of relevant threats, an iterative process was used to identify all known and potential, non-negligible, threats to New Zealand sea lions. First, existing threat information from the previous management framework (DOC 2009), the literature (e.g. Robertson & Chilvers, 2011) and recent experience in threat management for other marine mammals (e.g. Currey et al 2012) were collated and classified by threat type. In November 2014 this list was presented for review to a broad group of stakeholders established as part of the TMP development process. This list, together with input from stakeholders and technical experts, was used to develop a comprehensive list of all threats, and used as the basis of the threat characterisation described below. The list was circulated to the expert panel participants ahead of the first workshop and, during the workshop, the list was reviewed and refined. The resulting list formed the basis of the threat characterisation (included in Appendix 2). A Summary of the Risk Assessment of Threats to New Zealand Sea lions •7
3.5     Threat characterisation
For each threat, or potential threat, the next stage was to identify which population components each
threat impacts and the mechanism through with the threat impacts on animals. Characterising threats
in this way enables numeric threat scenarios to be modelled and prioritised.

The population components used were: breeding area (Auckland Islands/Campbell Island/Stewart
Island/Mainland); life stage (pup/juvenile/adult); and sex (male/female).

The mechanism through which each threat acts on animals was classified by identifying the
demographic parameter(s) which would be changed (survival/breeding rate). In most cases this could
be estimated as, or translated to, a number of animals removed from a certain component of the
population (including indirect mechanisms such as starvation of pups if lactating females are killed).
For threats that impact on breeding rate, this was characterised by the proportional reduction in
pupping rate amongst mature females in the relevant breeding area. Both removal of animals and
reduction in pupping rate are measures readily modelled. Suitably partitioned models were available
for the Auckland Islands and Otago breeding areas (see Section 3.3).

Threats were initially characterised by DOC and MPI staff, and provided for review by the expert panel,
and relevant expert advisors, at the first workshop in April 2015. Once threats were identified and
characterised by population component and mechanism, the next stage was to assign a best estimate
and/or credible bound of the extent of each threat to each population component. This was a major
focus of the first expert panel workshop.

For some threats extensive data were available, such as estimates of captures in trawl fisheries in the
vicinity of the Auckland Islands and Campbell Island. Where the panel considered the existing evidence
base adequate, best estimates (with associated uncertainty) were generated for that threat. Expert
advisors were able to provide information to the panel at the workshop which allowed estimation of
the extent of some threats to be made at the workshop. For some other threats, it was identified that
data existed but not immediately available, and the panel tasked DOC/MPI and/or expert advisors to
collate information to populate a best estimate and/or credible bound for later review. In other cases,
where little or no information was available, the panel either provided estimates based on their own
or expert experience, or decided the threat was so small that further consideration was not required.
In all cases where the panel assigned a best estimate and/or credible bound, a justification/confidence
score was assigned to record the associated level of uncertainty in the estimate.

Because of the large number of threats identified, the panel also prioritised which threats were most
important to be included in the more detailed modelling. A complete list of threats identified, their
characterisation and estimates of extent is included in Appendix 2. The appended list includes
modifications that were made following the first workshop, and reviewed by the panel at the second
workshop. From this extensive list of threats, model input matrices of the upper bounds of threat
estimates were developed for the Auckland Islands and Otago breeding areas (the two areas to be
modelled), often providing year by year animal removal rates (Appendix 3). These formed the basis of
the modelling evaluations reported in Section 5.

A Summary of the Risk Assessment of Threats to New Zealand Sea lions                                •8
4. Results Auckland Islands and Otago
As outlined in Section 3.3, sufficient data were available to develop demographic operating models
for the Auckland Islands sub-population and Otago breeding area. A summary of the risk triage and
more detailed modelling for both areas, as well as a retrospective analysis for the Auckland Islands is
provided here. Full details were reported by Roberts et al (2016).

4.1        Risk triage
A triage of the risks posed to New Zealand sea lions was conducted in order to limit the number of
risks to be included in the more detailed (Markov chain Monte Carlo, MCMC) modelling. To do this, a
simple model was used to assess the upper bound, or worst case scenario, of the threat by predicting
the response of the population to that threat being removed. The results of this triage are not
considered to be the best estimate of the risks posed to the New Zealand sea lions, but a mechanism
to reduce the list of the threats to those that have the largest influence.

4.1.1      Auckland Islands
Triage model run projection outputs for the Auckland Islands using the final model are shown in Table
1 and Figure 2. The black line in Figure 2 indicates the estimated historical trend and population
projection based on demographic parameters from the last ten years. The removal of each single
threat is plotted separately.

The effects of removing the threats that act on pups (i.e. Klebsiella, hookworm, wallows1) have a
delayed effect on the size of the mature population of sea lions. This is because the pups that will
survive still need time to mature before they are included in the modelled mature female population.

Removal of the upper bound of Klebsiella risk creates the largest change in population size over the
20 year time period (2017-2037), however the population reacts more quickly to the removal of the
upper bound of estimated trawl interactions as this acts directly on the mature females. The ratio of
mature female population in 2037 compared with 2017 is 1.30 when Klebsiella is removed, and 1.24
when trawl interactions are removed.

The independent panel considered that some of the upper bounds used in the triage process were
unlikely to be realistic and should be treated with caution.

1While this report refers to this threat as ‘wallows’, this includes all types of hole, drop, barrier, that either causes a sea lion pup to drown or
be separated from its mother.

A Summary of the Risk Assessment of Threats to New Zealand Sea lions                                                                            •9
Table 1 Auckland Islands Triage model run estimates of mature female λ2037 and N2037/N2017 for all threat
scenarios, using upper values of threat mortality. *Carried forward to detailed modelling.
Threat scenario λ2037 N2037/N2017
Klebsiella* 1.02 1.44
Commercial trawl* 1.01 1.36
Male aggression* 0.98 0.63
Trophic – prey* 0.97 0.60
Hookworm* 0.97 0.59
Wallows* 0.97 0.55
Tuberculosis 0.96 0.54
Entanglement 0.96 0.50
Shark predation 0.96 0.50
Base 0.96 0.49
Figure 2: Triage projections of model estimated mature N at the Auckland Islands in the period 1990-
2037, using upper values of threat mortality. Black lines = with threat (base run); coloured lines = threats
alleviated.
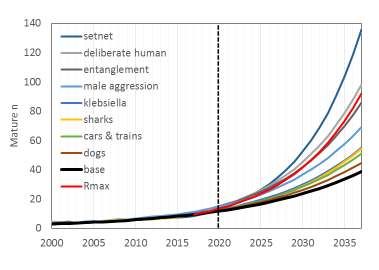
A Summary of the Risk Assessment of Threats to New Zealand Sea lions • 104.1.2 Otago Peninsula
Triage model run projection outputs for the Otago Peninsula are shown in Table 2 and Figure 3.
Table 2 Otago Peninsula Triage model run estimates of mature female λ2037 and N2037/N2017 for all threat
scenarios, using upper values of threat mortality. *Carried forward to detailed modelling.
Threat scenario λ2037 N2037
Set net* 1.15 16.31
Deliberate human mortality* 1.12 9.10
Entanglement* 1.11 7.77
Male aggression* 1.10 6.13
Shark predation 1.10 5.89
Klebsiella 1.09 5.69
Cars & trains 1.09 5.34
Dogs 1.08 4.61
Base 1.07 4.05
Figure 3: Triage projections of model estimated mature n at the Otago Peninsula in the period 1990-2037,
using upper values of threat mortality. Black lines = with threat (base run); coloured lines = threats alleviated,
except red for population growth at Rmax (assumed to be 0.12).
A Summary of the Risk Assessment of Threats to New Zealand Sea lions • 11For the Otago peninsula model, the removal of upper bounds of some threats produced a very rapidly
growing population, higher than the assumed maximum optimal growth rate (Rmax). This indicates that
the upper bounds used for setnet and deliberate human threats were probably unrealistically high.
For the Auckland Islands, the risks carried forward from the risk triage were:
Klebsiella
Commercial trawl (with an 82% discount rate as a base case, with other discount rates
as sensitivities. The discount rate is the assumed probability that a sea lion will survive
an encounter with a trawl fitted with a SLED)2
Male aggression
Trophic – food limitation
Hookworm
Wallows
For the Otago peninsula, the risks carried forward from the risk triage were:
Setnet
Deliberate human mortality
Entanglement
Male aggression
4.2 Demographic scenario projections
To better understand how much change in demographic parameters was required to lead to recovery
of the population (i.e., a positive population growth rate), a range of scenarios were developed and
assessed. Scenarios were assessed using simple model projections (MPD, maximum of the posterior
density function) to investigate the effect of varying levels of adult survival, pup survival and rate of
pupping on the project population growth rate of mature sea lions.
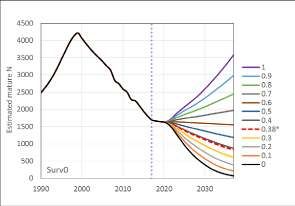
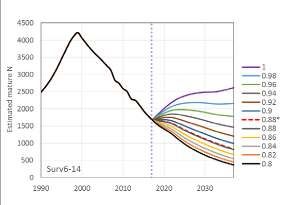
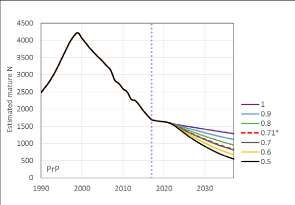
Figure 4 shows the effect of varying demographic parameters on the projected population trend for
the Auckland Islands sub-population, compared with the projection based on the mean of the
demographic parameters from the last ten years. In order to achieve a stable or increasing population,
adult survival would need to increase from 0.88 (the mean over the last ten years) to approximately
0.96, or pup survival would need to increase from 0.38 (the mean over the last ten years) to almost
0.6. Increased pupping rate alone would not result in a stable or increasing population (Figure 4). It is
important to note that reducing a risk that acts on any of these demographic parameters is also likely
to effect the others as well.
2 See MPI 2012
A Summary of the Risk Assessment of Threats to New Zealand Sea lions • 12Figure 4 Demographic rate scenario projections of model estimated mature N at the Auckland Islands in the period 1990-2037, with varying Surv0 (top), Surv6-14 (middle), PrP (bottom). Dashed red lines are projections using the mean of each respective demographic rate (*=value) from 2005-2012 for Surv0 and 2005-2014 for Surv6-14 and PrP. A Summary of the Risk Assessment of Threats to New Zealand Sea lions • 13
4.3     Population projections assessing the effects of threats
Full Bayesian modelling (using Markov chain Monte Carlo methods, known as MCMC) was conducted
on all risks carried forward from the risk triage process. This modelling approach is computationally
time intensive for complex models such as the population model constructed to reflect the various
mark types, ages and maturity stages and this limits the number of runs that can be achieved.

The estimates of impact by each threat were determined by the first expert panel workshop and
assessed using the operating models (generated by the demographic assessment). The impact of each
threat was removed from the model and the resulting population trajectory compared with the base
case (using recent observed demographic parameters).

MCMC runs were conducted based on the best estimates of risk levels, as defined by the threat
characterisation process (see Section 4.2, Appendix 3). Model outputs are given in terms of the
population growth rate of mature females in 2037 (λ2037) and the relative population of mature
females in 2037 compared with 2017 (N2037/N2017). Due to the delay in the effect of alleviating some
risks on the mature female population (as some risks act on the pups) it is more appropriate to
compare the difference in λ2037.

The independent panel met for a second workshop in September 2015, with relevant modelling
advisors, 1-3 September 2015, to consider the methods and results of the qualitative and quantitative
risk assessment approaches and provide further advice on improving the modelling. Notes and
recommendations from this workshop are provided in Appendix 4.

4.3.1   Auckland Islands
Model outputs using the final model configuration are summarised in Table 3, Figure 5 and Figure 6.

The results in Table 3 show that, if threats are removed individually, only the removal of Klebsiella will
result in a stable or increasing population, however it is important to note the wide uncertainties as
seen in Table 3 and Figure 5. The alleviation of Klebsiella produced the projection with the highest
λ2037, of 1.002 (0.786-1.276). This is followed by the impact of the trophic risk with a λ2037 of 0.974
(0.805-1.175), followed by male aggression with a λ2037 of 0.965 (0.749-1.246) and trawl (given an 82%
discount rate) with a λ2037 of 0.965 (0.749-1.231).

A Summary of the Risk Assessment of Threats to New Zealand Sea lions                                 • 14
Table 3       Auckland Islands model estimates of mature female λ2037 and N2037/N2017 for all threat scenarios.
Values are median and 95% credible interval. Shading indicates the sensitivities around the base case for trawl
risk (82% discount rate).

       Threat scenario
                              λ2037                                 N2037/N2017

       Base                   0.961 (0.89 - 1.02)                   0.47 (0.32 - 0.67)
       Wallows                0.965 (0.891 - 1.027)                 0.51 (0.35 - 0.74)
       Hookworm               0.967 (0.894 - 1.026)                 0.52 (0.36 - 0.75)
       Aggression             0.969 (0.895 - 1.029)                 0.54 (0.38 - 0.77)
       Trophic                0.974 (0.905 - 1.038)                 0.59 (0.36 - 0.96)
       Klebsiella             1.005 (0.926 - 1.069)                 0.93 (0.67 - 1.26)
       Trawl captures         0.964 (0.890 - 1.025)                 0.49 (0.34 - 0.72)
       Trawl 82% discount     0.965 (0.891 - 1.024)                 0.5 (0.35 - 0.73)
       Trawl 35% discount     0.971 (0.899 - 1.031)                 0.58 (0.4 - 0.84)
       Trawl 20% discount     0.973 (0.898 - 1.032)                 0.6 (0.41 - 0.88)
       Trawl interactions     0.977 (0.902 - 1.036)                 0.64 (0.44 - 0.92)
       Max growth             1.069 (1.051 - 1.084)                 3.4 (2.39 – 4.60)

A Summary of the Risk Assessment of Threats to New Zealand Sea lions                                      • 15
Figure 5: Model estimates of mature n at the Auckland Islands in the period 1990-2037 for trawl fishery mortality scenarios. Black lines = with threat (base run) and max growth; red lines = threat alleviated. A Summary of the Risk Assessment of Threats to New Zealand Sea lions • 16
Figure 6:     Model estimates of mature n at the Auckland Islands in the period 1990-2037 for all other threat
scenarios. Black lines = with threat (base run) and max growth; red lines = threat alleviated.

A Summary of the Risk Assessment of Threats to New Zealand Sea lions                                     • 17
4.3.2   Otago Peninsula
The MCMC projections for the Otago Peninsula threat scenarios are presented in Table 4 and Figure
7. The alleviation of the best estimate for the risk of deliberate human mortality results in the highest
λ2037 of 1.093 (1.075-1.112).

Table 4      Otago Peninsula model estimates of mature female λ2037 and N2037/N2017 for all threat scenarios.
Values are median and 95% credible interval.

                     Threat scenario          λ2037                    N2037/N2017
                     Deliberate mortality     1.093 (1.075-1.112)      5.98 (4.28-8.33)

                     Entanglement             1.088 (1.070-1.106)      5.41 (3.89-7.49)
                     Male aggression          1.087 (1.070-1.104)      5.36 (3.88-7.32)
                     Set net                  1.082 (1.065-1.099)      4.83 (3.52-6.59)
                     Base                     1.070 (1.053-1.087)      3.89 (2.82-5.34)

A Summary of the Risk Assessment of Threats to New Zealand Sea lions                                    • 18
Figure 7: Estimates of mature n at the Otago Peninsula in the period 1990-2037 for all threat scenarios.
Black lines = with threat (base run); red lines = threat alleviated.
4.4 Retrospective analysis of Auckland Island decline
Further modelling analyses were undertaken to investigate how much of the observed ~50% decline
in pup production at the Auckland Islands since the late 1990s could be explained by the key threats
that had passed through the risk triage process. To do this a retrospective analysis was conducted in
which demographic rate estimates obtained from the best-estimate MCMC run for each of the key
threats were used to project forwards from the year 2000 with removing any mortality associated
with each threat (or using optimal demographic rates used in the case of trophic food limitation).
The following threats were assessed:
• Trophic (food limitation)
• Commercial trawl – interactions (i.e., assuming all sea lions exiting through SLEDs die)
• Klebsiella pneumoniae mortality of pups
• Hookworm mortality of pups
A Summary of the Risk Assessment of Threats to New Zealand Sea lions • 19The timing of the effect of each threat on mature numbers varied because some threats operate on different age groups and the trophic impacts of food limitation were applied only from 2005-2008. As such it was not a fair comparison of the effects of each threat with respect to the mature N in 2015, although it does give an indication of the effect on the threat on the population trend. None of the threats assessed was sufficient alone to explain the observed decline in pup production at the Auckland Islands (see Figure 8 and Table 5). The alleviation of Klebsiella pneumoniae mortality of pups had the greatest effect on population growth rate (λ2015 = 0.98, 95% CI = 0.94-1.01) relative to the base run (λ2015 = 0.94, 95% CI = 0.91-0.98). A Summary of the Risk Assessment of Threats to New Zealand Sea lions • 20
Figure 8      Predicted mature N by year comparing the base run – mature N with threat affecting population
(grey lines) and run with the threat alleviated (blue lines). Heavy lines are median estimates and light lines
are credible intervals.

Table 5      Projected growth rate of mature N (λ2015) and population status in 2015 N2015/N2000 (%)

                       Threat                            λ2015              N2015/N2000 (%)

                       Klebsiella                        0.98 (0.94-1.01)   68 (63-73)

                       Trophic (prey)                    0.96 (0.92-1.00)   56 (52-61)

                       Hookworm                          0.95 (0.92-0.98)   53 (49-57)

                       Commercial trawl – Interactions   0.94 (0.91-0.97)   59 (55-64)

                       Base run                          0.94 (0.91-0.98)   47 (44-51)

A Summary of the Risk Assessment of Threats to New Zealand Sea lions                                     • 21
5. Results Campbell and Stewart Islands
As outlined in Section 3.3 there was not sufficient data available to build demographic operating
models for the Campbell Island sub-population and Stewart Island breeding area. For these areas,
priority threats were identified through the threat characterisation process (see Section 3.5). This
process included review and input by the expert panel, primarily during the first workshop (Appendix
3), and was later supplemented by advice during the second workshop (Appendix 4).
5.1 Campbell Island
Priority threats identified to the Campbell Island sub-population were:
• Klebsiella disease
• Interactions between trawl gear and sea lions
• Holes at key breeding sites at Campbell Island
• Pups, and occasionally females, injured or killed by aggressive male sea lions
5.2 Stewart Island
Priority threats identified to the Stewart Island breeding area were:
• Klebsiella disease
• Climate and environmental change causing depletion of food resources
• Interactions between set nets and sea lions
• Interactions between people and sea lions
6. Discussion
The risk assessment process described in this report identified the most important risks to each New
Zealand sea lion sub-population/key breeding area using a variety of methods and allowed
appropriate management options to be developed to allow for recovery of the species. In addition,
the modelling tools developed allowed an assessment of the degree to which individual threats may
have contributed to the observed population decline, and will allow for a quantitative assessment of
progress towards achieving stated management goals.
The sub-population with highest conservation concern is that at the Auckland Islands, where the
greatest declines have been observed. Results from the risk assessment suggest that alleviation of any
one threat will not result in the population increasing. Similarly none of the major threats assessed
were sufficient alone to explain the observed decline in pup production at the Auckland Islands. This
included commercial trawl-related mortality, even with the most conservative view of cryptic
mortality (all sea lions that exit trawl through SLEDs die, i.e. the trawl interactions option modelled)
A Summary of the Risk Assessment of Threats to New Zealand Sea lions • 22and associated loss of pups. Clearly multiple factors were acting on the population, and for management to recover the species a holistic view must be adopted. The retrospective modelling also showed that disease-related mortality of pups could have a major effect on population growth rate if the best-estimates of annual mortality are realistic, but it would need to have commenced some years prior to the start of the decline in pup production to be the main cause of decline (given the delay to maturation). Some threats are relatively well understood, with sufficient data available. However, other threats, such as trophic impacts, are less well known. The expert panel highlighted that the trophic risk was potentially underestimated, as the increase of the Auckland Islands sub-population during the 1990s demonstrates the ability of the population to increase under good conditions. Information on sea lion diet and prey availability is limited and the mechanism of any trophic effects and the underlying drivers (e.g. indirect fisheries effects vs climate/oceanographic changes) were not clear. Understanding the mechanisms of trophic effects will allow a better assessment of risk and assist in identifying the drivers, thus enabling appropriate management options to be developed if required. Klebsiella disease is another ostensibly important threat where our knowledge is limited. If successful long term management of this threat is to be developed, a full understanding of the nature and transmission of the disease will be required. The Otago breeding area contains small numbers of breeding females, making it susceptible to small levels of risks. The risk assessment has identified leading risks, such as deliberate human impacts, which must be managed to maximise future population growth to encourage the establishment of a new sub-population. Although the risk assessment process was thorough and relatively complex, review by the expert panel identified aspects worthy of future exploration. The role and influence of any compensatory effects of the risks assessed was one such area. It is clear that multiple threats are acting on sea lions, and an understanding of how risks factors may interact will aid the prioritisation of management actions. A structured qualitative process with expert review was used to identify priority to threats to the Campbell Island sub-population and Stewart Island breeding area. This process collated available data on threats and allowed expert opinion to assess and supplement this data in a transparent way. Considering how the risk assessment approach developed for New Zealand sea lions could be applied in other situations, it is clear that the rapid triage process was adequate to identify key threats, and thus could be relatively easily and quickly be applied in other situations to allow rapid development of management actions. One of the greatest values in the more in depth modelling aspects of the risk assessment was that it allowed for better measurement of progress against management actions, however, developing these models is resource intensive and may not always be necessary. A Summary of the Risk Assessment of Threats to New Zealand Sea lions • 23
7. Acknowledgements

The modelling approaches used in this risk assessment were developed by Jim Roberts and Ian Doonan
(NIWA) under contract to MPI. We would like to thank all those who contributed to the risk
assessment process including the numerous advisers, and particularly the expert panel: Jason Baker
(Pacific Island Fisheries Science Center, National Oceanic and Atmospheric Administration), David
Hayman (Institute of Vet, Animal and Biomedical Sciences, Massey University), Mark Hindell (Institute
for Marine and Antarctic Studies, University of Tasmania), Mike Lonergan (The University of Dundee).
We also acknowledge the numerous DOC and MPI staff who contributed to the risk assessment
process and to the production of this report.

    8. References

Baker, C.S., Chilvers, B.L., Constantine, R., DuFresne, S., Mattlin, R.H., van Helden, A., Hitchmough, R.,
        (2010) Conservation status of New Zealand marine mammals (suborders Cetacea and
        Pinnipedia), 2009. New Zealand Journal of Marine and Freshwater Research, Volume 44,
        Issue 2, p101-115.

Burgman, M.A., Ferson, S., Akçakay, H.R., (1993) Risk Assessment in Conservation Biology;
      population and community biology series 12. Chapman & Hall.

Childerhouse, S.; Gales, N.; (1998). The historic distribution and abundance of the New Zealand sea
           lion Phocarctos hookeri. New Zealand Journal of Zoology. 25:1-16

Childerhouse, S.; Fyfe, J.; Muller, C.; Gonzalez-Argandona, K.; French, R.; Roe, W. (2015a). Final
        Report: NZ sea lion research at Campbell Island-Motu Ihupuku, 2014/15. Report produced by
        Blue Planet Marine for the Deepwater Group.

Childerhouse, S.; Michael, S.; Adams, L.; Burns, T.; Cockburn, S.; Hamer, D.; Maloney, A.; Pugsley, C.
        (2015b). Final Report: New Zealand sea lion research at the Auckland Islands 2014/15. Report
        produced by Blue Planet Marine for the NZ Department of Conservation.

Currey, R.J.C., Boren, L.J., Sharp, B.R., Peterson, D., (2012) A risk assessment of threats to Maui’s
        dolphins. Ministry for Primary Industries and Department of Conservation, Wellington. 51 p.

DOC (2009). New Zealand sea lion species management plan: 2009–2014. Wellington, Department
       of Conservation.

Hobday, A.J., Smith, A., Webb, H., Daley, R., Wayte, S., Bulman, C., Dowdney, J., Williams, A., Sporcic,
      M., Dambacher, J., Fuller, M., Walker, T. 2007: Ecological risk assessment for the effects of
      fishing: methodology. Report R04/1072 for the Australian Fisheries Management Authority,
      Canberra)

IUCN 2015. The IUCN Red List of Threatened Species. Version 2015-4. .
       Downloaded on 19 November 2015.

A Summary of the Risk Assessment of Threats to New Zealand Sea lions                                 • 24
MPI (2012). SQU6T Final advice Paper (FAP B11-630).
http://www.fish.govt.nz/NR/rdonlyres/E920BB49-CFA7-4448-BDE5-
F708E0F5ACD2/0/FinalAdvicePaperSQU6T2012.pdf
Roberts, J., Doonan, I., (2016) Quantitative Risk Assessment of Threats to New Zealand Sea Lions.
New Zealand Aquatic Environment and Biodiversity Report no. XXX
Robertson, B.C., Chilvers, B.L., (2011) The population decline of the New Zealand sea lion Phocarctos
hookeri: a review of possible causes. Mammal Rev. 41: 253–275.
Townsend, A.J., de Lange, P.J., Duffy, C.A.J., Miskelly, C.M., Molloy, J., Norton, D., (2008) New
Zealand Threat Classification System manual. Wellington, Department of Conservation.
9. Appendices
Appendix 1. Threat scenarios
Appendix 2. New Zealand sea lion pup mortality workshop: notes
Appendix 3. Development of the Threat Management Plan for New Zealand
sea lions: NZSL Threat workshop 1
Appendix 4. Development of the Threat Management Plan for New Zealand
Sea Lions: NZSL Threat Workshop 2
A Summary of the Risk Assessment of Threats to New Zealand Sea lions • 25Appendix 1: Threat scenarios
Table 0-1: Summary of threats used in Auckland Islands Triage projection models for all threat scenarios assessed. Threat levels are upper bound values.
Numbers killed
Threat scenario
Demographic group Threat type Age 1990 1991 1992 1993 1994 1995 1996 1997 1998 1999 2000 2001 2002 2003 2004 2005 2006 2007 2008 2009 2010 2011 2012 2013 2014 2015 2016
(upper bound)
Adult 5+ 0 0 0 0 0 0 0 0 0 9.1 8.7 8.4 8.8 8.1 8.4 7.9 7.6 7.0 6.7 6.6 6.1 5.8 5.4 5.3 5.0 5.0 5.0
Male aggression Pup indirect Numbers killed 0 0 0 0 0 0 0 0 0 0 3.2 3.0 3.0 3.1 2.8 2.9 2.8 2.7 2.5 2.4 2.3 2.1 2.0 1.9 1.8 1.8 1.8 1.8
Pup direct 0 0 0 0 0 0 0 0 0 0 419.6 182.9 314.9 73.8 81.4 81.4 82.5 75.9 81.6 67.9 35.4 52.6 37.4 128.7 62.0 13.4 17.2 17.2
Adult 5+ 1.2 1.2 1.3 1.4 1.5 1.7 1.8 2.0 2.1 2.0 1.9 1.9 2.0 1.8 1.9 1.8 1.7 1.6 1.5 1.5 1.4 1.3 1.2 1.2 1.1 1.1 1.1
Entanglement Juvenile Numbers killed 1 to 4 5.2 5.6 6.0 6.4 6.9 7.4 8.2 8.9 9.4 9.1 8.7 8.4 8.8 8.1 8.4 7.9 7.6 7.0 6.7 6.6 6.1 5.8 5.4 5.3 5.0 5.0 5.0
Pup 0 0.4 0.4 0.5 0.5 0.5 0.6 0.6 0.7 0.7 0.7 0.7 0.7 0.7 0.6 0.7 0.6 0.6 0.5 0.5 0.5 0.5 0.5 0.4 0.4 0.4 0.4 0.4
Hookworm Pup Numbers killed 0 80.0 80.0 80.0 80.0 80.0 80.0 85.0 94.0 96.0 91.0 91.0 91.0 72.0 80.0 80.0 68.0 66.0 71.0 69.0 48.0 58.0 49.0 53.0 61.0 50.0 50.0 50.0
Klebsiella Pup survival Demographic rate 0 NA
Juvenile+ 1+ 12.0 12.0 12.0 12.0 12.0 12.0 12.8 14.2 14.4 13.7 13.6 13.6 10.9 12.0 12.0 10.2 9.9 10.6 10.4 7.1 8.6 7.4 8.0 9.2 7.5 7.5 7.5
Shark predation Numbers killed
Pup 0 4.2 4.2 4.2 4.2 4.2 4.2 4.5 5.0 5.0 4.8 4.8 4.8 3.8 4.2 4.2 3.6 3.5 3.7 3.6 2.5 3.0 2.6 2.8 3.2 2.6 2.6 2.6
Adult survival 6 to 14
Tuberculosis Demographic rate NA
Pup indirect survival 0
Commerical trawl - Adult
Numbers killed 3+ 0.0 0.0 0.0 0.0 0.0 0.0 121.0 115.0 62.0 26.0 67.0 59.0 71.0 49.0 194.0 169.0 162.0 113.0 256.0 242.0 274.0 154.0 116.0 138.0 170.0 170.0 170.0
captures
Pup indirect 0 0.0 0.0 0.0 0.0 0.0 0.0 42.0 40.0 22.0 9.0 23.0 20.0 25.0 17.0 68.0 59.0 57.0 40.0 90.0 85.0 96.0 54.0 41.0 48.0 60.0 60.0 60.0
Wallows Pup Numbers killed 0 111.9 111.9 111.9 111.9 111.9 111.9 119.3 132.2 134.3 127.4 126.9 127.1 101.4 111.8 111.8 95.5 92.9 98.9 96.7 66.7 80.6 68.9 74.9 85.8 70.0 70.0 70.0
Pup 0
Trophic Adult survival Demographic rate 6 to 14 NA
Adult pupping 4+
A Summary of the Risk Assessment of Threats to New Zealand Sea lions • 26Table 0-2: Summary of threats used in Auckland Islands MCMC projection models for all threat scenarios assessed. Threat levels are best estimate values.
Numbers killed
Threat scenario Demographic group Threat type Age 1990 1991 1992 1993 1994 1995 1996 1997 1998 1999 2000 2001 2002 2003 2004 2005 2006 2007 2008 2009 2010 2011 2012 2013 2014 2015 2016
Adult 5+ 0.0 0.0 0.0 0.0 0.0 0.0 0.0 0.0 0.0 9.1 8.7 8.4 8.8 8.1 8.4 7.9 7.6 7.0 6.7 6.6 6.1 5.8 5.4 5.3 5.0 5.0 5.0
Male aggression Pup indirect Numbers killed 0 0.0 0.0 0.0 0.0 0.0 0.0 0.0 0.0 0.0 3.2 3.0 3.0 3.1 2.8 2.9 2.8 2.7 2.5 2.4 2.3 2.1 2.0 1.9 1.8 1.8 1.8 1.8
Pup direct 0 0.0 0.0 0.0 0.0 0.0 0.0 0.0 0.0 0.0 419.6 182.9 314.9 73.8 81.4 81.4 82.5 75.9 81.6 67.9 35.4 52.6 37.4 128.7 62.0 13.4 17.2 17.2
Hookworm Pup Numbers killed 0 0.0 0.0 0.0 0.0 0.0 0.0 0.0 0.0 0.0 104.9 182.9 240.8 72.2 73.8 232.2 129.5 87.4 93.9 78.2 47.2 0.0 18.7 51.5 71.4 0.0 8.6 8.6
Klebsiella Pup survival Demographic rate 0 0.0 0.0 0.0 0.0 0.0 0.0 0.0 0.0 0.0 315 131 55.6 474 605 359 371 457 491 409 260 431 131 283 373 301 310 310
Commerical trawl - Adult 3+ 58.5 10.5 40.3 8.8 18.8 55.3 74.0 77.0 38.0 16.0 44.0 31.0 30.0 14.5 27.0 22.5 19.0 13.0 11.5 9.0 9.5 6.0 5.5 6.0 4.0 4.0 4.0
Numbers killed
Captures Pup indirect 0 20.5 3.7 14.1 3.1 6.6 19.3 25.9 27.0 13.1 5.6 15.4 10.7 10.5 5.1 9.5 7.9 6.7 4.6 4.0 3.2 3.3 2.1 1.9 2.1 1.4 1.4 1.4
Commerical trawl - Adult 3+ 0.0 0.0 0.0 0.0 0.0 0.0 0.0 0.0 0.0 0.0 0.0 0.0 0.0 9.7 25.8 22.6 19.9 13.7 17.4 15.8 15.5 10.3 8.8 9.2 6.3 6.3 6.3
Numbers killed
82% discount Pup indirect 0 0.0 0.0 0.0 0.0 0.0 0.0 0.0 0.0 0.0 0.0 0.0 0.0 0.0 3.4 9.0 7.9 7.0 4.8 6.1 5.5 5.4 3.6 3.1 3.2 2.2 2.2 2.2
Commerical trawl - Adult 3+ 0.0 0.0 0.0 0.0 0.0 0.0 0.0 0.0 0.0 0.0 0.0 0.0 0.0 20.8 73.5 62.1 56.1 35.1 48.4 42.6 46.7 26.8 20.1 22.9 15.0 15.0 15.0
Numbers killed
35% discount Pup indirect 0 0.0 0.0 0.0 0.0 0.0 0.0 0.0 0.0 0.0 0.0 0.0 0.0 0.0 7.3 25.7 21.7 19.6 12.3 16.9 14.9 16.4 9.4 7.0 8.0 5.3 5.3 5.3
Commerical trawl - Adult 3+ 0.0 0.0 0.0 0.0 0.0 0.0 0.0 0.0 0.0 0.0 0.0 0.0 0.0 24.3 88.7 74.7 67.6 41.9 58.3 51.1 56.7 32.0 23.7 27.2 17.8 17.8 17.8
Numbers killed
20% discount Pup indirect 0 0.0 0.0 0.0 0.0 0.0 0.0 0.0 0.0 0.0 0.0 0.0 0.0 0.0 8.5 31.0 26.1 23.7 14.7 20.4 17.9 19.8 11.2 8.3 9.5 6.2 6.2 6.2
Commerical trawl - Adult 3+ 58.5 10.5 40.3 8.8 18.8 55.3 74.0 77.0 37.5 16.5 44.0 41.5 45.0 29.0 109.0 91.5 83.0 51.0 71.5 62.5 70.0 39.0 28.5 33.0 21.5 21.5 21.5
Numbers killed
Interactions Pup indirect 0 20.5 3.7 14.1 3.1 6.6 19.3 25.9 27.0 13.1 5.8 15.4 14.5 15.8 10.2 38.2 32.0 29.1 17.9 25.0 21.9 24.5 13.7 10.0 11.6 7.5 7.5 7.5
Wallows Pup Numbers killed 0 56.0 56.0 56.0 56.0 56.0 56.0 59.7 66.1 67.1 63.7 63.5 63.5 50.7 55.9 55.9 47.7 46.4 49.4 48.3 33.4 40.3 34.4 37.4 42.9 35.0 35.0 35.0
Pup 0
Trophic Adult survival Demographic rate 6 to 14 NA
Adult pupping 4+
A Summary of the Risk Assessment of Threats to New Zealand Sea lions • 27Table 0-3: Summary of threats used in Otago Peninsula Triage projection models for all threat scenarios assessed. Threat levels are upper bound values.
Numbers killed
Threat scenario
Demographic group Threat type Age 1990 1991 1992 1993 1994 1995 1996 1997 1998 1999 2000 2001 2002 2003 2004 2005 2006 2007 2008 2009 2010 2011 2012 2013 2014 2015 2016
(upper bound)
Adult 5+ 0.0 0.0 0.0 0.0 0.0 0.0 0.0 0.0 0.0 0.0 0.0 0.0 0.0 0.0 0.0 1.0 0.0 0.0 0.0 0.0 0.0 0.0 0.0 0.0 0.0 0.0 0.0
Male aggression Juvenile Numbers killed 1 to 4 0.0 0.0 0.0 0.0 0.0 0.0 0.0 0.0 0.0 0.0 0.0 0.0 0.0 0.0 0.0 0.0 0.0 0.0 0.0 0.0 0.0 0.0 1.0 1.0 0.0 0.0 0.0
Pup indirect 0 0.0 0.0 0.0 0.0 0.0 0.0 0.0 0.0 0.0 0.0 0.0 0.0 0.0 0.0 0.0 0.4 0.0 0.0 0.0 0.0 0.0 0.0 0.0 0.0 0.0 0.0 0.0
Adult 5+ 0.0 0.0 0.0 0.0 0.0 0.0 0.0 0.0 0.0 0.0 0.0 0.0 1.0 0.0 0.0 0.0 0.0 1.0 0.0 0.0 0.0 0.0 0.0 0.0 0.0 0.0 0.0
Entanglement Juvenile Numbers killed 1 to 4 0.0 0.0 0.0 0.0 0.0 0.0 0.0 0.0 0.0 0.0 0.0 0.0 1.0 0.0 0.0 0.0 0.0 1.0 0.0 0.0 0.0 0.0 0.0 0.0 0.0 0.0 0.0
Pup 0 0.0 0.0 0.0 0.0 0.0 0.0 0.0 0.0 0.0 0.0 0.0 0.0 0.4 0.0 0.0 0.0 0.0 0.4 0.0 0.0 0.0 0.0 0.0 0.0 0.0 0.0 0.0
Dogs Pup Numbers killed 0 0.0 0.0 0.0 0.0 0.0 0.0 0.0 0.0 0.0 0.0 0.0 1.0 0.0 0.0 0.0 0.0 0.0 0.0 0.0 0.0 0.0 0.0 0.0 0.0 0.0 0.0 0.0
Adult 5+ 0.0 0.0 0.0 0.0 0.0 0.0 0.0 0.0 0.0 0.0 0.0 0.0 0.0 1.0 0.0 0.0 0.0 0.0 0.0 0.0 1.0 0.0 0.0 0.0 0.0 0.0 0.0
Klebsiella Pup direct Numbers killed 0 0.0 0.0 0.0 0.0 0.0 0.0 0.0 0.0 0.0 0.0 0.0 0.0 0.0 0.0 0.0 0.0 0.0 0.0 0.0 0.0 0.0 0.0 0.0 1.0 0.0 0.0 0.0
Pup indirect 0 0.0 0.0 0.0 0.0 0.0 0.0 0.0 0.0 0.0 0.0 0.0 0.0 0.0 0.4 0.0 0.0 0.0 0.0 0.0 0.0 0.4 0.0 0.0 0.0 0.0 0.0 0.0
Juvenile+Adult 1+ 0.0 0.0 0.0 0.0 0.0 0.0 0.0 0.0 0.0 0.0 0.0 0.0 0.0 0.0 0.0 0.0 0.0 0.0 1.0 0.0 1.0 1.0 0.0 0.0 0.0 0.0 0.0
Shark predation Pup direct Numbers killed 0 0.0 0.0 0.0 0.0 0.0 0.0 0.0 0.0 0.0 0.0 0.0 0.0 0.0 0.0 0.0 0.0 0.0 0.0 0.0 0.0 0.0 0.0 0.0 0.0 0.0 1.0 0.0
Pup indirect 0 0.0 0.0 0.0 0.0 0.0 0.0 0.0 0.0 0.0 0.0 0.0 0.0 0.0 0.0 0.0 0.0 0.0 0.0 0.4 0.0 0.4 0.4 0.0 0.0 0.0 0.0 0.0
Adult survival 5+ 0.0 0.0 0.0 0.0 0.0 0.0 0.0 0.0 0.0 0.0 1.0 1.0 1.0 0.0 0.0 0.0 0.0 0.0 1.0 1.0 0.0 0.0 2.0 0.0 0.0 0.0 0.0
Deliberate human Numbers killed
Pup indirect survival 0 0.0 0.0 0.0 0.0 0.0 0.0 0.0 0.0 0.0 0.0 0.4 0.4 0.4 0.0 0.0 0.0 0.0 0.0 0.4 0.4 0.0 0.0 0.7 0.0 0.0 0.0 0.0
Adult Numbers killed 5+ 0.1 0.1 0.1 0.1 0.2 0.2 0.2 0.2 0.3 0.3 0.3 0.4 0.4 0.5 0.6 0.7 0.7 0.7 0.8 0.8 0.9 0.9 0.9 1.0 1.0 1.0 1.0
Setnet
Pup indirect Numbers killed 0 0.0 0.0 0.0 0.0 0.0 0.0 0.0 0.0 0.0 0.0 0.0 0.0 0.0 0.4 0.0 0.0 0.0 0.0 0.0 0.0 0.4 0.0 0.0 0.0 0.0 0.0 0.0
Juvenile+Adult Numbers killed 1+ 0.0 0.0 0.0 0.0 0.0 0.0 0.0 0.0 0.0 0.0 0.0 0.0 0.0 0.0 0.0 0.0 0.0 1.0 0.0 0.0 0.0 1.0 0.0 0.0 0.0 0.0 0.0
Vehicles
Pup indirect Numbers killed 0 0.0 0.0 0.0 0.0 0.0 0.0 0.0 0.0 0.0 0.0 0.0 0.0 0.0 0.0 0.0 0.0 0.0 0.0 0.0 0.0 0.0 0.4 0.0 0.0 0.0 0.0 0.0
Table 0-4: Summary of threats used in Otago Peninsula MCMC projection models for all threat scenarios assessed. Threat levels are best estimate values.
Numbers killed
Threat scenario Demographic group Threat type Age 1990 1991 1992 1993 1994 1995 1996 1997 1998 1999 2000 2001 2002 2003 2004 2005 2006 2007 2008 2009 2010 2011 2012 2013 2014 2015 2016
Adult 5+ 0.0 0.0 0.0 0.0 0.0 0.0 0.0 0.0 0.0 0.0 0.0 0.0 0.0 0.0 0.0 1.0 0.0 0.0 0.0 0.0 0.0 0.0 0.0 0.0 0.0 0.0 0.0
Male aggression Juvenile Numbers killed 1 to 4 0.0 0.0 0.0 0.0 0.0 0.0 0.0 0.0 0.0 0.0 0.0 0.0 0.0 0.0 0.0 0.0 0.0 0.0 0.0 0.0 0.0 0.0 1.0 1.0 0.0 0.0 0.0
Pup indirect 0 0.0 0.0 0.0 0.0 0.0 0.0 0.0 0.0 0.0 0.0 0.0 0.0 0.0 0.0 0.0 0.4 0.0 0.0 0.0 0.0 0.0 0.0 0.0 0.0 0.0 0.0 0.0
Adult 5+ 0.0 0.0 0.0 0.0 0.0 0.0 0.0 0.0 0.0 0.0 0.0 0.0 0.5 0.0 0.0 0.0 0.0 0.5 0.0 0.0 0.0 0.0 0.0 0.0 0.0 0.0 0.0
Entanglement Juvenile Numbers killed 1 to 4 0.0 0.0 0.0 0.0 0.0 0.0 0.0 0.0 0.0 0.0 0.0 0.0 0.5 0.0 0.0 0.0 0.0 0.5 0.0 0.0 0.0 0.0 0.0 0.0 0.0 0.0 0.0
Pup 0 0.0 0.0 0.0 0.0 0.0 0.0 0.0 0.0 0.0 0.0 0.0 0.0 0.2 0.0 0.0 0.0 0.0 0.2 0.0 0.0 0.0 0.0 0.0 0.0 0.0 0.0 0.0
Adult survival 5+ 0.0 0.0 0.0 0.0 0.0 0.0 0.0 0.0 0.0 0.0 0.5 0.5 0.5 0.0 0.0 0.0 0.0 0.0 0.5 0.5 0.0 0.0 1.0 0.0 0.0 0.0 0.0
Deliberate human Numbers killed
Pup indirect survival 0 0.0 0.0 0.0 0.0 0.0 0.0 0.0 0.0 0.0 0.0 0.2 0.2 0.2 0.0 0.0 0.0 0.0 0.0 0.2 0.2 0.0 0.0 0.4 0.0 0.0 0.0 0.0
Adult Numbers killed 5+ 0.0 0.0 0.0 0.0 0.0 0.0 0.0 0.0 0.0 0.0 0.0 0.0 0.0 0.0 0.0 0.0 0.1 0.1 0.1 0.2 0.2 0.2 0.2 0.3 0.3 0.3 0.3
Setnet
Pup indirect Numbers killed 0 0.0 0.0 0.0 0.0 0.0 0.0 0.0 0.0 0.0 0.0 0.0 0.0 0.0 0.0 0.0 0.0 0.0 0.0 0.0 0.1 0.1 0.1 0.1 0.1 0.1 0.1 0.1
A Summary of the Risk Assessment of Threats to New Zealand Sea lions • 28Appendix 1: New Zealand sea lion pup mortality workshop: notes
New Zealand sea lion pup mortality workshop: notes
Workshop held 10 June 2014
Place: Archibald Centre, Wellington Zoo, Manchester St, Newtown, Wellington
Facilitator: Sarah Wilson (Down 2 Earth Facilitation)
Attendance: Nigel French, David Hayman, Laureline Meynier, Sarah Michael, Wendi Roe (Massey
University), Simon Childerhouse (Blue Planet Marine), Rob Mattlin (Marine Wildlife
Research), Jim Roberts (NIWA), Katrina Goddard (Forest & Bird), Milena Palka (WWF),
Barry Weeber (ECO), David Middleton (Seafood NZ), Richard Wells (DWG & FINZ),
Vicky Reeve, Nathan Walker (MPI), Laura Boren, Katie Clemens, Igor Debski, Jim Fyfe,
Kate McInnes (DOC)
Apologies: Ian Angus (DOC), Louise Chilvers (Massey University), Bruce Robertson (Otago University),
Shaun McConkey (NZ Sea Lion Trust), Michelle Beritzhoff-Law (MPI)
Introductions and Opening
Workshop participants introduced themselves and the agenda was outlined.
A summary paper was pre-circulated, prepared by Simon Childerhouse, Wendi Roe and Jim Roberts.
Workshop organisers thanked the authors and welcomed the paper as a useful background report for
the workshop (Note: the background paper is available on the CSP website).
A question was raised as to why the pup mortality issue was being progressed ahead of the NZ sea
lion Threat Management Plan (TMP) generally. It was clarified that Massey University wrote to
Minister of Conservation asking for some tangible research and adaptive management techniques to
investigate and address the high pup mortality during the coming field season. Due to time constraints
in the development of the TMP and the researchers wanting to take action during the upcoming field
season, the organisers saw this workshop as a parallel process running alongside the TMP and a way
to potentially improve the situation in the interim.
Page 1
Note: These notes set out the discussion held at the workshop. For background and context please refer to
the pre-workshop report by Childerhouse, Roberts and Roe, 2014.You can also read