A WEB GUIDE TO PERCEPTUALLY CONGRUENT SONIFICATION - ICAD ...
←
→
Page content transcription
If your browser does not render page correctly, please read the page content below
The 26th International Conference on Auditory Display (ICAD 2021)                                           June 25 -28 2021, Virtual Conference

                  A WEB GUIDE TO PERCEPTUALLY CONGRUENT SONIFICATION

                            Joe Fitzpatrick                                                         Flaithri Neff

                Centre for Creative Informatics                                       Centre for Creative Informatics
               Limerick Institute of Technology                                      Limerick Institute of Technology
                      Limerick, Ireland                                                     Limerick, Ireland
               joe.fitzpatrick@lit.ie                                                 flaithri.neff@lit.ie

                            ABSTRACT                                      ily on user-memory beyond the most immediately-presented data-
                                                                          points. Sonic Information Design [7] and the use of Embodied
Sonification is an increasingly popular mechanism for data explo-         Cognition [6] are two approaches that aim to make auditory dis-
ration, promoting the need for a greater understanding of human           plays naturally easier to interpret and recall. Both frameworks use
auditory perception and of how sonified information is designed,          pre-existing non-auditory research that examines how humans nat-
presented, and interpreted. In this paper, perceptual modelling is        urally interact with stimuli, the findings of which are then applied
used to explore and demonstrate how perceptual phenomena are              to sonification.
accounted for in sonification design. The framework, extracted                 In terms of evaluation of the field, at present, there are only
from a larger body of work, links perceptual phenomena such as            a few contemporary reviews of the field that gauge the academic
stream segregation to sonification mappings to provide a system-          communitys disposition to sonification as a means of data explo-
atic approach to identifying and addressing perceptually-driven           ration. One such review featured in the proceedings of the In-
problems in applied sonification. A web guide functions to situate        ternational Conference on Auditory Displays 2018 (ICAD) dis-
and guide designers through the complex theoretical constituents          cusses the efficacy of sonification methods and includes qualitative
of auditory perception incorporated in the Perceptually Congruent         data from interviews with prominent sonification practitioners [3].
Sonification (PerCS) framework. This web guide (hosted on soni-           Quinton et al. found the practitioners were concerned with the fol-
fication.ie) highlights and summarises the perceptual phenomena           lowing: poor design frameworks being implemented, the indistinct
most relevant to sonification design and uses simple audio-visual         line between artistic and scientific sonification, failures in identi-
interactions to demonstrate their effect. Preliminary qualitative         fying the needs of the end-user, and the challenges of including
feedback from a brief survey elucidates a small number of end-            user experience evaluation through the design process.
user concerns and comments.                                                    Some potential solutions being proposed by interviewees in
                                                                          Quinto et al. include using simple mappings, mimicking nature
                      1. INTRODUCTION                                     where applicable, and identifying the efficacy of mappings based
                                                                          on their psychoacoustic elements. Although some opinions pro-
In recent years, there has been significant discussion regarding var-     mote that sonification as a technique was in decline, the majority of
ious sonification mapping strategies, with particular emphasis on         practitioners agree that sonification is becoming more widely ac-
the impact of auditory perception in user-evaluations [1] [2] [3] [4]     cepted and that with the proper implementation of effective map-
[5] [6]. Each of these authors share concerns regarding the robust-       ping strategies, it could become a powerful tool for data explo-
ness of sonification practices and propose various solutions rang-        ration. Such strategies, like those mentioned above, must rely on
ing from greater clarification of sonification methodologies [3] to       a solid foundation of existing research. Auditory Scene Analysis
borrowing from existing fields of research, such as design research       (ASA) has been referenced as one such body of work that can be
and linguistics [6].                                                      utilized in sonification design.
     When compared to data-visualization, sonification is signif-
icantly underutilized. One explanation for this may be because
                                                                                        2. AUDITORY SCENE ANALYSIS
sonification applications often require users to learn and remember
which data variable is being mapped to a particular abstract sound.       ASA examines how humans form an auditory scene from the
In addition, users are able to glance at visualizations quickly to aid    sounds of the environment around them. Bregman first introduced
their contextualizing of data, while sonification is inherently serial    the concept of such processes, which draw parallels with other per-
in presentation, making it more difficult to link data relationships      ceptual findings observed in linguistics as well as Gestalt psychol-
that are not side-by-side on the serial timeline. The visual display      ogy [8]. His specific use of the word stream is a good manifes-
of information also acts as a reliable form of external memory, al-       tation of how Bregman conceptualizes the multitude of individual
lowing the user to repeatedly reference data without needing to           sonic dimensions often culminating for listeners as single percep-
memorize it themselves, while auditory presentation relies heav-          tual units representing individual sound-source entities. It is also
                                                                          telling that, in retrospect, any other alternative like noise or just
                                                                          sound is misleading and inefficient to adequately describe what
           This work is licensed under Creative Commons Attribution Non   ASA pertains to. Another important term in Bregmans glossary is
Commercial 4.0 International License. The full terms of the License are   the Principle of Exclusive Allocation; an analogue to what Gestalt
available at http://creativecommons.org/licenses/by-nc/4.0/               psychologists refer to as the Principle of Belongingness. Bregman
The 26th International Conference on Auditory Display (ICAD 2021) June 25 -28 2021, Virtual Conference
makes considerable reference throughout his book to the similari- lying structure to an auditory scene. Auditory demonstrations of
ties between visual perception and auditory perception, and about this are currently available on Bregmans website. This website,
the advantages of applying some of the frameworks from the for- and its auditory examples, has heavily influenced the design of the
mer to the latter. He explains that Belongingness refers to how web guide proposed in this paper [12].
humans perceptually group sensory objects as a means of inter-
preting chaotic stimuli in a perceptual scene. Exclusive Alloca- 3. STREAM SEGREGATION IN SONIFICATION
tion is a necessary and direct consequence of Belongingness, in
that if we perceptually place one object into a group of similar ob- Stream Segregation (SS) is one the core focuses of Bregmans work
jects, it cant then be allocated anywhere else. In order to explain and is particularly relevant to sonification design. Even a low-
this further, Bregman references the writings of Koffka, a Gestalt dimensional dataset (e.g. weekly temperature) can have more than
psychologist who drew on the possible links between visual and one column or data-stream (e.g. temperature in different loca-
auditory perception [9]. tions). A sonification application used to represent such a dataset
must decipher how to relay these independent data-streams in a
way that a user can effectively distinguish each one of them. Say,
for example, two independent temperature values are mapped to a
frequency range. The simplest way to distinguish both is to only
present one sonified data-stream at a time. However, in terms of
complexity, this kind of parameter-mapping sonification - an au-
ditory graph in this case - is as simple as it gets. When datasets
are multidimensional (e.g. temperature and humidity), the result-
ing sonification application needs to be more complex if it seeks to
be efficient or worthwhile. When tackling the challenges of using
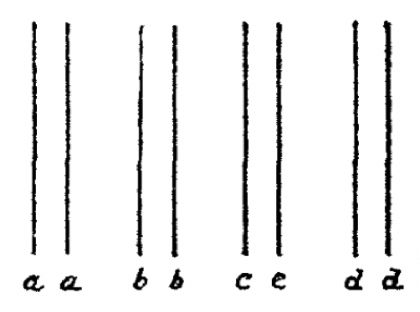
Figure 1: A visual example of perceptual grouping; the space be- sonification for complex datasets, it is useful to have a basic un-
tween the letters acting as the principle cause of separation and derstanding of not only how humans physically perceive sound but
integration [9] also how sound sources can perceptually merge. Stream Segrega-
tion as a concept refers to the ASA phenomenon where multiple
Figure 1 is a visual example of perceptual grouping provided streams either segregate or no longer segregate (merge) depending
by Koffka. The most apparent grouping here is the stripes (the on how close they are in frequency, timbre, time, or space. For
space between the 1st and 2nd a; 1st and 2nd b; and so on) that example, when the streams auditory attributes are varied or salient
Koffka calls the figure. The rest of the image he refers to as the (in terms of tone complexity or amplitude) or distanced (in terms
ground. This is contrasted to an audible pattern where each line of frequency or time), the streams are more likely to remain segre-
represents a beat. In this auditory context, he refers to the ground gated.
as the stillness. The stillness referring also to the ever-present room
noise level or what we know more commonly as the noise floor.
These examples are both simple perceptual examples of how hu-
mans apply belongingness to organize both visual and auditory in-
formation from the senses.
According to Bregman, Perceived Continuity is another key
concept that ties into both perceptual domains and is an exam-
ple of perceptual closure. In the visual domain, Gestalt psychol-
ogists look at strong perceptual forms like squares and circles,
referring to how the contour can be continued perceptually even
if it disappears and reappears at various intervals. This accounts
for the terminology behind Perceived Continuity in visual per-
ception, however the term closure is what Bregman focuses on.
In a visual representation where information/evidence is missing,
and the overall shape is not strong, then the overall representa-
tion is hard to perceptually resolve. However, when the missing
evidence is occluded with an arbitrary shape, the overall represen-
tation is suddenly made obvious (or resolved). The foreign and
randomly-shaped occlusion perceptually completes the underly-
ing image into one display or stream of information. This can
be seen very clearly in one of his earlier papers [10]. Bregman Figure 2: A visual model of SS. Implementation is denoted by a
then presents the auditory equivalent arranged by Dannenbring dotted line and hollow arrow; dependency is denoted by a dotted
that compares a tonal glide interrupted by silence - or the Still- line and arrow
ness as Koffka referred to it with a tonal glide interrupted by short
broadband bursts [11]. The results are similar to those discovered A proposed visual model of this phenomenon is presented
by Gestalt psychologists whereby the unoccluded tonal glides fail above in figure 2 using the Unified Modeling Language (for its
to group as one stream. However, when they are connected by the practicality in moving towards eventual model codification). In ad-
broadband bursts, they stream as one and appear to continue on dition to the four above characteristics, loudness is also included
behind the tonal bursts. This sort of continuity provides an under- as a core determinant of stream segregation. These factors canThe 26th International Conference on Auditory Display (ICAD 2021) June 25 -28 2021, Virtual Conference
be described as attributes of the SS class. In other words, the SS without a comprehensive background in auditory perception. As
class and whether it streams or segregates depends on these fac- such, concepts that may appear obvious to sonification practition-
tors. Allocation is the fundamental role of SS and can be assigned ers through experience or expertise are still addressed.
as a method of the SS class. The attributes and methods of al- The aim of the web guide is to enable designers to input what
location can be illustrated further as an interface (denoted by a auditory parameters they intend to use and get in return construc-
circle) that is implemented (or realized) by the SS class. The at- tive feedback. Specific to their application, this feedback would
tributes include the number of concurrent sources, the number of highlight what perceptual concerns the designer needs to be aware
sequential sources, and the similarity between the auditory charac- of according to the PerCS framework. An interactive and dynamic
teristics of sources. The methods (or operations) of the allocation web guide with helpful visualizations is feasible using three core
interface include streaming (fusion) and segregation. In addition web-based programming languages: HTML, CSS, and JavaScript,
to the SS class and its implemented interface Allocation, are the alongside a few external JavaScript-based APIs. The Web Audio
classes Working Memory and Attention. As denoted by the dotted API, for example, is a tool that can be used to present auditory ex-
line and arrow, the Allocation interface is also dependent on these amples of ASA phenomena such as belongingness and streaming.
classes, however, these are not the focus of this paper. The aim Such examples aim to provide designers with an immediate un-
of the web guide is to identify and unpack what the Allocation in- derstanding of why an awareness of these phenomena is important
terfaces attributes and methods are dependent on (spatial location, when designing a sonification application with multiple auditory
frequency content, temporal characteristics, and loudness), and ex- dimensions. In addition to this auditory component, interactions
amine how they might be relevant to sonification design strategies. also include visual aids to further help designers understand the
This is reflected below in a second visual model. phenomena outlined by PerCS. These visual aids are designed us-
ing Three.js, a JavaScript 3D library.
In its current form, the interactive audio-visual web guide is
a concise incorporation of the PerCS framework as outlined in
the previous section. The current iteration of the application is
built using the typical web-programming tools mentioned above
(HTML, CSS, JavaScript, JQuery) in conjunction with the Web
Audio API and Three.js. The web guide is hosted using Google
Firebase, a web and mobile app development platform backed by
Google, Inc. As of the writing of this document, the PerCS web
guide is accessible via the domain sonification.ie or sonification-
asa.firebaseapp.com/. A Github repository is also available at
github.com/JoeFitzpatrick/PerCS, where the code can be reviewed
in its entirety, including the code used to present auditory phenom-
ena as audio-visual interactions.
On the home page, the user is presented with the overall aims
of the PerCS Guidelines as well as the visual models of sonifi-
cation design and stream segregation (presented in a slideshow).
These visual models provide a brief insight into how sonifica-
tion mapping strategies are directly linked to the determinants of
stream segregation as outlined in figure 3.2. This introductory page
Figure 3: A visual representation of mapping-factor dependencies. also explains that the PerCS guidelines are complimentary to pre-
Dependency is denoted by a dotted line and arrow. Note all map- existing sonification techniques and practices. Lastly, this intro-
pings are affected by Frequency Content and Temporal Character- duction notes that while the guidelines are helpful to those imple-
istics menting artistic sonification; they are most relevant to designers
of more practical or scientific applications/displays. The guideline
In this visual model, the core determinants of stream segre- modules themselves are found on another page that is easily nav-
gation are linked to common sonification mapping strategies [1]. igated to from each page via the menu-bar at the top of the page
An extensive review of each determinant (displayed as classes in (Guidelines). These guidelines are broken down into five modules:
figure 3) and how they relate to sonification methods was recently Frequency and Spectral Content, Loudness, Spatial Content, and
completed as part of an ongoing PhD thesis. However, this re- Multimodal Applications as seen below in figure 4.
search in its text format simply adds to the ever-accumulating body The source material for these modules includes the authors
of sonification literature. In order to make the research more palat- PhD research as well as audio-visual interactions that aim to en-
able to aspiring sonification practitioners, a web guide that high- hance the users understanding of the content. In addition, there
lights the most prevalent points was designed. are a number of links to other online tools that may be of use to
the user. The language in these sections remains largely academic,
4. THE WEB GUIDE however, deviates a little from this form to be more user-friendly.
In terms of referencing sources, the modules follow the Harvard
HCI research suggests that interaction has a powerful impact on Referencing System and references can be found at the bottom of
how humans learn and absorb information [13] [14] [15]. With this this page or on the References page. The most important module
in mind, the author introduces the development of a web-based in- of the guidelines is the Frequency and Spectral Content module, as
teractive PerCS guide, that utilizes the Web Audio API. The guide it is relevant to virtually all sonification applications and auditory
is designed to be accessible to aspiring sonification practitioners displays regardless of the technique or strategy implemented. ItThe 26th International Conference on Auditory Display (ICAD 2021) June 25 -28 2021, Virtual Conference
this interaction, however, is to show that using multiple pure tones
for data variables that need to be individually distinguishable in
applications such as auditory graphs can be problematic.
The second interaction shown in figure 5 is a simple interactive
audio-visual example of temporal groupings where tones percep-
tually group because of how close they are to each other (tempo-
rally). Once again, the tone sequence is started by clicking and
holding the left mouse click. Within this interaction there is a
toggle in the top left that can be toggled on with the left mouse
click or by pressing the tab key followed by the spacebar (stan-
dard browser tab-selecting). This toggle allows the user to con-
trast the temporally-paired tones with temporally-unpaired tones.
The visual element of this interaction borrows from Koffkas visual
example of belongingness depicted earlier in figure 1. In this in-
teraction, the ’stillness’ or ever-present noise-level is represented
by noise.
Figure 4: Screenshot of the guideline modules on the PerCS Web
Guide
is, as such, the most content-heavy and where all the audio-visual
examples are found. These interactions are here to help the design-
ers understand how the perceptual phenomena discussed occur and
how they might relate to sonification design.
The Your Design page simply asks what auditory parameters
the designer intends to use and whether there is more than one
modality being used. Using this information, the interactive web
guide only brings up the relevant PerCS guideline modules. This
page also gives brief examples of what is meant by mapping-pairs
in the form of three tables. For example, it explains that a dis- Figure 5: Audio-visual interaction demonstrating belongingness
play where temperature is mapped to a pure tone, and humidity is
mapped to a square tone, is utilizing pitch and timbre. An applica- The third interaction shown in figure 6 is an audio-visual tool
tion where the location of a clock hand is mapped to a horizontal that demonstrates the effects of various presentation rates. The
L/R location (panning value) is using space. The last example is cursor’s location on the x-axis dictates the starting frequency. The
if the height of a wave is mapped to amplitude, then the display is cursor’s location on the y-axis dictates the tone-sequences tempo.
using loudness. In this interaction, the toggle in the top left allows the user to loop
the predefined tone sequence, which is recommended when listen-
5. AUDIO-VISUAL INTERACTIONS ing for apparent frequency groupings. The users are instructed to
start by listening to the sequence at a lower tempo first, where the
At this point in time, the PerCS web guide includes four audio- order of the notes should be easily perceived, and then to try a
visual interactions that can all be found in the Frequency and Spec- faster tempo. It is at the higher speeds that they are instructed to
tral Content module - a module that is suggested as relevant to all listen for any frequency groupings. This interaction also shows the
sonification applications. As mentioned, the interactions were de- link between the visual phenomenon apparent motion and auditory
signed using HTML, CSS, JavaScript and two additional APIs: grouping.
Three.js and Web Audio. The URL links to these interactions
are made noticeable using GIFs that preview the functionality of
each one. All the interactions can be experienced here: sonifica-
tion.ie/resources.html under the Frequency and Spectral Content
module (that provides the necessary context) or under the Audio
Visual Interactions module (https://sonification.ie/resources.html).
The first interaction is a two-channel audio-visual example
that demonstrates ’streaming’. All the interactions are triggered
by clicking and holding the left mouse click. In this interaction,
the cursor is used to change the pitch of the left channel and can
be moved along the x-axis towards, away or beyond the middle
line where the right channel plays at around 1kHz. Two channels Figure 6: An audio-visual interaction that enables users to experi-
are used in this interaction to avoid demonstrating phasing and in- ence the effects of varying presentation rates on frequency group-
stead demonstrate how two streams can still perceptually merge ings
as one despite being binaurally separated. This is a consequence
of binaural fusion and perceived pitch, which are discussed in the The last interaction shown in figure 7 is an audio-visual tool
spatial location module of the web guide. The main purpose of that can be used to demonstrate the streaming effect apparent inThe 26th International Conference on Auditory Display (ICAD 2021) June 25 -28 2021, Virtual Conference
concurrently sonified data-streams, as well as the use of a saw- As shown in figure 8, most of the participants found the web
tooth wave to focus or isolate a particular trend. Each channel guide easy to navigate, suggesting that the overall layout and de-
can be toggled on or off using the toggles at the top of the dis- sign of the website doesnt require additional work. In relation to
play. Each colored channel may also be ’focused’ - i.e. converted how relevant the research content of the site is to sonification, the
from a sine wave to a sawtooth wave. The users can also refresh majority of participants again responded positively. There is, how-
the page (CMD/Ctrl-Shift-R) to randomize the data points on the ever, room for improvement; perhaps by relating the auditory per-
graph. Users can also test their ability to isolate and identify the ception research more directly to sonification mapping strategies
focused trend by clicking the top right box in the display. This or by providing specific examples. Figure 9 displays the partici-
separate interaction lets them guess which trend is isolated before pants Likert responses to two questions that aim to draw out qual-
providing the answer. itative feedback on the audio-visual interactions specifically. Like
the last pair of questions it pertains to the accessibility of the inter-
actions and their relevance to sonification.
Figure 7: An audio-visual interaction that enables users to listen to
concurrently sonified trends and isolate particular trends
It is worth noting here that this interaction is provided along- Figure 9: Likert responses to questions regarding the accessibility
side research that shows that the first four harmonics of a sawtooth and relevance of the audio-visual interactions
wave are more than enough to isolate a trend [16]. A note in the in-
struction box clarifies that the sawtooth wave in this interaction is Although these preliminary responses remain positive, partic-
not simply the first four harmonics of a tone, however, but is sim- ipants found the interactions less accessible than the other writ-
ply used to demonstrate one way of segregating sonified streams. ten and visual content of the web guide overall. This response
is somewhat expected as the interactions require more engage-
ment and understanding of the context in which the interactions
6. PRELIMINARY FEEDBACK are found. This result might be improved with more detailed in-
structions on how to engage with the interactions or by adding
In order to collect feedback on the PerCS web guide, a short instructional video demonstrations. Although no technical issues
Google Forms survey was added under the Survey page of the were specified with these responses, browser-version compatibil-
website. In addition, the survey and web guide were circulated ity with the Web Audio API or Three.js may also be related. As
via a number of email lists, including both the International Con- seen by the Likert response to the second question, the majority of
ference on Auditory Displays list and the more wide-reaching Au- participants were again satisfied with how relevant the audio-visual
ditory List (initially started by Albert Bregman in 1992 and now interactions were to sonification. This preliminary result suggests
maintained by Dan Ellis). The following results are from twelve that the context provided sufficiently explains how the interactions
participants who claimed to be familiar with sonification practices. pertain to sonification practices.
Two questions included in the survey ask how accessible the over- The last part of the survey gives the participants a chance to
all guide is and how relevant they think the written content and suggest further research they think might be relevant to PerCS,
figures are to sonification practices. Participants were provided a while the last question looks for suggestions for other potential
five-point Likert scale to respond. audio-visual interactions that relate to sonification and auditory
perception:
• What research relevant to auditory perception and sonifica-
tion is missing from this web guide?
• Can you suggest any other potential audio-visual examples
or interactions that relate to auditory perception and are rel-
evant to the design of auditory displays?
In response, several participants suggested incorporating
music-perception research as they have found such research ben-
efits auditory display design just as much as traditional auditory
perception research. In particular, it was proposed that research
regarding timbre perception in music and the work of McAdams
Figure 8: Likert responses to questions on the web guides accessi- and his colleagues might significantly contribute to the PerCS web
bility and content relevance guide [17] [18] [19]. While the web guide does include some ofThe 26th International Conference on Auditory Display (ICAD 2021) June 25 -28 2021, Virtual Conference
this research (under the Frequency & Time module), a more com- mation to designers using written, visual, and audio feedback. The
prehensive collection of works relating to music perception as a survey outlined in the previous section is still available on the web-
whole might identify potentially relevant information to aid soni- site (https://sonification.ie) and will continue to collate feedback
fication design. on the web guide for future analysis. Early qualitative results are
Other suggestions included providing an independent module sparse, yet promising, and have included helpful suggestions for
within the guide that highlights audio evaluation strategies and future iterations. In summary, the core components of future work
tools that are currently available online. Furthermore, it was pro- on PerCS will include further examination and implementation of
posed that a brief review of each and their core strengths in relation music perception research and the integration of auditory scene
to sonification design would be a useful and relevant asset within synthesis functions supported by the PerCS guidelines.
the PerCS web guide. More specifically, it was suggested that a The next phase of this research is to expand on and review the
review that identified and outlined which evaluation approaches overall Perceptually Congruent Sonification framework as well as
were best for certain sonification would be invaluable. ascertain more background information on how perceptual con-
In relation to potentially helpful audio-visual interactions, one flicts are considered in current sonification projects. This will be
participant suggested that including interactive examples and ex- in the form of a systematic review of such considerations and will
planations of more classic ambiguities and illusions might expose include feedback from the practitioners on how they self-evaluated
some useful information for sonification practitioners. Examples their design. The ultimate aim of this phase will be to identify what
in their suggestion included the McGurk Effect, Shepard tones, aspects of auditory perception are largely unaccounted for in com-
and the Tritone Paradox. Such examples are similar to the audi- mon sonification designs and how relevant practitioners believe
tory illusions presented by Diana Deutsch [20] [21]. Additional such information to be.
research that reviews and explains such illusions might indeed be
a useful addition to the web guide, perhaps again in its own sepa- 8. REFERENCES
rate independent module.
Beyond the survey, a number of suggestions and comments [1] G. Dubus and R. Bresin, “A systematic review of mapping
were made by sonification practitioners and researchers via email. strategies for the sonification of physical quantities,” PloS
One suggested including more information on the role of the spec- one, vol. 8, no. 12, p. e82491, 2013.
tral centroid in timbre perception as it is a relatively easy-to-
[2] A. Supper, “Sublime frequencies: The construction of sub-
manipulate auditory parameter that can be mapped in auditory dis-
lime listening experiences in the sonification of scientific
plays. Such research is included in the web guide to a certain ex-
data,” Social Studies of Science, vol. 44, no. 1, pp. 34–58,
tent, however this could be more comprehensively discussed in
2014.
relation to sonification design.
In addition to feedback regarding the current iteration of the [3] M. Quinton, I. McGregor, and D. Benyon, “Investigating ef-
web guide, some researchers offered advice on the future direc- fective methods of designing sonifications,” in Proc. ICAD.
tion of the project. In their emails they proposed the next logical Georgia Institute of Technology, 2018.
step from PerCS (and other similar research) might be to incorpo- [4] J. Ferguson and S. A. Brewster, “Evaluation of psychoacous-
rate functions and models of such research directly into synthesis tic sound parameters for sonification,” in Proceedings of the
software solutions under the banner of Auditory Scene Synthesis. 19th ACM International Conference on Multimodal Interac-
They add that the early groundwork for justifying and implement- tion, 2017, pp. 120–127.
ing Auditory Scene Synthesis in future sonification projects has al-
[5] S. Chabot and J. Braasch, “A framework for evaluating per-
ready been proposed and might benefit from further development
ceptual interactions of various dimensions of sound for data
[22]. The SoniPy framework, for example, is an early example of
sonifications,” The Journal of the Acoustical Society of Amer-
Auditory Scene Synthesis being applied [23].
ica, vol. 143, no. 3, pp. 1750–1750, 2018.
[6] S. Roddy and B. Bridges, “Mapping for meaning: the em-
7. FUTURE WORK bodied sonification listening model and its implications for
the mapping problem in sonic information design,” Journal
The overall objective of the PerCS framework is to encourage de- on Multimodal User Interfaces, vol. 14, no. 2, pp. 143–151,
velopers in sonification design to more heavily consider and dis- 2020.
cuss prevalent phenomena in auditory perception. The web guide
aims to facilitate not just experienced practitioners but also data [7] S. Barrass, “Sonic information design,” Journal of Sonic
analysts without a strong background in sound who still want to Studies, vol. 17, 2018.
pursue sonification as a means of data exploration. More specifi- [8] A. S. Bregman, Auditory scene analysis: The perceptual or-
cally, it proposes using ASA principles to further investigate such ganization of sound. MIT press, 1994.
phenomena (like SS) that are relevant when designing robust audi- [9] K. Koffka, “Perception: an introduction to the gestalt-
tory displays. The aim is that if more publications relating to soni- theorie.” Psychological Bulletin, vol. 19, no. 10, p. 531,
fication share how practitioners tackle the phenomena highlighted 1922.
by the PerCS framework, the robustness of all future auditory dis-
plays can improve. Additionally, if the sonification community ap- [10] A. S. Bregman, “Asking the what for question in auditory
pears to be supportive of such principles, the idea of using sound perception,” Perceptual organization, pp. 99–118, 1981.
to relay data might be more broadly accepted. [11] G. L. Dannenbring, “Perceived auditory continuity with al-
In its current state, the interactive web guide aims to make ternately rising and falling frequency transitions.” Canadian
the overall perceptually congruent sonification framework more Journal of Psychology/Revue canadienne de psychologie,
accessible by supplying only pertinent research-supported infor- vol. 30, no. 2, p. 99, 1976.The 26th International Conference on Auditory Display (ICAD 2021) June 25 -28 2021, Virtual Conference
[12] A. Bregman. (1996) Demonstrations of auditory scene
analysis: The perceptual organization of sound. [Online].
Available: http://webpages.mcgill.ca/staff/Group2/abregm1/
web/downloadstoc.htm
[13] E. Gaudioso and J. G. Boticario, “Towards web-based adap-
tive learning communities,” in Proceedings of the 11th Inter-
national Conference on Artificial Intelligence in Education
(AIED2003). Sidney, Australia, 2003.
[14] S. Polovina and W. Pearson, “Communication+ dynamic in-
terface= better user experience,” in End-User Computing:
Concepts, Methodologies, Tools, and Applications. IGI
Global, 2008, pp. 419–426.
[15] G. Stahl, Essays in computer-supported collaborative learn-
ing. Lulu. com, 2017, vol. 9.
[16] J. Fitzpatrick and F. Neff, “Stream segregation: Utilizing har-
monic variance in auditory graphs,” Proceedings of SMC,
vol. 18, 2018.
[17] A. Caclin, S. McAdams, B. K. Smith, and S. Winsberg,
“Acoustic correlates of timbre space dimensions: A con-
firmatory study using synthetic tones,” The Journal of the
Acoustical Society of America, vol. 118, no. 1, pp. 471–482,
2005.
[18] G. Peeters, B. L. Giordano, P. Susini, N. Misdariis, and
S. McAdams, “The timbre toolbox: Extracting audio de-
scriptors from musical signals,” The Journal of the Acousti-
cal Society of America, vol. 130, no. 5, pp. 2902–2916, 2011.
[19] S. McAdams, “Musical timbre perception,” The psychology
of music, pp. 35–67, 2013.
[20] D. Deutsch, “The octave illusion revisited again.” Journal
of Experimental Psychology: Human Perception and Perfor-
mance, vol. 30, no. 2, p. 355, 2004.
[21] ——, “Illusions and research.” Authors Website, 2004.
[Online]. Available: http://deutsch.ucsd.edu/psychology/
pages.php?i=201
[22] D. Worrall, “The sonipy framework: Getting started,” in
Sonification Design. Springer, 2019, pp. 181–211.
[23] D. Worrall, M. Bylstra, S. Barrass, and R. Dean, “Sonipy:
The design of an extendable software framework for sonifi-
cation research and auditory display,” in Proc. ICAD, 2007.You can also read