Actuarial Weather Extremes: Hurricane Laura - August 2020 - soa
←
→
Page content transcription
If your browser does not render page correctly, please read the page content below
Actuarial Weather Extremes:
 Hurricane Laura

August 2020
2

Report Actuarial Weather Extremes:
Hurricane Laura
Coastal Wind, Storm Surge, Precipitation and Inland Flooding

AUTHORS                 Patrick Wiese, ASA
                        Rob Montgomery, ASA, MAAA, FLMI
                        Society of Actuaries

Caveat and Disclaimer
This study is published by the Society of Actuaries (SOA) and contains information from a variety of sources. The study is for informational purposes only
and should not be construed as professional or financial advice. The SOA does not recommend or endorse any particular use of the information provided
in this study. The opinions expressed and conclusions reached by the authors are their own and do not represent any official position or opinion of the
Society of Actuaries or its members .The SOA makes no warranty, express or implied, or representation whatsoever and assumes no liability in connection
with the use or misuse of this study.

Copyright © 2020 by the Society of Actuaries. All rights reserved.

                                                                                                                  Copyright © 2020 Society of Actuaries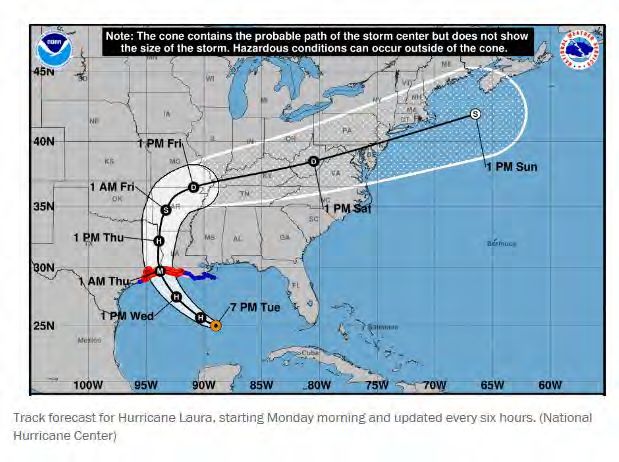
3

Overview
This report examines weather extremes in precipitation, maximum water level, wind speed, and flooding associated
with the time period and geographic area of Hurricane Laura over the period of August 24 to August 29, 2020.

Data was collected from the Global Historical Climatology Network (GHCN) for precipitation data, National Oceanic
and Atmospheric Administration (NOAA) coastal weather stations for water level and wind data, and from the US
Geological Survey (USGS) for inland flooding data.
Coastal water levels rose, wind speeds increased significantly, and inland flooding occurred as seen in the six-day
period (August 24–29, 2020) leading up to and during tropical cyclone Laura. (Figures 1-3)
The GHCN stations recording significant rainfall are shown for each day in August 25-29 (Figure 5) and show how the
actual rainfall tracks along versus the projected path of the storm (Figure 4) during that period.
According to its press release, data analysis firm CoreLogic estimated between $8 Billion to $12 Billion in insured
losses from Hurricane Laura wind and storm surge and described Hurricane Laura as “… the most intense hurricane
to make landfall in the northwestern Gulf Coast since 1856….”1

1CoreLogic. (2020, August 28). “CoreLogic Estimates $8 Billion to $12 Billion in Insured Losses From Hurricane Laura Wind and Storm Surge.” Press Release.
https://www.corelogic.com/news/corelogic-estimates-8-billion-to-12-billion-in-insured-losses-from-hurricane-laura-wind-and-storm-surge.aspx.

                                                                                                                       Copyright © 2020 Society of Actuaries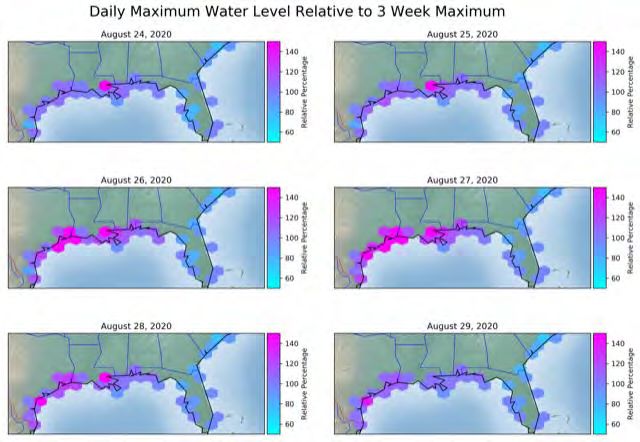
4

Water Level
Figure 1 presents NOAA Coastal Station Data showing the daily maximum water level relative to the average of
maximum water levels over the period August 1–21, 2020. As Hurricane Laura approached the coastline we can see
that the daily maximum water level rose to a peak corresponding to the late August 26 / early August 27 timeframe
of the storm approaching the coast.

Figure 1
DAILY MAXIMUM WATER LEVEL RELATIVE TO 3-WEEK MAXIMUM

Source: Center for Operational Oceanographic Products and Services. “NOAA Tides & Currents CO-OPS API URL Builder.” (Accessed
August 30, 2020). https://tidesandcurrents.noaa.gov/api-helper/url-generator.html.

                                                                                                     Copyright © 2020 Society of Actuaries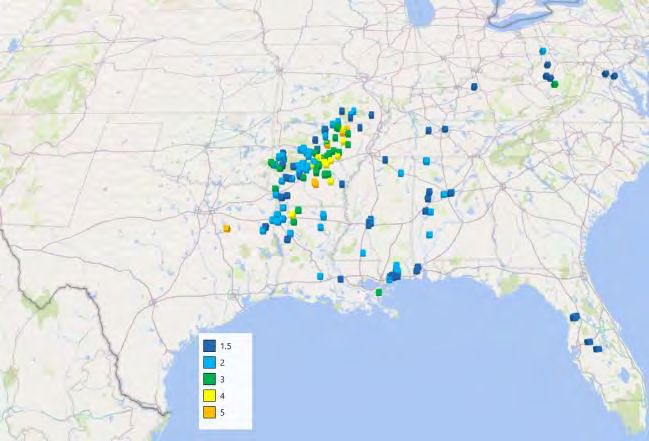
5

Wind Speed
NOAA Coastal Stations daily maximum wind speed in knots (1 knot = 1.15078 miles per hour). We can see in Figure 2
that the coastal wind speeds were highest in the days associated with the hurricane approaching land and making
landfall (August 26/27).

Figure 2
DAILY MAXIMUM WIND SPEED

Source: Center for Operational Oceanographic Products and Services. “NOAA Tides & Currents CO-OPS API URL Builder.” (Accessed
August 30, 2020). https://tidesandcurrents.noaa.gov/api-helper/url-generator.html.

                                                                                                     Copyright © 2020 Society of Actuaries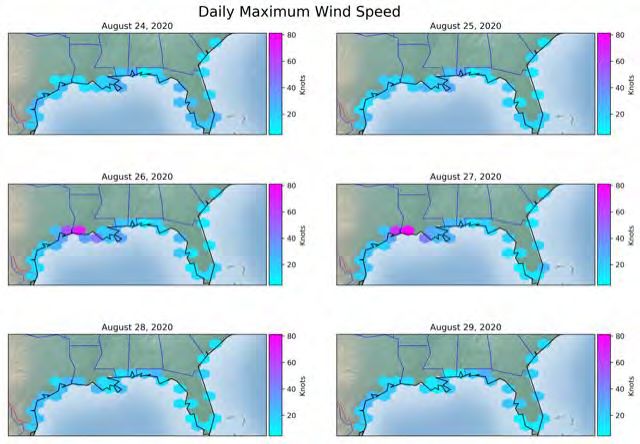
6
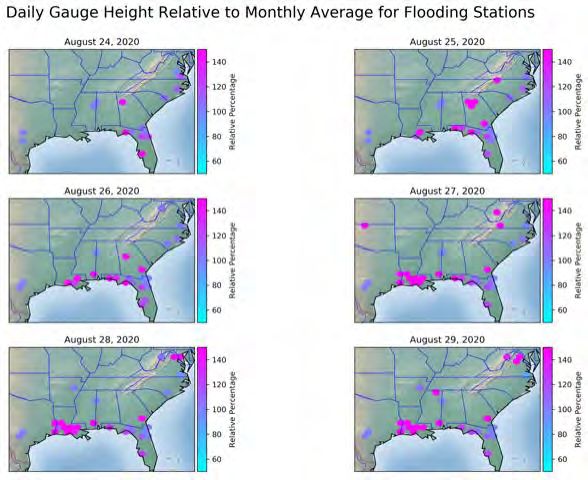
Flooding
In Figure 3, we see the USGS Stream Gauge stations which are at or above flood (mitigation) Action Stage, and the
percentage of the average gauge height value on the given day vs the August 2020 average value gauge height.
Figure 3
DAILY GAUGE HEIGHT RELATIVE TO MONTHLY AVERAGE FOR FLOODING STATIONS
Source: United States Geological Survey. “USGS Instantaneous Values REST Web Service URL Generation Tool.” (Accessed August 30,
2020). https://waterservices.usgs.gov/rest/IV-Test-Tool.html.
Copyright © 2020 Society of Actuaries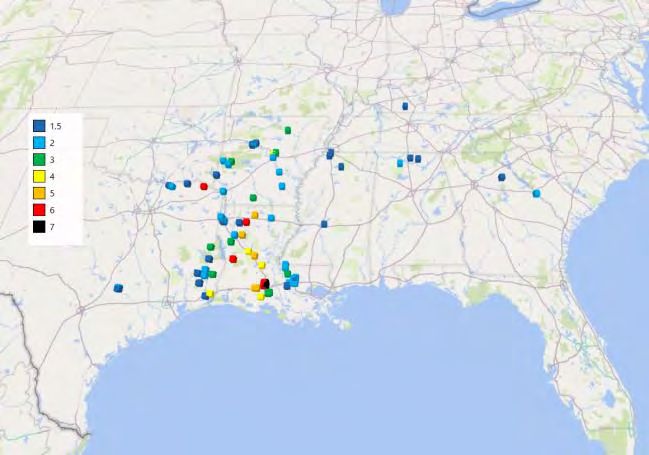
7

Hurricane Track
The National Hurricane Center projected the track of Hurricane Laura (Figure 4).

Figure 4
PROJECTED TRACK OF HURRICANE LAURA FROM TUESDAY, AUGUST 25, 2020

Source: The Washington Post. (2020, August 27).“National Hurricane Center Nailed Track Forecast for Laura Within a Mile and 3 Days in
Advance.” https://www.washingtonpost.com/weather/2020/08/27/national-hurricane-center-forecast-laura/.

                                                                                                        Copyright © 2020 Society of Actuaries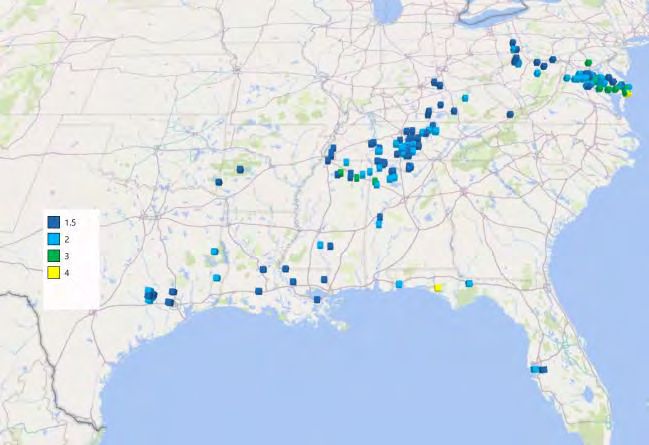
8

Rainfall
Figure 5 shows stations for which each daily precipitation total is at least 1.5 inches over the period August 25–29,
2020. Color codes represent at or above the indicated inches of rainfall for the day.

Figure 5
STATIONS WITH AT LEAST 1.5 INCHES OF DAILY PRECIPITATION, AUGUST 25–29, 2020

AUGUST 25                                                         AUGUST 26

AUGUST 27                                                         AUGUST 28

AUGUST 29                                                         KEY FOR GHCN RAIN TOTALS
                                                                    Daily total is at or above the indicated color in inches.

Source: GHNC station data (Accessed August 31, 2020). ftp://ftp.ncdc.noaa.gov/pub/data/ghcn/daily/ghcnd_all.tar.gz

                                                                                                       Copyright © 2020 Society of Actuaries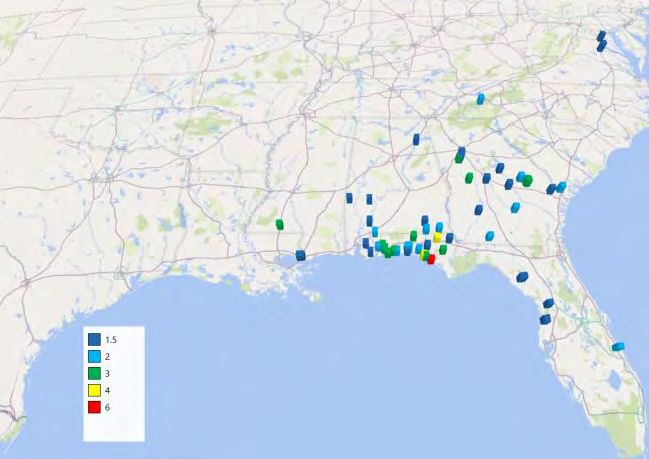
9
Rough Assessment of the Losses Caused by Recent Extreme Weather
Economic and insured losses are often difficult to estimate in the immediate aftermath of an extreme weather
event. With the passage of time, the extent of the losses gradually becomes clearer. The Lafayette (Louisiana) Daily
Advertiser provided an early estimate of August 2020 wind and storm surge damage in Louisiana and Texas:
“Hurricane Laura caused as much as $12 billion in wind and surge damage to more than 500,000 insured residential
and commercial properties, according to property data analysis firm CoreLogic. The vast majority of property
damage occurred in southwest Louisiana, where Laura made landfall early Thursday as a Category 4 hurricane with
150 mph winds. The majority of the residential and commercial insured property losses were due to wind and storm
surge, according to CoreLogic's post-landfall estimates. Louisiana's estimated damage ranges from $8 and $12
billion, while Texas was estimated at $550 million.”2
Data
The precipitation data used in this report was obtained from the Global Historical Climatology Network (“GHCN”)
weather database, which provides daily weather observations from over 100,000 weather stations worldwide,
covering over 180 countries. The database is publicly available through the National Oceanic and Atmospheric
Administration (NOAA) via the following FTP site:
ftp://ftp.ncdc.noaa.gov/pub/data/ghcn/daily/ghcnd_all.tar.gz
Filename: ghcnd_all.tar.gz
The online documentation for the GHCN dataset does not indicate whether the precipitation field contains, in
addition to rainfall, the liquid-equivalent for other forms of precipitation such as snow and sleet. Therefore, for a
random sample of several hundred stations, we compared daily precipitation data against daily snowfall data. We
found that, without any exceptions, the precipitation data field captures both rainfall and the liquid-equivalent
amount of snowfall.
Coastal Stations data could be verified here https://tidesandcurrents.noaa.gov/api-helper/url-generator.html by
entering the Station ID, the Product and the Date. The Datum is STND, the time zone is LST/LDT, and the units are
English. Results can be output as a .CSV file.
USGS Stations data could be verified here https://waterservices.usgs.gov/rest/IV-Test-Tool.html by entering the
Station ID, Start Date and End Date. The Parameter Code for Gauge Height is 00065.
Flood Stage information is from https://waterwatch.usgs.gov/webservices/floodstage?format=csv®ion=ALL.
Acknowledgments
The authors wish to thank Matthew Self, ASA for his contributions to the assimilation of coastal and inland station
hurricane data that the author’s used for this analysis.
2 Dodge, Victoria.(2020, August 31). “Hurricane Laura: Louisiana’s Insured Property Damage Ranges from $8 Billion to $12 Billion.” Lafayette Daily
Advertiser. https://www.theadvertiser.com/story/news/local/louisiana/2020/08/31/hurricane-laura-damage-estimates-up-12-billion-insured-
losses/5657746002/.
Copyright © 2020 Society of Actuaries10
About The Society of Actuaries
With roots dating back to 1889, the Society of Actuaries (SOA) is the world’s largest actuarial professional
organizations with more than 31,000 members. Through research and education, the SOA’s mission is to advance
actuarial knowledge and to enhance the ability of actuaries to provide expert advice and relevant solutions for
financial, business and societal challenges. The SOA’s vision is for actuaries to be the leading professionals in the
measurement and management of risk.
The SOA supports actuaries and advances knowledge through research and education. As part of its work, the SOA
seeks to inform public policy development and public understanding through research. The SOA aspires to be a
trusted source of objective, data-driven research and analysis with an actuarial perspective for its members,
industry, policymakers and the public. This distinct perspective comes from the SOA as an association of actuaries,
who have a rigorous formal education and direct experience as practitioners as they perform applied research. The
SOA also welcomes the opportunity to partner with other organizations in our work where appropriate.
The SOA has a history of working with public policymakers and regulators in developing historical experience studies
and projection techniques as well as individual reports on health care, retirement and other topics. The SOA’s
research is intended to aid the work of policymakers and regulators and follow certain core principles:
Objectivity: The SOA’s research informs and provides analysis that can be relied upon by other individuals or
organizations involved in public policy discussions. The SOA does not take advocacy positions or lobby specific policy
proposals.
Quality: The SOA aspires to the highest ethical and quality standards in all of its research and analysis. Our research
process is overseen by experienced actuaries and nonactuaries from a range of industry sectors and organizations. A
rigorous peer-review process ensures the quality and integrity of our work.
Relevance: The SOA provides timely research on public policy issues. Our research advances actuarial knowledge
while providing critical insights on key policy issues, and thereby provides value to stakeholders and decision
makers.
Quantification: The SOA leverages the diverse skill sets of actuaries to provide research and findings that are driven
by the best available data and methods. Actuaries use detailed modeling to analyze financial risk and provide
distinct insight and quantification. Further, actuarial standards require transparency and the disclosure of the
assumptions and analytic approach underlying the work.
Society of Actuaries
475 N. Martingale Road, Suite 600
Schaumburg, Illinois 60173
www.SOA.org
Copyright © 2020 Society of ActuariesYou can also read