Advances in the Restoration of Buildings with LIDAR Technology and 3D Reconstruction: Forged and Vaults of the Refectory of Santo Domingo de ...
←
→
Page content transcription
If your browser does not render page correctly, please read the page content below
applied
              sciences
Article
Advances in the Restoration of Buildings with LIDAR
Technology and 3D Reconstruction: Forged and Vaults of the
Refectory of Santo Domingo de Orihuela (16th Century)
Pascual Saura-Gómez *, Yolanda Spairani-Berrio , Jose Antonio Huesca-Tortosa, Silvia Spairani-Berrio
and Carlos Rizo-Maestre

                                           Department of Architectural Constructions, University of Alicante, San Vicentede del Raspeig,
                                           03690 Alicante, Spain; yolanda.spairani@ua.es (Y.S.-B.); ja.huesca@ua.es (J.A.H.-T.); silvia.spairani@ua.es (S.S.-B.);
                                           carlosrm@ua.es (C.R.-M.)
                                           * Correspondence: pascual.saura@ua.es

                                           Abstract: This research presents a new intervention methodology on arches and vaults of a Renais-
                                           sance factory in the Colegio Santo Domingo de Orihuela (16th century) using 3D software LIDAR
                                           technology that verifies the execution process of the works studying the different charges states and
                                           structure behavior. This document aims to explain a working methodology in the monitoring of
                                           structural repair interventions in the architectural heritage, in the specific case of the replacement of
                                 traditional one-way timber joist frame slabs on structures of former, splay and groin arches between

                                           vaults. This involves the compilation and processing of two types of data: on the one hand, the
Citation: Saura-Gómez, P.;                 analysis of the different load states to which the intervention is exposed in its different phases: initial,
Spairani-Berrio, Y.; Huesca-Tortosa,
                                           dismantling of the different layers of traditional construction and replacement by the new structural
J.A.; Spairani-Berrio, S.; Rizo-Maestre,
                                           system; and, on the other hand, the graphic information provided by the photogrammetry techniques
C. Advances in the Restoration of
                                           used to dimension and define the spatial position of the structural elements that have historically
Buildings with LIDAR Technology
                                           resolved the covering of the architectural space in this type of Renaissance solution. The different
and 3D Reconstruction: Forged and
Vaults of the Refectory of Santo
                                           layers and demolished materials have been verified by analysing their constructive disposition,
Domingo de Orihuela (16th Century).        thicknesses, and dimensions of the elements that formed part of the initial construction system and
Appl. Sci. 2021, 11, 8541. https://        their own weights. In addition, the new construction systems used in the restoration project generate
doi.org/10.3390/app11188541                a state of loads similar to the existing one. The LIDAR technology used in the research process
                                           provides graphic data of the spatial position of the arches and vaults studied in the different states of
Academic Editors: Massimo Coli             the construction intervention. The point clouds obtained are analysed by taking as reference fixed
and Yoshi Iwasaki                          points (considered unalterable and infinitely rigid) of the refectory and the coordinates of the initial
                                           and final states are compared. The results show minimal variations between the two positions, which
Received: 3 August 2021
                                           justifies the goodness of the construction methods used and the structural safety obtained in the
Accepted: 31 August 2021
                                           complex. This methodology applied to arches and vaults in heritage architecture guarantees the
Published: 14 September 2021
                                           control and recording of the movements produced in the process.

Publisher’s Note: MDPI stays neutral
                                           Keywords: TLS; 3D photogrammetry; cultural heritage; restoration methodology; vaults restoration;
with regard to jurisdictional claims in
                                           LIDAR; BIM
published maps and institutional affil-
iations.

                                           1. Introduction

Copyright: © 2021 by the authors.
                                                The origins of the Colegio Santo Domingo de Orihuela date back to the Dominican
Licensee MDPI, Basel, Switzerland.
                                           Friars who had established themselves on the outskirts of the city and who promoted the
This article is an open access article
                                           foundation of a convent according to the papal dispensation of Pope Julius II in 1512 and
distributed under the terms and            royal decrees of King Ferdinand the Catholic, which were later ratified in 1528 by King
conditions of the Creative Commons         Charles I. From 1546 onwards, the Bishop of Lérida, Don Fernando de Loazes, decided to
Attribution (CC BY) license (https://      build a College for the training of religious and lay people, according to the Order’s act
creativecommons.org/licenses/by/           celebrated in Rome "aceptamost in provincia Aragoniae Collegium a Rmo. Illerdensi episcopo
4.0/).                                     erigendum in conventu Oriolae, et donationem ejux juxta decretum Rdi. Provincialis cui in his

Applied Sciences 2021, 11, 8541. https://doi.org/10.3390/app11188541                                                https://www.mdpi.com/journal/applsci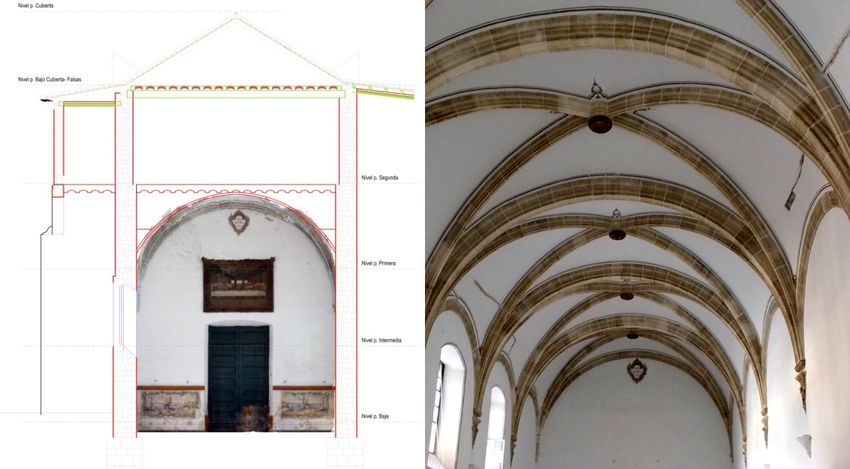
Applied Sciences 2021, 11, 8541                                                                                            2 of 20

                                  nostram committimus facultatem". The papal bull of 26 September 1562 of Pope Julius III
                                  approves the foundation, endowment, and erection of the College of Our Lady of Succour
                                  and Patriarch Saint Joseph of Orihuela, with the privilege of a University that grants the
                                  academic validity of bachelor, licentiate, and doctorate degrees. The College and the
                                  Pontifical University coexisted until the Royal General and Public University was declared
                                  in 1655. The State declared it an Artistic Monument in 1864. In 1872, the Society of Jesus
                                  (Jesuits) was established and founded a High School which taught until 1956, and from
                                  then on the Bishopric of Orihuela took over and it became a Diocesan School and shares
                                  a University Seat with the University of Alicante from 1998 to the present day. It was
                                  declared a National Historic Monument in 1931 and later declared an Asset of Cultural
                                  Interest in the category of Monument according to the Valencian Heritage Law 4/1998.
                                        The Santo Domingo School in Orihuela is one of the most important 16th century
                                  architectural complexes in the Valencian Community, both for its layout and for the quality
                                  of its execution. Located between Adolfo Clavarana street and the city’s Sierra, it has a built
                                  surface area of 21,000 m2 . The building was designed by the architect Jerónimo Quijano
                                  in 1552 and 3 of the 4 parts of the original plans and "traces" have been preserved, with
                                  the area where the Refectory is located today being precisely missing. The architect Juan
                                  Inglés directed the works at Santo Domingo from 1566, after Quijano’s death, designing
                                  and building the famous staircase that forms part of the complex (Figure 1).

                                  Figure 1. Floor plan of Santo Domingo de Orihuela.

                                       We can highlight some of its architectural elements that define it spatially and formally
                                  as characteristic and singular of the complex: Main façade with a marked horizontality
                                  interrupted by the three access portals, Church façade (16th century) by Joan Inglés,
                                  Convent façade with the three classical orders, Baroque style University façade (early 18th
                                  century) by Pedro Juan Codoñer, Church of the Virgin (16th century), Bell Tower (18th
Applied Sciences 2021, 11, 8541 3 of 20
century) which replaces a Renaissance bell tower, Convent Cloister (early 17th century) by
Agustín Bernardino, Sacristy façade (late 16th century) by Joan Inglés, University Cloister
of Renaissance composition (1727–1737) by Francisco Raimundo and refectory.
The refectory of the college has changed over time, as the building grew and the
number of friars and students increased. The needs increased and so the surface area
destined for this use underwent successive changes. According to the historian Javier
Sánchez Portas, in 1591, payments are documented for the carving of stone for a new
refectory that seems to coincide with the current one of one hundred and forty-two palmos
(the unit of measurement used in the 16th century) in length and forty-four in width
(320 square metres).
The refectory is covered by a ribbed vault with semicircular arches that span the width
of the nave and former arches on both longitudinal walls. The north side is finished off with
a flared semicircular arch, with geometrical coffers in deviation. The refectory contains a
plinth of 18th century Valencian tiles (Manises) that must be protected as an element of
great value that forms part of this architectural space.
Work on the refectory may have been completed in 1595. However, the date of 1794
inscribed on the walls of the refectory casts doubt on the real date of execution of this
part of the college. This fact further justifies the need to document the restoration work,
and to learn about the different construction systems, rooms, and connections that have
materialised in the current state of the building.
In 2006, a conservation master plan was drawn up in which several phases of in-
tervention were established, giving priority to the parts of the complex with structural
damage. Among these urgent phases of action was the refectory, as it had structural
problems with cracks in the vaults and walls. The gabled roof over the upper rooms, built
on a wooden structure of par-hilera wood, was also very deteriorated, implying risks of
stability on the refectory space, as it resolves its covering, and, therefore, reinforces the
need for conservation.
The assessment of intervention needs in historical and heritage buildings requires
information and knowledge offered by the application of precise techniques for their reg-
istration, which is why it is common practice in the preliminary phase of data collection
in architectural restoration projects. Terrestrial laser scanner (TLS) [1,2] and photogram-
metry [3–7] are often used as they are techniques that allow the necessary graphic docu-
mentation to be obtained with great precision if used appropriately [8–10]. Each building
requires individualised treatment, so that, although the methodology is general, its specific
application in each case requires adaptation to the particular conditions of the architectural
element. In spaces covered with vaults, it is not possible to access the back of the vaults, so
the initial record is partially incomplete. However, metric and visual information is neces-
sary to determine the definition of the existing constructive elements: orthogonal graphic
views (plans, elevations, and sections), as well as volumetric perspectives are essential for
the initial constructive analyses, and for future intervention and maintenance projects. For
this reason, and in order to complete the graphic information, it is necessary to complete
the data collection during the restoration work in order to document the geometry and
construction systems of the building with reliable and quality results [11–15] (Figure 2).
1.1. State of the Art LIDAR and Photogrammetry
LIDAR surveying uses a laser beam to collect information. The technology works by
emitting lasers and measuring the time it takes for the light to return to the source. This
technique came into use in the 1990s and makes it possible to date the coordinates of the
analysed points with respect to the emitter. Photogrammetry collects data by analysing and
comparing multiple two-dimensional images (photographs) to create a three-dimensional
model. It is considered a passive sensor because it does not produce its own energy source
to collect information. Both LIDAR surveying and photogrammetry can be used to take
measurements and discern data. LIDAR creates a three-dimensional model through a
laser target. The scanning frequency and repetition rate will determine a point cloud.Applied Sciences 2021, 11, 8541 4 of 20
Photogrammetry produces a fully coloured 3D image by “stitching together” multiple 2D
photographs, although it may take thousands of photographs to obtain an accurate model.
In this work, data acquisition has been done by combining both techniques: laser scanning
and photogrammetry.
(a) (b)
Figure 2. The spatial distribution of arches and vaults in the refectory area. (a) the sketch of vertical cross-section (b) vaults
directional arrangement.
2. Methodology
All the data collected with the techniques described (LIDAR using TLS (terrestrial laser
scanner), and photogrammetry using SfM (structure from motion)) have been analysed
and processed with the Cyclone - Leica (Heerbrugg, Switzerland), 3DReshaper (Neyron,
France), and Cloudcompare (Paris, France) software and the plans obtained with CAD
programmes (Generic and free programmes), following the following methodology:
2.1. Analysis of Available Documentation
The analysis of the plans is carried out through the Basic and Execution Project of the
refectory and classrooms of the Diocesan College of Santo Domingo in Orihuela, as well as
the Master Plan of the Santo Domingo College, both documents drawn up by the architect
José Antonio Maciá Ruiz.
We encountered some difficulties in the process of reading the information because
the different plans have the limitations of data collection from ocular inspections in situ
and graphic representations in the views and plans made with CAD programmes [16,17].
The most conflictive situations arise in the definition of those construction elements
that are hidden in the walls, vaults, and floors, with evident doubts about the dimensions
and location of some systems and their possible injuries.
Historical analysis and knowledge of the different stages of construction that the
evolution of the building has undergone is important. For this reason, other sources of
information have also been analysed, such as the photographs of the historical school,
which are included in some publications, such as “The history of a dream, 50th Anniversary
of the Diocesan Management of Santo Domingo School (1956/57-2006/07)” or “Inmaculada-
Santo Domingo 20th Century” published by the Jesuit Alumni Association of Alicante,
which managed the school from 1867 to 1956.Applied Sciences 2021, 11, 8541 5 of 20
The maintenance and protection of built heritage implies a record of the known data
and its constant updating, recording all the modifications it has undergone throughout
its history. The purpose of this article is to contribute to the availability of adequate
information on the architectural construction and its chronological evolution, as well as the
actions carried out on a heritage asset with the aim of preserving it for the enjoyment of
future generations [18,19].
2.2. Description of the Works Defined in the Restoration Project
The main objective of the restoration work is to achieve structural stability and restore
both the refectory area on the ground floor and the upper space on the first floor to be used
as teaching workshops. The work is being carried out with the supervision and support of
a team of archaeologists whose mission is to record and date all the work, and to warn of
the importance and constructive decisions that could lead to possible discoveries in the
development of the different items to be carried out.
The following is a brief chronological description of the works as defined in the Project
and their implementation, reflecting the existing construction systems and the proposals
for other alternatives in the restoration process.
1. Prior to the start of the restoration work, unique elements, such as the 18th century
tile plinth, which is located around the perimeter of the base of the Refectory, and
the mural paintings found both at the head and foot of this single rectangular nave,
were protected;
2. Prior to the demolition work on the floor slabs resting on semicircular arches, false-
work has been installed to ensure the safety and stability of the vaults and arches;
3. The exterior wall of the refectory is stabilised and consolidated by injecting fluid
lime mortar. The existing cracks in the vaults and arches are sealed with special
lime mortar and some stitching is carried out with vitroresin rods. The CINTEC ST
system was used to tie the walls enclosing the refectory in order to ensure that the
separated parts were sewn together. The back of the vaults is reinforced by plastering
with PLANITOP HDM Restauro fibre-reinforced bicomponent mortar reinforced with
Mapei fibreglass mesh, guaranteeing their uniformity [20–24];
4. Subsequently, the new horizontal frameworks of the second floor (floor slab over
the refectory) with one-way floor slabs using laminated wood beams with a double
waterproof board beam and a compression layer of 8 cm thick lightened concrete,
reinforced with electro-welded mesh, were installed;
5. In the exterior lateral area, adjacent to the refectory, on the buttresses, there are
reinforced concrete joist-beam slabs built in situ. All of them are tied perimetrically by
means of reinforced concrete strapping and metal profiles, with the aim of organising
a perimeter framework tying all the floor slabs both on the arches and on the walls
that delimit it (Figures 3 and 4).
2.3. Use of Terrestrial Laser Scanner (TLS) and Structure from Motion (SfM) in the Monitoring of
Cultural Heritage Restoration Works
These techniques make it possible to take data on the geometric position of the surfaces
of all the elements that form part of architectural construction systems (cladding, masonry,
structures...) and of any of their materials (mortars, plaster, stone, ceramics...), knowing
their coordinates and offering the possibility of comparing them in the study processes.
In order to obtain a reliable action model, it has been necessary to collect new data in
the progress of the works and to compare the information available in the archives with
other more current information that served as the basis for the project. This information
makes it possible to document the process of the material execution of the construction
elements, and to evaluate their behaviour in the face of the different stresses to which they
are exposed.Applied Sciences 2021, 11, 8541 6 of 20
(a) (b) (c)
Figure 3. Construction process in the restoration. (a) Original slab floor with horizontal wood joists (b) Falsework for
stability guarantee in the works (c) the active vertical fracture along wall and vaults disturb stability of the study complex
that must be consolidated.
(a) (b)
Figure 4. (a): Slabs using laminated wood beams. (b): Joists-beam concrete slab built in situ.
With the idea of preserving the history of the building, a real geometry of the archaeo-
logical and architectural elements must be available, and, therefore, traditional measuring
tools, such as the flexometer, levels, and new techniques that provide us with a 3D point
cloud acquired from laser and photogrammetry, and that specify the shape and dimensions
of the existing materials and construction systems, have been used.
For the recording, study and monitoring of the vaults and arches of the refectory, in
the different stages analysed, and given their sometimes difficult accessibility, we have
opted for the use of digital tools. On the one hand, through the use of terrestrial light
detection and ranging technology [24] (LIDAR) using a high-precision laser scanner [25]
for data collection, its subsequent graphic survey and virtualisation in three dimensions
using the Cyclone, 3DReshaper, and Cloudcompare software [26], and the capture of
high-resolution images.Applied Sciences 2021, 11, 8541 7 of 20
The laser scanner used is a pulsed time-of-flight laser scanner, Leica ScanStation C10
model, which measures a laser beam generating a point cloud of the scanned element with
a maximum density of one point every 2 mm of distance, a complete field of vision of 360º
horizontally and 270º vertically, with a long range (up to 300 m).
On the other hand, SfM photogrammetry [27,28] is employed, with digital photog-
raphy by taking photographs using a Canon EOS 600D SLR camera with a Canon EF-S
18–55mm standard lens. The photographs were processed using Photoscan software and
metashape [29–34] (Figure 5 ).
Figure 5. Top axonometric view of the geometrical vaults arrangement.
Data collection with the Laica Scan Station C10 Laser Scanner was carried out at
different times, before the start of the works (2015) and after completion of the works
(2019), choosing a position centred in the Refectory on a tripod, so that the scanning
distances were, at most, of the order of 15 m. The intermediate state of the works was
recorded with six locations on different dates (2018 and 2019) given that the demolition and
reconstruction process took place in different phases, each one corresponding to each span
(five arches and six vaults). Similarly, and coinciding with the days on which it was scanned,
the state of the work was also recorded with the Canon 600D SLR digital camera. Using
the Cyclone Leica software for cloud recording and 3DReshaper for cloud analysis and
deformation control, the point cloud obtained from the different scans was processed, and
above all, the “Cloudcompare” software was used to analyse the data from the different
states of the work, taking certain characteristic points as a reference, and carrying out
verification tests so that the distances between them were constant in the stages compared.
After taking the data by means of on-site scanning, the point clouds and the images were
made compatible using Photoscan and Metashape software, in order to visualise them
using orthophotos, which can be scaled based on the measurements obtained from the
point cloud; in all cases, photogrammetric work was carried out in which each image
coincided at least 50% with the previous one, defining characteristic points (which remain
invariable throughout the construction process) in such a way that the key points can be
recognised from the image to the point cloud, obtaining all the graphic data that record
the process. Once the definitive positions of the compared point clouds had been defined,
and with the same reference coordinate system, the data were exported to AutoCAD files.
Finally, the data of the analysed points are transferred from Cloudcompare to AutoCAD,
showing the x, y coordinates of each of the compared points. The point cloud was divided
by means of strips parallel to the segmental arches to make a section on the axis of each ofApplied Sciences 2021, 11, 8541 8 of 20
them (Figure 6). The arches are made of limestone voussoirs whose surface is the result of
the original tilling work (without facing), so that the data obtained in the scan reflects small
irregularities resulting from the stone micro-grains that generate an envelope with small
jumps between the points (Figure 7). The process implies an error in the measurements
that can be estimated to be in the order of 2 mm (distance between the scanning points and
irregularities of the sectioned surface), so it can be considered acceptable as we are in a
range of measurements of less than 1/1000 of the span of the arc.
Figure 6. Strip corresponding to one arches studied with CloudCompare V2.10.1 software.
Figure 7. Graphic representation of standard arch coordinates points offered in Table 4 (a) the arch is
divided in 14 equidistant sections including the key (b) a point zoom of the lower arch path to obtain
the coordinates (x,y) with the AutoCad program.
2.4. Description of the Different Stages Considered in the Benchmarking Study
The use of these digital tools has been proposed for the documentation and monitoring
of the restoration process of the refectory [30] in 3 stages, analysing various points ofApplied Sciences 2021, 11, 8541 9 of 20
the cross-section of the transverse arches, and at the same time comparing the results
between the different spans analysed, so that the different points observed and the three
stages considered are different and comparable, from the initial state of the works to their
completion. To complete the study, an estimate is made of the state of loading of the
structure in each of the phases analysed [35].
Data were taken prior to the intervention using the point cloud provided by the
technique used, and the data are reflected in a graphic representation of different sections
that allow us to analyse both the dimensions of the different construction systems and the
deformations and displacements produced [14,36], in the arches-nerves as well as in the
vaulting-plementeries.
The information is completed with the load states in each of the stages, which give
us an idea of the stresses to which they are exposed and the response of the construction
solutions before, during and after the intervention.
• Stage 1 (2015): This is the phase of the studies prior to the restoration project with
the aim of preparing a diagnostic study; the building is scanned with a laser scanner
in order to graphically record the initial state of the construction elements prior
to the drafting of the project, prepare exact planimetries and, from the cloud of
points generated, study deformations, detect pathologies, and analyse the structural
behaviour that will allow us to hypothesise the situation of the building and the origin
of the damage observed.
In this pre-existing situation, the segmental arches have been subjected to the same
loads for more than 400 years, typical of the traditional construction system: the weight of
the arch itself, solid brick masonry, one-way wooden joist floor slabs with brick revolts and
floors laid with hydraulic mortar.
• Stage 2 (year 2018): During the restoration works, the different phases of the execution
of the project are scanned with a laser scanner, demolition of partitions and floors,
unloading of vaults... Any change or constructive and structural modification to
observe by comparison with the point cloud of phase 1, the changes that the vaults may
be suffering. In this phase, we obtain the record of the vaults’ backsides, allowing us
to obtain their thickness and study their construction system and structural behaviour.
It is not possible to scan the soffit as it is propped up.
In this phase, SfM photogrammetry is used to document and record the different
constructive actions, surfaces brought to light, as well as the structural reinforcements
made to the vaults that are hidden at the end of the restoration [37].
The data are transferred, which in this case corresponds to the unloaded arches and
vaults, as the floors and their corresponding pavements have been demolished.
At this stage, the moment analysed collects the information at the moment when the
partition walls, floors, and ceramic revolts have been demolished and the wooden joists
have been removed, so that the floor slab has disappeared. We can consider that this is the
moment when the structure formed by arches and vaults is unloaded and only subjected to
its own weight (Figure 8).
• Stage 3: A terrestrial laser scan of the final state of the work after its restoration is
carried out. This scan allows us to compare the point clouds of the initial state in
Phase 1 and the final state in Phase 3, as well as to have the final geometry of the
building. The scan provides information on the soffit of the arches and vaults, and the
initial and final state of the arch guidelines can be compared.
In this phase, the forging is executed again, but in this case with a different system,
based on a unidirectional framework of wooden joists with a double board supporting
a compression layer of lightened reinforced concrete and finished with wooden flooring,
having reinforced the vaults and the upper wall of the arches with mortar and metal
profiles; and all of this results in a state of loads very similar to the initial state.Applied Sciences 2021, 11, 8541 10 of 20
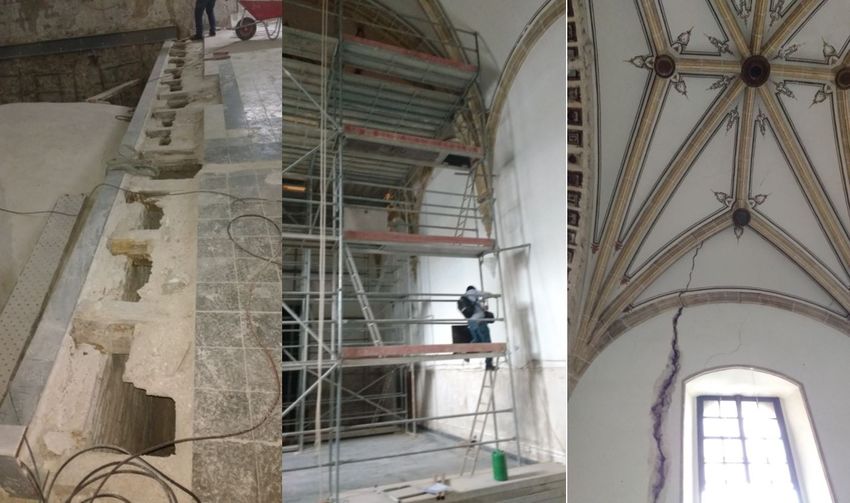
(a) (b) (c)
Figure 8. Principal vault extrados on its different restoration states: (a) Original (b) Reinforcement application on nerves
(c) Finished.
2.5. State of Loads in the Different Stages of the Process
The criterion used to analyse the behaviour of the vaulted structure of the Refectory is
the comparison of the state of loads and deformations in each of the defined stages [3,35]
and in two different situations: on the one hand, we have considered the segmental arches
(arches 1, 2, 3, and 4), which are stressed by vaults, walls, and floors of similar dimensions
and construction solutions, and on the other hand, arch number 5, which receives the loads
from a different floor and vault surface, since the span of the last span is greater.
In the transverse arches, two different points have been considered: the keystone (K)
in the centre of the arch and the salmeres (S) at the extreme supports.
For this purpose, the weights of the elements involved in the construction system are
taken into account, based on the data provided in the tables of Annex C, Basic Document
SE-AE of the CTE [38]:
• Dead weight of the vault, built with two threads of solid brick taken with lime mortar
and rendered on the top and bottom with the same mortar, with an average thickness
of 12 cm, and the consideration that the dead weight of a solid brick masonry with lime
mortar is 18 KN/m3 , which results in: Qvault = 0.12 m × 18 KN/m3 = 2.16 KN/m2 .
A load band is considered in the keystone (Qk), of 2 m for the standard arch and 1.5 m
for arch 5. In the salmeres (Qs) is not considered, given that the vault discharges on
the former arches and the lateral wall;
• Dead weight of the unidirectional slab resting on the brick masonry in segmental
arches, made up of timber beams, beamwork based on solid brick revoltón and
hydraulic tile paving on fillings and lime mortar. An average thickness of 15 cm and a
density of 18 KN/m3 has been considered, and for the timber an average density of
8 KN/m3 , so that we can estimate an initial slab weight of 3.30 KN/m2 for the initial
slab. A constant load band of 5 m is considered for the standard arch and 6 m for arch
number 5;
• The dead weight of the 1 foot brickwork (Catalan format with approximately 30 cm
of rope) on the segmental arches is Q brickwork 1 f oot = 5.4 KN/m2 × h. This load
is variable, being minimum on the keystone Q keystone = 5.4 KN/m2 × 0.25 m =
1.35 KN/m and maximum on the starts Q f actory start = 5.4 KN/m2 × 2 m = 10.8 KN/m,
considering the studied points C and S, respectively;
• Self-weight of the rib-arches made of limestone with a cross-section of approxi-
mately 0.20 m × 0.40 m would have a uniformly distributed linear load of Q rib−arches =
0.20 m × 0.40 m × 28 KN/m3 = 2.24 KN/m, considered constant over the entire arch
(Figure 9);
• Overloading of partition walls. The floor above the refectory is very diaphanous,
with a partition wall of hollow brick with a thickness of 10 cm, and for this purpose a
uniformly distributed linear load of 5 KN/m is considered. This is why this situation
is considered to be the standard arch. In arch 5, given its initial situation with less
partition walls, a load of 2 KN/m is considered.Applied Sciences 2021, 11, 8541 11 of 20
In the first phase, the state of charge results about original materials and elements
(Table 1, Figure 10):
(a) (b)
Figure 9. (a): Typical cross-section of the transverse arches. (b): transverse and diagonal arches (in addition to the
former arches).
(a) (b)
Figure 10. Initial state force diagram (a): arcs 1, 2, 3, and 4; (b) arc 5.
Table 1. State of loads in the initial stage.
Arches Initial State Floor Partition Total
Loads KN/m Arc KN/m Vault KN/m Wall KN/m
(STAGE 1) slab KN/m KN/m Load KN/m
Qk 2.24 16.5 5.00 4.32 1.35 29.41
Arches 1-2-3-4
Qs 2.24 16.5 5.00 - 10.8 34.54
Qk 2.24 19.8 2.00 3.24 1.35 28.63
Arc 5
Qs 2.24 19.8 2.00 - 10.8 34.84
In the second phase considered, the initial slab and the partition walls have been
demolished, and, therefore, the load state will correspond to the sum of the own weights
of arches, walls over arches, and vaults (Table 2, Figure 11).Applied Sciences 2021, 11, 8541 12 of 20
(a) (b)
Figure 11. Force diagram of the intermediate state (a): arcs 1, 2, 3, and 4; (b): arc 5.
Table 2. State of loads in the intermediate stage.
Arches Initial State Floor Partition Total
Loads KN/m Arc KN/m Vault KN/m Wall KN/m
(STAGE 2) slab KN/m KN/m Load KN/m
Qk 2.24 - - 4.32 1.35 7.91
Arches 1-2-3-4
Qs 2.24 - - - 10.8 13.04
Qk 2.24 - - 3.24 1.35 6.83
Arc 5
Qs 2.24 - - - 10.8 13.04
In the third phase, the definitive state of the loads will be the weight of the new slab
and its paving and the reinforcement based on a 2 L 140 metal section as the top of the
one-foot wall above the transverse arches. In addition, the reinforcements on vaults and
walls are considered (Table 3, Figure 12).
(a) (b)
Figure 12. Final state force diagram (a): arcs 1, 2, 3, and 4; (b): arc 5.
Table 3. State of loads in the final stage.
Arches Initial State Floor Partition Total
Loads KN/m Arc KN/m Vault KN/m Wall KN/m
(STAGE 3) slab KN/m KN/m Load KN/m
Qk 2.24 15.00 2.00 4.96 2.25 26.45
Arches 1-2-3-4
Qs 2.24 15.00 2.00 - 12.66 31.90
Qk 2.24 18.00 2.00 3.72 2.25 28.21
Arc 5
Qs 2.24 18.00 2.00 - 12.66 34.90
This results in a uniformly distributed excess linear load of 2 x 0.29 KN/m = 0.58 KN/m
due to the load of the metal reinforcement. We also have to take into account an av-
erage load of 2 cm thick reinforcement mortar with carbon fibre, assuming a density
of 16 KN/m3 , resulting in a linear load at the keystone of 16 KN/m3 × 0.02 m × 1
= 0.32 KN/m, and at the starts 16 KN/m3 × 0.02 m × 2 × 2 = 1.28 KN/m, which
added to the steel structure results in a linear load of the reinforcement elements onApplied Sciences 2021, 11, 8541 13 of 20
the wall of the arches of Q keystone rein f orcement = 0.58 KN/m + 0.32 KN/m = 0.9 KN/m, and
Q salmer rein f orcement = 0.58 KN/m + 1.28 KN/m = 1.86 KN/m.
As for the new load of the slab, it is made up of new laminated wood beams, a double
waterproof plywood board, an 8 cm thick compression layer of concrete lightened with
arlite and reinforced with mesh, on which a 5 cm thick self-levelling mortar is placed,
and a wooden floor. All this means that the final slab has a surface load of Q f inal slab =
3.00 KN/m2 . The load bands are identical to the previous ones.
In addition, the top surface of the vault has been reinforced with the same mortar and
carbon fibre, and an average thickness of 2 cm, which increases the surface load of the vault
by Q vault rein f orcement = 16 KN/m3 x 0.02 m = 0.32 KN/m2 . The load bands considered are
the same as above.
In the project, mobile partitions are proposed that will hang from the existing roof
support structure, but in some cases (arches 1 and 5) a new division is made based on
self-supporting lattice panels, which means a linear load of 2.00 KN/m.
Therefore, the initial and final load states are similar.
2.6. The Stress Response of the Structure by a Simplified Model
In order to understand the structural behaviour of the system, based on the loads
considered, a simplified modelling is proposed based on the study of the mechanical
behaviour of the splay arches, which are the final receivers of the load system.
Considering the arch as a tri-articulated isostatic structure (Figure 13), we can calculate
the support reactions from the three equations of plane statics [39–41].
Figure 13. Tri-articulated isostatic arch. Graphical sketch of tri-articulated isostatic arch. (S= salmer,
support stone; K= keystone; L= light of the arch; H= horizontal reaction; V=vertical reaction;
R= Resulting reaction; Q= linear distributed load; f= deflection of the arch).
For this purpose, we model uniformly distributed loads in each of the three cases
studied, choosing the most unfavourable situation. The system will reflect maximum
horizontal reactions in the keystone and vertical reactions in the brackets, so that the
resultant at the start of the arch originates the stresses that it must absorb [42].
Where Q (KN/m) is the uniformly distributed load considered in each case; L (m)
is the span of the arch and f (m) is the deflection or edge of the arch; H (KN) (horizontal
reaction at the keystone, which is equal to that of the supports so that the system remains
in equilibrium) and V (KN) (equal vertical reaction at the two supports), at the three
articulated points of the system (keystone and two supports); R (KN) (resultant of the
vertical and horizontal components at the supports); and according to the equations of
statics, the horizontal reactions are obtained:Applied Sciences 2021, 11, 8541 14 of 20
LL 2
Q. 2 4 = H.f; H = Q. 8.L f and the vertical reactions would be V = Q. L2
√
We can obtain the Resultant on the supports R = H 2 + V 2
For each of the stages analysed and studying the worst case for each of them,
STAGE 1. The largest uniformly distributed load is Q1 = 35 KN/m, so the following
is obtained
2
H1 = Q1 . 8.L f = 83.12 KN; and the vertical reactions would be V1 = Q1 . L2 = 166.25 KN
q
We can obtain the resultant in the supports R1 = H12 + V12 = 185.871 KN, so that
the maximum stress to which the segment is subjected at the support (salmer) during the
185,871
initial state of the works, that is, in its four hundred years of service life, is σ1 = 400 ∗200 =
2.32 MPa = 2.32 (N/mm ). 2
STAGE 2. The largest uniformly distributed load is Q2 = 13 KN/m, so we obtain
2
H2 = Q2 . 8.L f = 30.87 KN; and the vertical reactions would be H2 = Q2 . L2 = 61.75 KN
q
We can obtain the resultant at the supports R1 = 69.036 KN. H12 + V12 = 69.036 KN,
so that the maximum stress to which the segment is subjected at the support (salmer) at the
69,036 2
moment when the slabs have been demolished is σ1 = 400 ∗200 = 0.86 MPa = 0.86 (N/mm ).
STAGE 3. The highest uniformly distributed load is Q3 = 35 KN/m, which coincides
with one of the most unfavourable states in which the initial state of loading (Stage 1) was
found, so the same results are obtained, and, therefore, once the restoration work has been
completed, the maximum stress to which the voussoir is subjected at the support (salmer)
185,871 2
is σ3 = 400 ∗200 = 2.32 MPa = 2.32 (N/mm ).
The compressive strength of the limestone used to make the arches has not been
tested, but according to the examples consulted [43,44], we can consider a minimum
admissible stress of 10 N/mm2 (MPa), and for the lime mortar in the joint of the voussoirs
of 10 N/mm2 .
According to Annex C. of the Basic Document SE-F [38], the characteristic compressive
strength f k in N/mm2 of the masonry, considering the arch as such, can be calculated with
the equation:
f k = K × f b 0.65 × f m 0.25 = 0.6 × 100.65 × 100.25 = 4.76 N/mm2 = 4.76 MPa
Applying the DB-SE-F criteria of the CTE [38], a reduction factor of 0.9 is considered,
equivalent to an eccentricity of 5% of the thickness of the arch (20 mm), and, therefore,
the geometric section equivalent to the compressed area would be 90% of the real one, so
that in the worst case (when the restoration work has been completed), 2.32 MPa /0.90 =
2.57 MPa < 4.76 MPa. = 4.76 (N/mm2 ).
2.7. Deformations
Throughout the process described in the three stages considered, the graphic doc-
umentation of the arches has been recorded, based on the point clouds obtained at the
beginning (Stage 1) and at the end of the works (Stage 3). In the intermediate stage (Stage 2),
the soffits of arches and vaults were found with falsework guaranteeing their stability in
the demolition phase (only the soffit was scanned), representing the elevations obtained in
each of the cases and with the means and techniques already mentioned (Figure 14):
The coordinates (height) of each of the points observed in the comparison of the
5 arches analysed before (2015) and after (2019) the works are shown below (Table 4 and
Figure 7). Having established the position of a certain point (always the same) in each
of the keys clearly referenced to another point fixed in the space of the refectory and
without any possibility of movement, in order to take the measurements that register the
possible differential movements in three-dimensional coordinates of one stage with respect
to the other.Applied Sciences 2021, 11, 8541 15 of 20
Figure 14. The ordinates are obtained, at least, with 3 fixed reference points (R0 , R1 , R2 ) in the arches studied with
CloudCompare software.
Table 4. Comparison of all arcs.
Arc 1 2 3 4 5 6 7 Key 8 9 10 11 12 13
Arc 1
Stage 1 8.067 8.966 8.538 9.916 10.162 10.299 10.343 10.301 10.162 9.913 9.523 8.953 8.055
Stage 3 8.066 8.968 8.537 9.917 10.163 10.304 10.344 10.298 10.158 9.909 9.521 8.948 8.032
Descent 0.001 −0.002 0.001 −0.001 −0.001 −0.005 −0.001 0.003 0.004 0.004 0.002 0.005 0.003
Arc 2
Stage 1 7.893 8.819 9.445 9.848 10.116 10.259 10.312 10.263 10.119 9.873 9.489 8.863 7.902
Stage 3 7.892 8.819 9.445 9.847 10.108 10.252 10.303 10.256 10.113 9.866 9.481 8.856 7.894
Descent 0.001 0.000 0.000 0.001 0.008 0.007 0.009 0.007 0.006 0.007 0.008 0.007 0.008
Arc 3
Stage 1 7.88 8.865 9.462 9.859 10.113 10.249 10.307 10.263 10.113 9.873 9.503 8.923 7.994
Stage 3 7.882 8.862 9.460 9.855 10.108 10.246 10.302 10.262 10.106 9.866 9.494 8.913 7.989
Descent −0.002 0.003 0.002 0.004 0.005 0.003 0.005 0.001 0.007 0.007 0.009 0.010 0.005
Arc 4
Stage 1 7.984 8.95 9.525 9.926 10.204 10.357 10.387 10.340 10.206 9.966 9.586 9.027 8.151
Stage 3 7.992 8.956 9.529 9.927 10.204 10.350 10.387 10.335 10.203 9.966 9.575 9.018 8.144
Descent −0.002 −0.003 −0.004 −0.001 0.000 0.007 0.006 0.005 0.003 0.000 0.011 0.009 0.007
Arc 5
Stage 1 8.194 9.101 9.672 9.062 10.322 10.476 10.514 10.462 10.317 10.045 9.658 9.110 8.263
Stage 3 8.190 9.096 9.671 9.064 10.322 10.476 10.511 10.464 10.313 10.045 9.657 9.111 8.265
Descent 0.004 0.005 0.001 −0.002 0.000 0.000 0.003 0.000 0.004 0.000 0.001 −0.001 −0.002
The five arches analysed are divided into 14 equidistant sections and 13 points are
studied, including the keystone and excluding the salmeres, which are considered fixed.
The coordinates on the X axis are equidistant and the coordinates on the Y axis correspond
to the height above the ground line plane (the same in all cases) up to the soffit of the arch
axis (described in Section 2.3) which contains irregularities due to the surface of the stone
voussoirs and the error inherent to the technique used (point cloud).Applied Sciences 2021, 11, 8541 16 of 20
The data obtained range from −0.005 m (rise of point 6 of arch 1) to 0.011 m (fall
of point 11 of arch 4), reflecting minimum movements of all the arches studied. The
deformations produced at point 3 of all the arches (kidneys facing the interior zone of the
building) range from −0.004 m in arch 4 to 0.001 m in arches 1 and 5; the deformations at
point 11 of the arches (kidneys in the exterior zone of the refectory) vary from 0.001 m in
arch 5 to 0.011 m in arch 4; the kidneys of the inner zone, west of the refectory, descend
less than the east zone; the movement of the keystones varies from −0.001 m in arch 1 to
0.009 m in arch 2, being in this case also a small descent.
Given the relative error in the data collection, where the sensitivity of the measure-
ments is in the order of 2 mm, we can consider that there has been hardly any movement
in the keystones and kidneys of the arches.
Movements have been observed both in the vaults and in the diagonal rib arches, and
some cracks and displacements of construction elements have been observed, even some
detachments in fragments of vaults; information that was already included in the Master
Plan of the Santo Domingo School: “it has been observed that the upper slab is occasionally
supported by pilasters on the vault’s backside...”, but these movements have not affected
the transverse arches studied (Figure 15).
(a) (b)
Figure 15. (a): Downturned voussoirs of diagonal arches. (b): Deformations and cracks in vaults.
Nor has any differential movement been observed in the arch supports where they
meet the perimeter walls.
3. Discussion of Results
The use of TLS and SfM in the monitoring of the restoration works of the Refectory
of the Santo Domingo College has made it possible to record its geometry accurately, as
well as to document graphically all the walls and construction elements that have been
intervened during the works.
The point cloud obtained in the intermediate stage, once the pre-existing floors have
been demolished, provides data on hidden construction elements: the vault is 11 and
12 cm thick (Figure 16). In the same sense, the recording of all the data collected in the
intervention process makes possible the archaeological analysis and the study of possible
findings. An important debate is opening up that relates the compatibility of traditional
construction models and construction systems used in retrofitting that respect the heritage
received [45,46] and the standards of quality and structural safety [47]. Comparison of
the initial loads (34.54 KN/m in the starts of arches 1, 2, 3, and 4; and 34.84 KN/m in the
start of arch 5) with the final loads (31.90 KN/m at the start of arches 1, 2, 3, and 4; and
34.90 KN/m at the start of the arch 5) confirm a final load state that is more favourable
or equal to the initial one. The loads on the keys offer a similar conclusion (initial loads
of 26.45 KN/m in arches 1, 2, 3, and 4; and 28.63 KN/m in arch 5) and (final loads of
26.45 KN/m in arches 1, 2, 3, and 4; and 28.21 KN/m in arch 5). The data obtained in
(Table 4) show a maximum deflection of 11 mm, so that the deflections are negligible and
less than the deflections allowed in conventional slabs. The deflections in the arch kidneysApplied Sciences 2021, 11, 8541 17 of 20
in the West zone of the Refectory (approximate point 3 of the arch), with a maximum of
2 mm, are smaller than in the East zone (approximate point 11) with a maximum of 11 mm,
which indicates a tendency to greater movements in the parts of the arches closest to the
façade (exterior).
As a working methodology to be followed in restorations similar to the one shown in
this work, the use of digital tools is proposed for the documentation and monitoring of the
restoration process in the 3 phases of work: in the preliminary studies, in the execution of
the works and in the final state of the restoration.
The point cloud obtained at the end of the works is checked against the initial one to
study possible differential movements [3].
The decreases recorded are negligible, so that we are in the order of f < 1/1000 of
light, less than the deflections required for slabs in buildings, and probably due to the
commissioning of the new state of loads on the previously dismantled structure.
The recoveries in the deformations of the vaults not addressed in the present investi-
gation may be the subject of future studies. In some cases they may be the result of cleaning
and adjustment of some of the voussoirs.
(a) (b)
Figure 16. Point cloud section during the restoration works. (a) The measure of the vault section can be obtained.
(b) In detail.
4. Conclusions
The laser scanner and photogrammetry techniques used are fundamental for the
processes of data collection prior to the project, monitoring the works and the final result
with the aim of recording the architectural and heritage object, preserving its condition,
and guaranteeing its maintenance. The analysis of the graphic information obtained has
generated and historical and documentary research is necessary for the knowledge of the
building and the construction procedures that led to its execution. The relevant role of
the structural behaviour of the construction solutions incorporated in the project and their
behaviour in the chronology of the work, as well as the comparison between the initial and
final service states.
The work on the Refectory reinforces the structure of the building on the one hand
and simultaneously reduces or equalises the permanent loads by replacing the old heavy
slabs with lighter ones. These modifications in the state of the loads produce less or equal
stresses in the masonry and vaults of the building, which have a negligible influence on
their deformations. The aim of this restoration is to obtain a more stable structural ensemble
and better conditions for the maintenance and durability of the construction systems. The
analysis of the process in the execution of the works has considered a detailed study of the
gravity loads of the different construction systems and their influence on the structural
behaviour of the whole.
The techniques for reinforcing vaults, arches and walls at the back improve their
stability, and the upper strapping elements improve the load distribution conditions that
guarantee greater safety for the structural models proposed.Applied Sciences 2021, 11, 8541 18 of 20
The techniques and methods used have been able to identify the elements, layers,
dimensions, and composition of the materials, as well as the definition of the systems and
technology in the construction of the building, to preserve the historical and architectural
knowledge of the heritage. The data collected and the reference point clouds for this work
generate reliable recorded information to compare and analyse possible future movements
of the building.
Author Contributions: Conceptualization, P.S.-G.; Data curation, S.S.-B.; Formal analysis, P.S.-G.
and Y.S.-B.; Investigation, P.S.-G.; Methodology, P.S.-G.; Project administration, Y.S.-B.; Resources,
J.A.H.-T. and S.S.-B.; Software, J.A.H.-T. and C.R.-M.; Validation, Y.S.-B. and C.R.-M.; Visualization,
J.A.H.-T. and C.R.-M.; Writing—review editing, C.R.-M. All authors have read and agreed to the
published version of the manuscript.
Funding: This research received no external funding.
Institutional Review Board Statement: Not applicable.
Informed Consent Statement: Not applicable.
Data Availability Statement: Not applicable.
Acknowledgments: Our thanks to the Director of the Diocesan School of Santo Domingo de Orihuela,
José María Fernández-Corredor Soriano, and the Administrator Tomás Angel Carrillo; to the Diocese
of Orihuela Alicante, promoter of the works that has made possible the development of this research;
to the University of Alicante that has provided the technical means for the monitoring and recording
of the data obtained by the Scanner; and to the construction company Lorquimur for facilitating the
studies carried out during the material execution of the works.
Conflicts of Interest: The authors declare no conflict of interest.
References
1. Pérez-Álvarez, R.; de Luis-Ruiz, J.M.; Pereda-García, R.; Fernández-Marotoand, G.; Malagón-Picxoxn, B. 3D Documentation with
TLS of Caliphal Gate (Ceuta, Spain). Appl. Sci. 2020, 10, 5377, [CrossRef]
2. Suchocki, S. Comparison of Time-of-Flight and Phase-Shift TLS Intensity Data for the Diagnostics Measurements of Buildings.
Materials 2020, 13, 353, [CrossRef]
3. Dlesk, A.; Uueni, A.; Vach, K. From Analogue to Digital Photogrammetry: Documentation of Padise Abbey in Two Different
Time Stages. Appl. Sci. 2020, 10, 8330, [CrossRef]
4. Barrile, V.; Bilotta, G.; Lamari, D.; Meduri, G.M. Comparison between techniques for generating 3D models of cultural heritage.
Recent Adv. Mech. Mechatron. Civ. Chem. Ind. Eng. Math. Comput. Sci. Eng. Ser. 2015, 49, 140–145.
5. Giuliano, M.G. Cultural Heritage: An example of graphical documentation with automated photogrammetric systems. Int. Arch.
Photogramm. Remote Sens. Spatial Inf. Sci 2014, XL-5, 251–255. [CrossRef]
6. Kraus, K. Photogrammetry; Dümmler: Bonn, Germany, 1993; Volume 2.
7. Luhmann, T.; Robson, S.; Kyle, S.; Harley, I. Close Range Photogrammetry; Principles, Techniques and Applications; Chapter 3.3.1.3;
Whittles Publishing: Scotland, UK, 2006; pp. 140–141.
8. Mañana-Borrazás, P.; Rodríguez Paz, A.; Blanco-Rotea, R. Una experiencia en la aplicación del Láser Escáner 3D a los procesos
de documentación y análisis del Patrimonio Construido: su aplicación a Santa Eulalia de Bóveda (Lugo) y San Fiz de Solovio
(Santiago de Compostela). Archaeol. Archit. 2008, 5, 15–32. http://dx.doi.org/10.3989/arq.arqt.2008.87.
9. Vacca, G.; Deidda, M.; Dessi, A.; Marras, M. Laser scanner survey to cultural heritage conservation and restoration. In Proceedings
of the International Archives of the Photogrammetry, Remote Sensing and Spatial Information Sciences, XXII ISPRS Congress,
Melbourne, Australia, 25 August–1 September 2012; Volume XXXIX-B5.
10. Yastikli, N. Documentation of cultural heritage using digital photogrammetry and laser scanning. J. Cult. Herit. 2007, 8, 423–427.
[CrossRef]
11. Nieto, E.; Moyano, J.J.; García, A, A. Construction study of the palace of children of don Gome (Andújar, Jaen), managed through
the HBIM project. Virtual Archeol. Rev. 2019, 10, 84–97. [CrossRef]
12. Massafra, A.; Prati, D.; Predari, G.; Gulli, R. Wooden truss Analysis, Preservation Strategies, and Digital Documentation through
Parametric 3D Modeling and HBIM Workflow. Sustainability 2020, 12, 4975. [CrossRef]
13. Gámiz-Gordo, A.; Ferrer-Pérez-Blanco, I.; Reinoso-Gordo, J.F. The Pavilions at the Alhambra’s Court of the Lions: Graphic
Analysis of Muqarnas. Sustainability 2020, 12, 6556. [CrossRef]
14. Chen, S.; Yang, H.; Wangand, S.; Hu, Q. Surveying and Digital Restoration of Towering Architectural Heritage in Harsh
Environments: A Case Study of the Millennium Ancient Watchtower in Tibet. Sustainability 2018, 10, 3138. [CrossRef]Applied Sciences 2021, 11, 8541 19 of 20
15. Fadliand, F.; AlSaeed, M. Digitising Vanishing Architectural Heritage; The Design and Development of Qatar Historic Buildings
Information Modeling [Q-HBIM] Platform. Sustainability 2019, 11, 2501. [CrossRef]
16. Alejandro, P.; Franco, C.; Rueda, A.; Plataand, M.D.; Franco, J.C. From the Point Cloud to BIM Methodology for the Ideal
Reconstruction of a Lost Bastion of the Cáceres Wall. Appl. Sci. 2020, 10, 6609. [CrossRef]
17. Chudoba, P.; Przewłócki, J.; Samól, P.; Zabuski, L. Optimization of Stabilizing Systems in Protection of Cultural Heritage: The
Case of the Historical Retaining Wall in the Wisłoujście Fortress. Sustainability 2020, 12, 8570. [CrossRef]
18. Reinoso-Gordo, J.F.; Rodríguez-Moreno, C.; Gómez-Blanco, A.J.; León-Robles, C. Cultural Heritage Conservation and Sustainabil-
ity Based on Surveying and Modeling: The Case of the 14th Century Building Corral del Carbón (Granada, Spain). Sustainability
2018, 10, 1370. [CrossRef]
19. Angiolilli, M.; Gregori, A.; Vailati, M. Lime-Based Mortar Reinforced by Randomly Oriented Short Fibers for the Retrofitting of
the Historical Masonry Structure. Materials 2020, 13, 3462. [CrossRef]
20. Frigione, M.; Lettieri, M.; Sarcinella, A.; Barroso de Aguiar, J.L. Applications of Sustainable Polymer-Based Phase Change
Materials in Mortars Composed by Different Binders. Materials 2019, 12, 3502. [CrossRef] [PubMed]
21. Ramaglia, G.; Fabbrocino, F.; Lignola, G.P.; Prota, A. Unified Theory for Flexural Strengthening of Masonry with Composites.
Materials 2019, 12, 680. [CrossRef]
22. Dong, K.; Sui, Z.; Jiang, J.; Zhou, X. Experimental Study on Seismic Behavior of Masonry Walls Strengthened by Reinforced
Mortar Cross Strips. Sustainability 2019, 11, 4866. [CrossRef]
23. Wang, G.; Yang, C.; Pan, Y.; Zhu, F.; Jin, K.; Li, K.; Nanni, A. Shear Behaviors of RC Beams Externally Strengthened with
Engineered Cementitious Composite Layers. Materials 2019, 12, 2163. [CrossRef] [PubMed]
24. Kociuba, W. Different Paths for Developing Terrestrial LiDAR Data for Comparative Analyses of Topographic Surface Changes.
Appl. Sci. 2020, 10, 7409. [CrossRef]
25. Cano, P.; Álvarez, F.L.; Torres, J.C.; del Mar Villafranca, M. Use of 3D laser scanning to record the pre-intervention state of the
Fuente de los Leones de La Alhambra. VIrtual Archaeol. Rev. 2010, 1, 89–94. [CrossRef]
26. Huerta, S. Arches, Vaults and Domes. Geometry and Equilibrium in the Traditional Calculation of Masonry Structures; Instituto Juan de
Herrera, Escuela Técnica Superior de Arquitectura Madrid: Madrid, Spain, 2004.
27. Wu, C. Towards Linear-Time Incremental Structure From Motion, 3DV; Institute of Electrical and Electronics Engineers: Seattle, WA,
USA, 2013.
28. Wu, C. VisualSFM: A Visual Structure from Motion System. 2011. Available online: http://ccwu.me/vsfm/5 (accessed on 27
June 2019).
29. Agisoft Metashape Professional. Agisoft Metashape Professional Version 1.5.1. Agisoft. 2019. Available online: http://www.
agisoft.com. (accessed on 30 July 2020).
30. Leon, I.; Pérez, J.J.; Senderos, M. Advanced Techniques for Fast and Accurate Heritage Digitisation in Multiple Case Studies.
Sustainability 2020, 12, 6068. [CrossRef]
31. Quagliarini, E.; Clini, P.; Ripanti, M. Fast, low cost and safe methodology for the assessment of the state of conservation of
historical buildings from 3D laser scanning: The case study of Santa Maria in Portonovo (Italy). J. Cult. Herit. 2017, 24, 175–183.
[CrossRef]
32. Pesci, A.; Bonali, E.; Galli, C.; Boschi, E. Laser scanning and digital imaging for the investigation of an ancient building: Palazzo
d’Accursio study case (Bologna, Italy). J. Cult. Herit. 2012, 13, 215–220. [CrossRef]
33. Koutsoudis, A.; Vidmar, B.; Ioannakis, G.; Arnaoutoglou, F.; Pavlidis, G.; Chamzas, C. Multi-image 3D reconstruction data
evaluation. J. Cult. Herit. 2014, 15, 73–79. [CrossRef]
34. Beltrami, C.D.; Cavezzali, F.; Chiabrando, A.; Iaccarino Idelson, G.; Patrucco, F. Rinaudo. 3D Digital And Physical Reconstruction
Of A Collapsed Dome Using Sfm Techniques From Historical Images. Int. Arch. Photogramm. Remote Sens. Spat. Inf. Sci. 2019,
XLII-2/W11. Available online: https://d-nb.info/1185647805/34 (accessed on 3 August 2021).
35. Loprencipe, G.; Moretti, L.; Ferraro, T.P.R. Railway Freight Transport and Logistics: Methods for Relief, Algorithms for Verification
and Proposals for the Adjustment of Tunnel Inner Surfaces. Sustainability 2018, 10, 3145. [CrossRef]
36. Ferrer-Pérez-Blanco, I.; Gámiz-Gordoand, A.; Reinoso-Gordo, J.F. New Drawings of the Alhambra: Deformations of Muqarnas in
the Pendentives of the Sala de la Barca. Sustainability 2019, 11, 316. [CrossRef]
37. Blanco, S.; Carrión, B.; Lerma, J.L. Heritage Documentation through Photogrammetric and Laser Scanning Solutions, and Their Orientation
to the Generation of Virtual Environments. La Ciencia y el Arte V. Experimental Sciences and Heritage Conservation; Subdirección General
de Documentación y Publicaciones: Madrid, Spain, 2015; pp. 56–69.
38. Ministry of Housing. Basic Document: Structural Safety: Masonry. CTE DB SE-F; Ministry of Housing: Madrid, Spain, 2006.
39. Torroja Miret, E. Razón y ser de los Tipos Estructurales; Instituto E. T. de la Construcción y del Cemento: Madrid, Spain, 2016.
40. Beben, D.; Ukleja, J.; Maleska, T.; Anigacz, W. Study on the Restoration of a Masonry Arch Viaduct: Numerical Analysis and Lab
Tests. Materials 2020, 13, 1846. [CrossRef] [PubMed]
41. De la Plata, A.R.M.; Cruz Franco, P.A. A Simulation Study to Calculate a Structure Conceived by Eugène Viollet-le-Duc in 1850
with Finite Element Analysis. Materials 2019, 12, 2576. [CrossRef]
42. Pomares, J.C.; González, A.; Saura, P. Simple and resistant construction built with concrete voussoirs for developing countries. J.
Constr. Eng. Manag. 2018, 144, 04018076. [CrossRef]You can also read