Air quality in Montréal - Service de l'environnement Environmental Assessment Report 2020
←
→
Page content transcription
If your browser does not render page correctly, please read the page content below

Environmental Assessment Report 2020

Air quality
in Montréal
Service de l’environnement

Air Quality Monitoring
The year 2020 upended the lives of all Montrealers                                                                      carbon monoxide (CO). The information on air
owing to the onset of the COVID-19 pandemic.                                                                            quality in Montréal is available in real time on the
The Réseau de surveillance de la qualité de                                                                             RSQA’s Web site at the following address:
l’air (RSQA) implemented various solutions to                                                                           rsqa.qc.ca.
best maintain its activities in order to pursue
                                                                                                                        The RSQA team is comprised of eight persons
its monitoring of air quality in Montréal during
                                                                                                                        who pool their expertise to provide reliable
this unprecedented period. The data collected
                                                                                                                        air quality data. In order to fulfill its mission,
represent a wealth of findings to further our
                                                                                                                        the network conducts its activities in line with
awareness of the impact of human activities on
                                                                                                                        the guidelines of the National Air Pollution
the environment.
                                                                                                                        Surveillance (NAPS) program. The quality of the
In 2020, the RSQA numbered 14 monitoring                                                                                data is contingent on a number of components
stations spread throughout the Montréal                                                                                 of the air quality monitoring system, namely the
Agglomeration territory. These stations are                                                                             choice of the stations’ location, the metrology of
equipped with analyzers that continuously                                                                               the instruments, the collection of data, and their
measure fine particulate matter (PM2.5), ozone                                                                          validation and dissemination.
(O3), sulfur dioxide (SO2), nitrogen oxides (NOx) and

   POLLUTANTS MEASURED
    Continuous measurements                                       Intermittent measurements

    EC      Elemental carbon                                      VOC     Volatile organic compounds                                                                                        Rivière-des-
    CO      Carbon monoxide                                       PAH     Polyaromatic hydrocarbons                                                                                        CÉ
                                                                                                                                                                                              Prairies
    VOC     Volatile organic compounds                            MTLs    Metals                                                                                                            CO H2S NOx O3 EC PM0.1 PM2.5
                                                                                                                                               Caserne 17
    H2S     Hydrogen sulfide                                      PM2.5   Fine particulate matter (diameter
Poor Air Quality Days
Poor air quality or smog?
A day is deemed poor in terms of air quality as
soon as fine particulate matter concentrations
(PM2.5) exceed 35 µg/m3 for at least 3 hours
in a given station. A poor air quality day is
characterized as a smog day when concentrations
of PM2.5 exceed 35 µg/m3 during at least 3 hours
over more than 75% of the agglomeration’s
territory. During a smog day, concentrations of
PM2.5 generally remain high for 24 hours and
sometimes longer.

        Poor air quality days per month                 In 2020, only 21 days of poor air quality were
              in Montréal in 2020                       recorded in the network’s stations, for a decrease
                                                        of 22 days relative to the 43 days recorded in 2019.
6                                                       These occurrences were all observed in only six
        1
5                                                       months of the year with their distribution heavily
                                                        weighted toward the winter months (January,
4                                                       February, March and December). As was the case
                                                1
3                                                       in 2019, fine particles were responsible for all poor
    3   5                                               air quality days.
2           4
                        1                       3       The impact of the confinement and decline in
1                                                       activities (transport, construction sites) as a result
    1                   1           1
0                                                       of the COVID-19 pandemic was felt starting in
    J   F   M   A   M   J   J   A   S   O   N   D       mid-March. Indeed, there were only 7 poor air
                                                        quality days recorded between March 15 and
                Smog        Other causes                December 31.

                                                    3
Poor air quality days per year                   2020 is also the year that witnessed the longest
               in Montréal since 2014                        smog episode since 2013, with four consecutive
                                                             days, i.e. from January 31 to February 3, 2020.
70                                                           During this episode, the very light winds and the
60                                                           warm temperatures resulted in a stagnation that
50                                                           allowed fine particles to remain trapped near the
                                                             surface of the soil, thus leading to the formation
40
     53       57                                             of a persistent smog. The strong accumulations
30                                                           of fine particles were in the 50 to 80 µg/m3
                                     35     39
20                         27                                range over the Montréal territory. This significant
                     21                            11
10                                                           episode did not only impact Montréal, but all of
      10      7      8      7         6     4     10         the regions as well, from the Outaouais region to
 0
     2014    2015   2016   2017     2018   2019   2020       that of Québec.

                                                             The second significant smog occurrence in 2020,
                    Smog          Other causes               but of a lesser magnitude, lasted a little more
                                                             than 24 hours, on February 11-12, and affected
                                                             all regions, from Montréal to Québec City, with
Strong Resurgence of Smog                                    concentration levels similar to those of the
                                                             previously mentioned occurrence. The other
The year 2020 witnessed a resurgence of
                                                             winter smog episodes occurred on December
smog days with a total of 10 days observed in
                                                             19, 21-22 and were accompanied by lesser
Montréal, for an increase of 6 such days relative
                                                             concentrations of fine particles (40-60 µg/m3).
to the previous year. This increase is somewhat
surprising, considering the reduced activity levels          Summer smog days are getting scarcer and are
during the sanitary crisis. However, meteorological          often caused by forest fires. This was the case for
conditions play a considerable role in the                   the smog episode that occurred in Montréal on
dispersion of pollutants. Moreover, according                June 21st, the high concentrations of fine particles
to the data collected by the Info-Smog program,              being the result of the smoke plume of a peat
this phenomenon was observed in all of the                   fire in the Kamouraska region. It’s worthwhile
province’s regions. The winter of 2019-2020 was              mentioning that particles can travel very long
among those that recorded the greatest number                distances and result in poor quality air and
of days of smog warnings in Québec since the                 smog thousands of kilometers away from the
winter of 2013-2014.                                         triggering event. Indeed in recent years, particles
                                                             originating from forest fires in Alberta (2015),
                                                             Labrador-Newfoundland (2013) and Ontario (2012)
                                                             all resulted in smog days on the territory of the
                                                             Montréal Agglomeration.

                                                         4
Distribution of AQI Days Distributio
Good Acceptable Distribution
Poor of AQI
GoodDays A
Good Acceptable Poor
Air Quality Index (AQI) by Monitoring Station in 2020
Distribution of AQI Days
12 11 Distribution
Distribution
12 of AQI
of AQI
12 Days
Days7 10 10 9 9 6
Good Acceptable Poor
on of AQI Days GoodGood Acceptable
Acceptable Poor Poor 46 80
12
11111 80 246 12 9
Acceptable Poor 132 3 222 113 6 237
Distribution of AQI Days
12
117 17 235 11
114 28 240 123 31 236
12 12
50 293 138 55 218
7 151 66 206
10 10
12 11 12 46 12 7
Good Acceptable Poor
132 3 222 113 6 237 117 17 235 114 28 240 236 3 22250 113
123 31 132 237
293 6 138 218 17 1
55 117
132 3 222 113 6 237 117 17 235 114 28 240 123 31 2
f AQI Days
12 11 12 12 7 10 10 9 9 6 10
able 9 6
Poor 10
12 12 11 11 12 12 12 12 7 7 10 10 10 10 9 9 9 9
46 80
3 222 12
113 680237 7 17 235
117 10 28 240 123
114 10 31 236 9 50 293 9
138 55 218 6
151 66 206 10
111 80 246
46 46 99 280 125 103 231 80
111 80 246 99 280 125 103 231
46 132
132 3 222 3 222
113 6 6 237
113237 17 235
117235
117 17 28 240
114240
114 28 123 31 31 236
123236 50 293
50 293 55 218
138218
138 55 66 206
151206
151 66 111 80 80 246
111246
12 11 12 80 12 7 10 10 9 9
235 114 28 240 123 31 236 50 293 138 55 218 151 66 206 111 80 246 99 280 125 103 231
46
132 3 222 113 6 237 117 17 235 114 28 240 123 31 236 50 293 138 55 218 151 66 206 111 80
12 7 10 10 9 9 6 10
46 80
123 31 236
114 28 240
Distribution of AQI Days
50 293 138 55 218 151 66 206 111 80 246 99 280 125 103 231
Good Acceptable Poor
Air Quality Indices (AQI) by Station
Ville de Montréal measures air quality using
12a numerical11 value called
12 the “air
12 quality7index 10 10 9 9 6 10
(AQI)”. The index value of 50 is attributed to the 46 80
132 3upper
222 limit
113 acceptable
6 237 for 114
117 17 235 each of the
28 240 123 pollutants
31 236 50 293 138 55 218 151 66 206 111 80 246 99 280 125 103 231
measured. The hourly index that is posted is
the greatest value of the sub-indices calculated
for each of the five pollutants subjected to
continuous monitoring in the RSQA stations,
namely CO, O3, SO2, NO2 and PM2.5.
In 2020, in addition to the smog days, the events
responsible for poor air quality days in Montréal
were:
• the Montréal East-End industries (station 3);
• t he Montréal-Nord transit yard workshops
(station 17);
• t he traffic on autoroutes (stations 28 and 103);
• t he Port of Montréal activities and the traffic
on Notre-Dame Est (station 50);
•w ood heating in winter (station 55);
•o ther human activities local in scope Station 55
Rivière-des-Prairies
(all stations).
5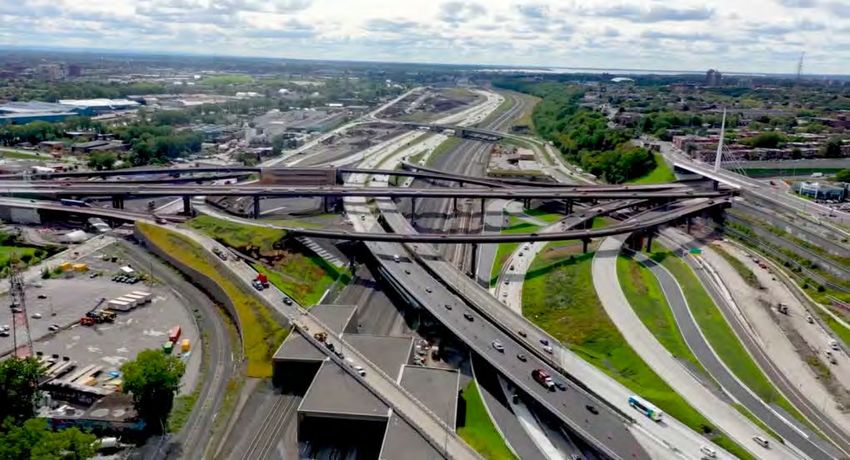
Should one be interested in the evolution of this
                                   portrait over the years, one can observe slight
                                   downward trends in the annual averages of the
                                   number of days where the air quality index was
                                   acceptable or poor whereas the trend for the AQI
                                   on the island when air quality was good has been
                                   stable since 2017. It’s worthwhile mentioning
                                   that there exists a certain annual fluctuation
                                   depending on the meteorological conditions
                                   observed during the year, but that 2020 stands
                                   out due to the increase in the number of good
                                   air quality days and a decrease in the number of
                                   acceptable air quality days.

                                    Evolution in the number of days where the AQI
                                       was good, acceptable or poor 2010-2020
# of good & acceptable AQI days

                                  250                                                            80

                                  200
                                                                                                      # of poor AQI days
                                                                                                 60
                                  150
                                                                                                 40
                                  100
                                                                                                 20
                                   50

                                   0                                                             0
                                        2010 2011 2012 2013 2014 2015 2016 2017 2018 2019 2020
                                                                Year

                                                  Good         Acceptable         Poor

                                                                 6
COVID-19
The measures imposed by the government in
order to curb the dissemination of COVID-19 by
slowing down the economy and shutting down
construction sites has had a positive impact on
the air quality of the Montréal Agglomeration.

Impact Assessment of the Confinement
In June 2020, the RSQA published an assessment
of the confinement’s impact on air quality: https://
montreal.ca/unites/service-de-lenvironnement.
The period chosen for this assessment
extended from March 16 (the beginning of the
confinement) to April 13 inclusively (the beginning
of street cleaning activities by the City). The results
showed significant decreases in nitrogen dioxide
(NO2) and fine particulate matter (PM2.5) during
this period. A key source of these two pollutants
is transport. Road traffic also decreased by half                 The annual concentrations of PM2.5 in 2020 were
near station 28 located at the intersection of                    3.2% less than those recorded for 2019 whereas
Autoroutes 15 and 40.                                             those for NO2 witnessed a decrease of 12.1%
                                                                  in 2020 compared to 2019. The sanitary crisis
                                                                  exacerbated this decrease in NO2 concentrations.
Evolution in PM2.5 and NO2 Annual                                 The change in yearly variations relative to the
Concentrations since 2010                                         previous year is presented in the chart below.
Since 2010, there has been a downward trend for
these two pollutants.
                                                                    Yearly variation in concentrations relative
                                                                               to the previous year
Annual PM2.5 and NO2 concentrations 2010-2020
                                                                        Year            PM2.5            NO2
25
                                                                        2011            -8.0%            5.9%
20                                                                      2012            -4.4%           -11.2%
                                                                        2013            5.8%            -11.4%
15
                                                                        2014            -12.8%          -2.9%
10                                                                      2015            -3.8%           -2.0%

 5                                                                      2016            -11.5%           7.4%
                                                                        2017            2.9%            -0.2%
 0
     2010 2011 2012 2013 2014 2015 2016 2017 2018 2019 2020             2018             1.7%            0.2%

                              Year                                      2019            -5.7%           -4.0%

                   PM2,5 (µg/m3)     NO2 (µg/m3)                        2020            -3.2%           -12.1%

                                                              7
Monthly Variation in Concentrations                          This comparison with the monthly averages
of PM2.5 and NO2                                             of the past 10 years was also made for the
The total monthly concentrations of fine                     concentrations of nitrogen dioxide for all Island of
particulate matter in 2020 for all Island of                 Montréal stations in 2020. The difference between
Montréal stations were compared to the monthly               2010-2014 and other years is even clearer for NO2
averages of the last 10 years split into two periods         than it is for PM2.5. Indeed, monthly NO2 decreases
i.e. 2010-2014 and 2015-2019. The results indicate           in the 40-60% range were observed between
that the concentrations observed were well below             2010-2014 and 2020. In addition, as was the case
the average concentrations for 2010-2014 as well             for fine particulate matter, the majority of months
as below the average for a majority of months                in 2020 had concentrations below the average for
in 2015-2019. The smog occurrences observed in               2015-2019. It’s only in January and February 2020,
February and June 2020 may explain the increase              just before the start of the confinement in March,
in fine particulate matter concentrations for these          that concentrations were greater than those for
two months.                                                  the same period in 2015-2019.

  2020 PM2.5 (μg/m3) monthly concentrations                    2020 NO2 (μg/m3) monthly concentrations
 compared to 2015-2019 & 2010-2014 averages                   compared to 2015-2019 & 2010-2014 averages

12                                                           25

10                                                           20
 8
                                                             15
 6
                                                             10
 4

 2                                                            5

 0                                                           0
     J   F   M   A   M     J   J     A   S   O   N   D            J   F   M   A   M     J   J     A   S   O   N   D

                                                                          2020        2015-2019       2010-2014
             2020        2015-2019       2010-2014

                                                         8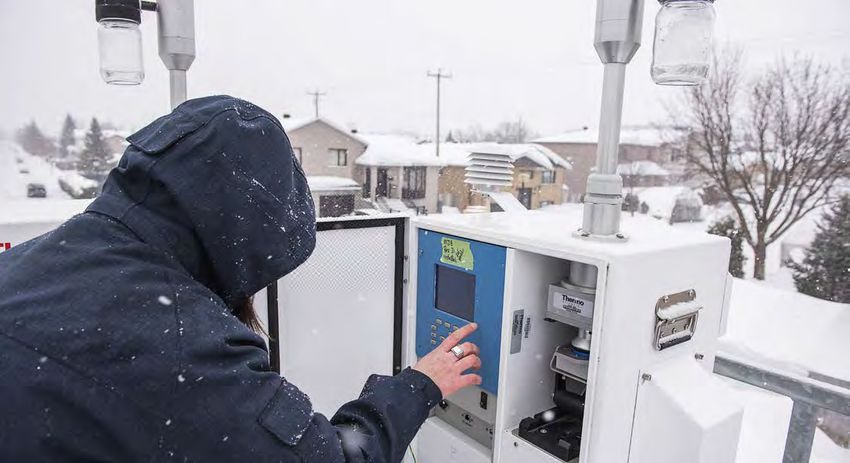
Monthly Evolution in the Number of Poor
Air Quality Days since 2010
The number of poor air quality days also stood
out in 2020 compared to past years. Indeed,
a comparison with the 2010-2014 and 2015-2019
years clearly shows that during the months of
March to November, no or few poor air quality
days were recorded at the RSQA stations, whereas
there was at least one in past years. Consequently,
the results show a better air quality since the start
of the confinement in March.

   Poor air quality days by month in 2020
compared to the 2015-2019 & 2010-2014 averages

10

 8

 6

 4

 2

 0
     J   F   M   A   M     J   J     A   S   O   N   D

             2020        2015-2019       2010-2014

                           9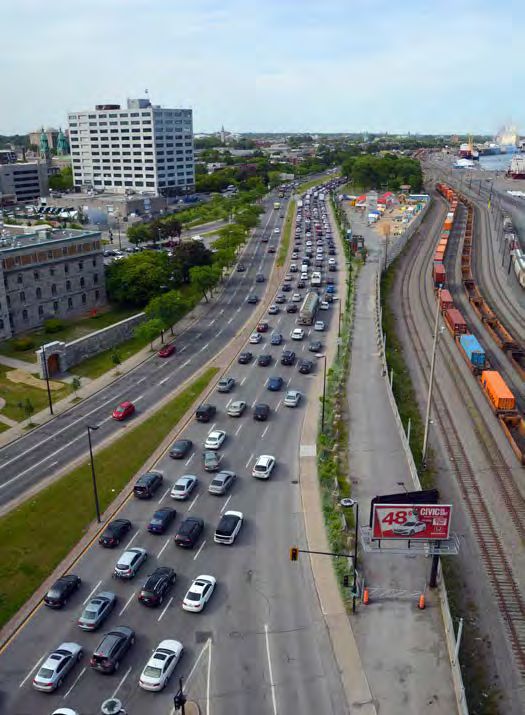
PM
      0.1                                   Ultrafine Particles
A continuous analyzer of ultrafine particles (PM0.1)
was installed and brought into service at station
55 (12400, rue Wilfrid-Ouellette Rivière-des-Prairies
Pointe-aux-Trembles) in October 2020. This
station is the RSQA’s most complete in terms of
equipment. In fact, it is classified as a Level 1 facility
according to the NAPS’ criteria, which means
that all of the parameters that it recommends are
measured (reference method, characterization
and continuous measurement of PM2.5, O3, NOx, CO,
VOC [polar and non polar], PAH and PM10 as well as
elemental carbon).

What Are Ultrafine Particles?
These particles have a diameter smaller than
0.1 micrometer or micron (µm) and despite
their small size, they are dominant in terms of
their number of particles per unit of volume in
the ambient air1. It’s worthwhile mentioning
that their unit of measure is expressed as a
number of particles per cubic centimeter (#/cm3)
compared to larger particles that are expressed in
micrograms per cubic meter (µg/m3).

                                                                                                                           © Shutterstock

                    PM - PARTICLE MATTER

     Human Hair
     50-70 microns                                                               Ultrafine particles are derived from both natural
                                                                                 and anthropogenic sources through primary
                                      Fine Particles
© Shutterstock
Particles of this size can remain airborne What Are Their Potential Health Effects?
over many days and weeks, and travel while Ultrafine particles can deeply penetrate the
crossing borders over long distances in the respiratory system. Also, a small fraction of
ambient air3. They are considered as being an PM0.1 can make their way into the circulatory
emerging pollutant given that their continuous system (the heart and blood vessels) and even
measurement is very recent and not too common into the brain. The noxious health effects of fine
in air quality monitoring networks. Moreover, the particles are often caused by the fraction of
cost of just one analyzer of ultrafine particles is PM0.1. Furthermore, studies on the health effects
equal to the total cost of five commonly used of ultrafine particles are still very few. However,
analyzers, i.e. those for SO2, CO, O3, NO/NO2/NOx given their very large specific surface and their
and finally PM2.5. This pollutant has not yet been capacity to absorb a significant quantity of
regulated but will likely be in the future. With this toxic organic compounds, PM0.1 are considered
in mind, the RSQA has started to equip itself with as being extremely reactive and potentially
this type of analyzer to better understand the pathogenic4.
sources (wood heating, road traffic, air traffic, etc.)
of these particles.
What Are the Quantities of PM0.1
BUDGET in Montréal?
NO/NO2/NOx These data are collected at station 55 but only
analyzer since October 2020. The few results obtained to
date, less than 25% of 2020, do not allow us, at this
SO2 analyzer time, to draw a portrait of the situation.
$ Consequently, the following results are only
PM0.1
analyzer indicative: the average quantity of ultrafine
O3 analyzer
$ particles for the year 2020 amounted to
7,173 particles/cm3 whereas they totalled
PM2.5 analyzer 10,393 particles/cm3 during the 3 smog days
$ that occurred on December 19, 21 and 22.
$ $ $ $ $
CO analyzer
$
$
From a budget point of view, the total cost of the
5 analyzers of regulated pollutants is equal to the
cost of just one ultrafine particle analyzer.
3
https://www.euro.who.int/__data/assets/pdf_file/0006/189051/Health-effects-of-particulate-matter-final-Eng.pdf, Web site consulted March 1, 2021
4
https://cfpub.epa.gov/si/si_public_file_download.cfm?p_download_id=507799&Lab=NERL, Web site consulted March 1, 2021
11Wood Heating and Levoglucosan
For over 10 years now, Ville de Montréal has of wood (28-60%)5. This compound is typical of the
prioritized its fight against pollution associated combustion of hard woods (maple, cherry, oak,
with wood heating in an urban setting, this type etc.). Indeed, the use of hard woods is preferable
of heating being one of the main causes of winter since their combustion produces more energy
smog. In Montréal, the combustion of firewood is (heat) and is slower than that of soft woods6.
second only to transport in terms of fine particle The growing interest in this tracer of wood
emissions (PM2.5). This explains why Ville de heating is due to the fact that its only possible
Montréal adopted on August 24, 2015 its By-law source in the ambient air is wood combustion
15-069 concerning solid-fuel-burning devices and that it represents a significant fraction of
and fireplaces. the aerosols that remain in the atmosphere.
The RSQA published a specific report, available Levoglucosan is thus an ideal tracer of wood
on its Web site, detailing the impact of By-law heating: it's abundant in the smoke emitted by
15-069 on air quality. Since the implementation hard woods, specific to that source and relatively
of this By-law, one can observe a reduction in stable in the atmosphere. That's why this analysis,
air pollution. done at the Rivière-des-Prairies station, mainly
focuses on this compound and allows us to
monitor the evolution in the use of wood stoves
By-law 15-069 in Short and fireplaces in this neighborhood with its
The By-law is two-pronged, the first aiming to strong density of wood stoves.
prohibit the use of any solid-fuel-burning device
on the territory of Ville de Montréal during any
smog warnings, and this, since the adoption of Portrait of the Situation from 2009 to 2020
the By-law in 2015. The second, in force since As regards the evolution of this portrait over the
October 1, 2018, prohibiting the use of any solid- years and relative to the enactment of the By-law
fuel-burning device on the territory of Ville de by Ville de Montréal, one can observe a significant
Montréal unless it's been recognized by an reduction in levoglucosan over the past 10 years.
organization identified in Schedule B of the In 2009, when concentrations of levoglucosan
By-law, within the framework of a certification where at their peak (424.4 ng/m3), the City adopted
process (CSA/B415.1-10 or EPA), stating that it its first By-law banning the installation of any
emits no more than 2.5 g/h of particles in the solid-fuel-burning device, with the exception of
atmosphere. However, the By-law authorizes the EPA certified pellet devices (By-law 09-012 which
use, on an exceptional basis, of solid-fuel devices became By-law 11-018 in 2013). From 2010 to 2012,
(compliant or not) during power outages lasting concentrations of levoglucosan were in the
more than three hours. For further information 260 ng/m3 range and hardly varied. Then, with
re. By-law 15-069, please consult the Web site at the implementation of the Feu-Vert replacement
https://montreal.ca/en/topics/solid-fuel-burning- program, there was a noticeable but slight
stoves-and-fireplaces. reduction in levoglucosan in 2013 (202.4 ng/
m3). This program offered a financial incentive
to Montréal Agglomeration citizens intent on
But What is Levoglucosan? removing or replacing their wood heating devices.
Levoglucosan, the wood heating tracer, is an After a slight increase in 2014, the downward trend
organic compound soluble in water formed by the in levoglucosan concentrations resumed in the
pyrolysis (chemical decomposition through the following years.
application of heat) of cellulose, the core material
5
http://www.pressesagro.be/base/text/v14ns2/549.pdf consulted October 2, 2020.
6
http://www.santecom.qc.ca/Bibliothequevirtuelle/Abitibi/64407.pdf consulted October 2, 2020.
12Evolution of the concentrations of levoglucosan (ng/m3) during the 2009-2019
winter seasons at station 55 relative to the enacted regulations.
500
400
300
200
100
Winter Winter Winter Winter Winter Winter Winter Winter Winter Winter
2009- 2010- 2011- 2012- 2013- 2014- 2015- 2016- 2017- 2018-
2010 2011 2012 2013 2014 2015 2016 2017 2018 2019
New By-law - phase 2
First By-law banning the New By-law - phase 1 Banning of the use of any
© Shutterstock
installation of any solid- Feu vert Banning of the use of solid- non compliant solid-fuel-
fuel-burning device (Reg. replacement fuel-heating devices during heating device (Reg. 15-069)
09-012 which became program smog warnings (Reg. with respect to the particle
Reg. 11-018 in 2013) 15-069) emission standard of 2.5g/h
In 2015, the By-law concerning solid-fuel-burning 2019. Consequently, there is every reason to believe
devices and fireplaces was adopted (By-law 15-069). that the implementation of the second phase of
The first phase, regarding the banning of the By-law 15-069 had a deterrent effect on citizens
use of any solid-fuel-burning device or fireplace with respect to their use of wood burning in
during a smog warning, came into force upon the the wintertime.
adoption of the By-law. Then, in October 2018,
Wood heating has a significant impact on the
the second phase, regarding the banning of the
quality of ambient air in the Rivière-des-Prairies
use of any solid-fuel-burning device and fireplace,
sector neighboring station 55. Although the
with the exception of those certified as emitting
monitoring stations are not all located so as to
no more than 2.5 g/h of fine particles in the
be able to measure a local issue such as this one,
atmosphere, came into force. During the winter
the results obtained are likely representative of
that immediately followed (2018-2019), a reduction
any other sector on the Island of Montréal that
of 35% in concentrations of levoglucosan was
boasts the same density of wood heating devices.
observed compared to the previous year.
To consult the complete study: https://montreal.
Indeed, these concentrations declined from
ca/unites/service-de-lenvironnement.
189.6 ng/m3 in 2017-2018 to 123.8 ng/m3 in 2018-
13H2S
New Measurement Analyzers
of Hydrogen Sulfide
At the end of 2020, two continuous measurement industrial processes used in the oil, steel, and the
analyzers of hydrogen sulfide (H2S) were added pulp and paper sectors as well as in drainage
to the network. The first, at station 55 in the (sewers) and wastewater treatment facilities.
neighborhood of Rivière-des-Prairies (October), It's also produced naturally in marshes, bogs
and the second, at station 3 in the neighborhood and wetlands. H2S has no impact per se on the
of Pointe-aux-Trembles (December). It should be environment except in terms of odors. However,
mentioned that the RSQA stopped measuring this it may have a certain corrosive effect when its
pollutant in 2014 because the technology used at concentrations in the ambient air are greater
that time did not allow for reliable measurements. than usual.
The new analyzers have a lower detection limit of
Next year, the concentrations of hydrogen sulfide
1 ppb, which allows for better measurements in
observed will be compared to the ambient air
the ambient air.
standard indicated in By-law 90 (By-law 2001-10
Hydrogen sulfide is a gas whose singular odor is of the Communauté métropolitaine de Montréal),
comparable to that of a rotten egg. Its presence in which set an upper limit of 11 μg/m3 for acceptable
the ambient air, even in very weak concentrations, average hourly concentrations and of 5 μg/m3 for
had already drawn numerous complaints in acceptable average 24-hour concentrations.
the past. Its main sources of emission are the
© Shutterstock
14Turcot Project
Air quality monitoring within the framework Air Quality Index (AQI) by Turcot Project
of the Turcot Interchange project continued Monitoring Station in 2020
throughout 2020. Average daily concentrations
350
of fine particulate matter (PM2.5) exceeded the
standard of 30 µg/m3 set by the Ministère de 300
l’Environnement et de la Lutte aux changements 250
climatiques (MELCC) on only two occasions, 200
all stations considered. An improvement was
150
observed at station 102 whereas the others
remained stable. 100
50
0
Exceedances of the Standard for 101 102 103 104
Fine Particulate Matter (PM2.5)
Good Acceptable Poor
Stations 101 102 103 104
Total 2016 1 13 1 3
The air quality monitoring done within the
Total 2017 0 4 0 1 framework of the Turcot Project was terminated
Total 2018 2 7 2 3 at the end of December 2020 since the major
Total 2019 1 5 1 0 infrastructure works had then been completed.
Total 2020 1 0 1 0 Station 103 located at the intersection of De
Roberval and York, in the borough of Le Sud-
Ouest, will remain in operation, as it was
In 2020, a final milestone was reached in that all integrated into the RSQA.
major infrastructure works were completed.
The worksite's activities decelerated throughout
the year, as shown by the lower results observed.
© Government of Quebec/Facebook
15Canadian Ambient Air Quality
Standards (CAAQS)
© Shutterstock
As part of of the following comparative exercise, Fine Particulate Matter (PM2.5)
the averages were obtained by using the data Concentrations Expressed in µg/m3
of all RSQA stations. The Canadian ambient air
3-year average of the annual 98th percentile
quality standards (CAAQS) are used for reference
of the daily 24-hour average concentrations
purposes only. Since 2017, the CAAQS deal Canadian standard = 28 in 2015 and 27 in 2020
with fine particulate matter (PM2.5), ozone (O3),
sulfur dioxide (SO2) and nitrogen dioxide (NO2). 2014-2016 2015-2017 2016-2018 2017-2019 2018-2020
These standards are the core of the Air Quality 21 20 20 20 20
Management System (AQMS) promoted by the
Canadian Council of Ministers of the Environment.
3-year average of the annual average
These data are presented in micrograms per
concentrations
cubic meter (µg/m3) or parts per billion (ppb). Canadian standard = 10 in 2015 and 8.8 in 2020
Since 2014, an improvement in PM2.5 2014-2016 2015-2017 2016-2018 2017-2019 2018-2020
concentrations has been observed in Montréal’s
8.6 7.5 7.4 7.4 7.3
ambient air, the 3-year average annual
concentrations showing a decrease of 8.6 to
7.3 µg/m3. For these two standards, the situation
is similar to recent years and the results are The trend for O3 is rather stable with 3-year
below the standards that had been set for 2020. averages fluctuating between 54 and 58 ppb
The 2025 standards for fine particulate matter from 2014 to 2020. The recorded concentrations
are being reviewed and should be announced of ozone are lower than the Canadian standard
in 2022. of 62 ppb for 2020 and show a slight downward
trend since 2015.
Ozone (O3) Concentrations Expressed in ppb
3-year average of the annual 4th highest daily
maximum 8-hour average concentrations
Canadian standard = 62 in 2020 and 60 in 2025
2014-2016 2015-2017 2016-2018 2017-2019 2018-2020
56 58 57 55 54
16The results for SO2 show a constant improvement of fossil fuels in automobiles and in home heating
since 2014 and are compliant with the 2020 and systems is the main source of NO2. As far as the
2025 standards with hardly any variation from year's average is concerned, it complies with both
last year. the 2020 and 2025 standards with a downward
trend since 2018. This trend was even more
marked in 2020 owing to the reduced activities
Sulfur Dioxide (SO2) Concentrations
brought about by the COVID-19 confinement
Expressed in ppb
period and a gradual return to normalcy.
3-year average of the annual 99th percentile of the
daily maximum 1-hour average concentrations
Canadian standard = 70 in 2020 and 65 in 2025 Nitrogen dioxide (NO2) Concentrations
Expressed in ppb
2014-2016 2015-2017 2016-2018 2017-2019 2018-2020
3-year average of the annual 98th percentile of the
21 18 17 17 16
daily maximum 1-hour average concentrations
Canadian standard = 60 in 2020 and 42 in 2025
Arithmetic average over a single calendar year 2014-2016 2015-2017 2016-2018 2017-2019 2018-2020
of all 1-hour average concentrations
Canadian standard = 5.0 in 2020 and 4.0 in 2025 45 45 45 46 44
2016 2017 2018 2019 2020
Arithmetic average over a single calendar year
0.7 0.8 0.6 0.5 0.4
of all 1-hour average concentrations
Canadian standard = 17 in 2020 and 12 in 2025
2016 2017 2018 2019 2020
The 3-year averages for NO2 showed very
slight variations between 2014 and 2020. The 10.0 10.3 10.4 9.1 8.4
concentrations of 44 ppb recorded in 2018-2020
were well below the 60 ppb 2020 standard but
just above the 2025 standard of 42 ppb. The use
17RSQA
Publication A migration of our Web site has been underway
•E nvironmental Assessment Report 2019 since 2020. We've taken this opportunity to
collaborate with our Service de l'informatique to
• Impact of the confinement on air quality
make available data on metals, of which arsenic,
• Air Quality Monitoring on the City's open data Web site. These data will
be accessible starting sometime in 2021.
Web Site Migration The following is an aide-mémoire indicating
In 2020, the RSQA’s Web site greeted where to find the information on air quality.
65,697 visitors.
rsqa.qc.ca Montreal.ca Donnees.montreal.ca
AQI
Air quality forecast
Map of stations
List of stations
Data
Information on air quality
Annual Assessment Reports
For any other request,
please contact:
•c rse-environnement@montreal.ca
• 514-280-4330 or 311
18Coming in 2021
Station 25
Commissioning of station 25 - Longue Pointe
(Avenue Haig/Rue Notre-Dame Est) as part of the
implementation of a collaborative management
system of the Notre-Dame integrated mobility
corridors for the optimization of the access to the
Port of Montréal.
Huge Instrumentation Upgrade
2021 will be an unprecedented year for the
RSQA with an investment in excess of $650,000
in the upgrading of our air quality monitoring
instrumentation. A communication will be
released sometime this year to detail these
investments.
19montreal.ca Ville de Montréal (05-21) 26849
You can also read