Airborne dispersion of droplets during coughing: a physical model of viral transmission - Nature
←
→
Page content transcription
If your browser does not render page correctly, please read the page content below
www.nature.com/scientificreports
OPEN Airborne dispersion of droplets
during coughing: a physical model
of viral transmission
Hongying Li1, Fong Yew Leong 1*, George Xu 1
, Chang Wei Kang1, Keng Hui Lim1,
Ban Hock Tan 2 & Chian Min Loo3
The Covid-19 pandemic has focused attention on airborne transmission of viruses. Using realistic air
flow simulation, we model droplet dispersion from coughing and study the transmission risk related
to SARS-CoV-2. Although this model defines most airborne droplets as 8–16 µm in diameter, we infer
that larger droplets of 32–40 µm in diameter may potentially be more infectious due to higher viral
content. Use of face masks is therefore recommended for both personal and social protection. We
found social distancing effective at reducing transmission potential across all droplet sizes. However,
the presence of a human body 1 m away modifies the aerodynamics so that downstream droplet
dispersion is enhanced, which has implications on safe distancing in queues. At 1 m distance, we found
that an average of 0.55 viral copies is inhaled for a cough at median loading, scalable up to 340 copies
at peak loading. Droplet evaporation results in significant reduction in droplet counts, but airborne
transmission remains possible even under low humidity conditions.
The current coronavirus disease o utbreak1 is an unprecedented global crisis with confirmed cases in the mil-
lions. The exceptional infectiousness of the severe acute respiratory syndrome coronavirus 2 (SARS-CoV-2) has
focused attention2 on the nature of its transmission pathways, with suspicion for an airborne r oute3–5. Airborne
transmission depends on three main factors, namely, stability of virus, air circulation and droplet deposition6.
SARS-CoV-2 is found to be stable in aerosol for up to the three hours of an e xperiment7 similar to its predeces-
sor SARS-CoV-1 which in certain circumstances, achieved airborne t ransmission8. Airborne transmission of
SARS-CoV-2 is now widely recognized and may explain a series of real-life, large-scale outbreaks9–13. Recent air
sampling conducted in airborne infection isolation rooms has found PCR-positive particles of sizes in excess of
1 μm despite extensive air changes5.
During a cough or sneeze, mucosalivary fluid is expelled into the surrounding air in the form of d roplets14,15.
Conventionally, droplets greater than 5 μm in diameter are termed as respiratory droplets whereas those less than
5 μm in diameter are aerosols16. It should be pointed out, however, this is not a strict definition in that larger drop-
lets can be suspended readily in air and become a irborne17. The size of the droplets affects the range of dispersal
significantly18. Respiratory droplets tend to settle quickly and contaminate surrounding surfaces within a short
distance6,19, whereas droplet nuclei can remain airborne for hours and present a long-range transmission r isk20.
As a first line of defence against the pandemic, many countries have adopted what is commonly known as
‘social distancing’ where individuals are advised, sometimes legally mandated to maintain a certain distance
from other individuals in public. Mathematical m odels21–23 suggest that enforced physical separation could be
an effective measure when deployed swiftly during a viral outbreak24, based also on simulations of past viral
outbreaks25. The actual recommended distance varies from 1 m (Singapore), 1.5 m (Australia), 6 feet (CDC, USA)
to 2 m (UK). Generally public guidelines range from 1 to 3 m, and the ‘science behind these numbers’, as policy
makers put it, is loosely based on an early seminal work26. In a recent study based on turbulent cloud physics,
cough droplets are reported to spread up to 7–8 m27. Further, researchers at Wuhan hospitals found corona-virus
residues in floor samples up to 4 m from identified sources28. Hence, even though the rationale behind social
distancing is robust29, there is clearly no consensus as to what constitutes a safe separation distance, even for
health workers treating infected p atients30.
Fluid dynamics plays an important role in almost every aspect of this p andemic31. A brief survey of cough
dispersion studies32 yields theoretical puff model15 and plume model33, supported by visualization techniques
1
A*STAR Institute of High Performance Computing, 1 Fusionopolis Way, Connexis 138632, Singapore. 2Department
of Infectious Diseases, Singapore General Hospital, Outram Road, Singapore 169608, Singapore. 3Department
of Respiratory and Critical Care Medicine, Singapore General Hospital, Outram Road, Singapore 169608,
Singapore. *email: leongfy@ihpc.a‑star.edu.sg
Scientific Reports | (2021) 11:4617 | https://doi.org/10.1038/s41598-021-84245-2 1
Vol.:(0123456789)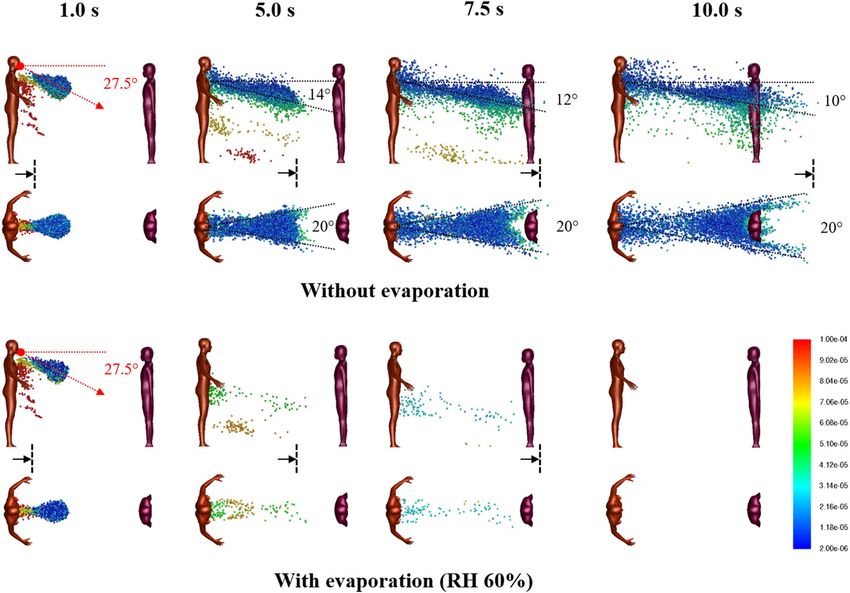
www.nature.com/scientificreports/
such as s chlieren34, shadowgraph35, and particle image v elocimetry36,37. Notably, numerical methods, such as
Computational Fluid Dynamics (CFD) based on Reynolds Averaged Navier–Stokes (RANS) turbulence m odels38
39
produce high resolution flow fields and concentration data , which not only compensate for slow instrumental
speeds of analytical techniques32, but are also adaptable to different environments and scenarios, such as pas-
sengers in an aircraft cabin40, and more recently, a cough dispersion study in an outdoor environment under
significant wind s peeds41, whose results are useful in integrated transmission m
odeling42.
It is important to note that droplet dispersion model may infer transmissibility but not the actual infection
risk. That will take an infectious dose, which refers to the number of viral particles to establish an infection in
half of individuals, which depending on the type of v irusx43, Risk assessment of airborne infection should also
account for actual viral transport.
In this study, we performed numerical simulations of droplet dispersion from a single cough based on single
person and two person settings under realistic indoor conditions and assess viral transmission through airborne
droplets.
Methods
Droplet dispersion model. We consider a standing person who initiates a sudden, involuntary cough in
an indoor environment. For reference we shall label the person the ‘Cougher’. Our objective here is to assess the
droplet dispersion potential under representative conditions: slight breeze from behind towards the Cougher
at a speed 0.3 m/s, an ambient air temperature of 25 °C and a relative humidity of 60% (typical humidity in an
air-conditioned environment). The Cougher model is based on a standard human 1.7 m tall (average height for a
Singaporean male) with open arms who begins normal breathing cycles immediately after the cough.
Based on established cough patterns, the standard cough is modelled as a planar jet inclined downwards at
an angle 27.5° averaged between 15° and 40° angular limits of a typical cough jet44. The mouth opening area is 4
cm2, a time-averaged value based on mouth opening data during a c ough44. The cough emits a cluster of droplets
with standard size distribution15,46 and viral loading47. Based on cough tests39,43, the modelled velocity profile
reaches peak 10 m/s at 0.1 s and decays to zero at 0.5 s46. At the end of the cough cycle, breathing cycle begins,
modelled here as a sinusoidal function with a period of 6 s and amplitude of 0.73 m/s46. Accordingly, charac-
teristic Reynolds numbers for cough is approximately 13,000 and for normal breath 1000. Breath temperature
is assumed to be 36 °C.
Separately, we consider the case of two persons, with the other labelled the ‘Listener’. The Listener model,
positioned either 1 or 2 m away from the Cougher, is based on a standard human 1.59 m tall (average height
for a Singaporean female) with arms closed and she begins normal breathing cycles immediately at the start of
the cough.
Using Eulerian–Lagrangian model, we solve numerically for Newtonian air flow, temperature, species and
droplet trajectories in space and time, using finite volume method implemented on ANSYS FLUENT (2019R3).
First, steady state Eulerian simulations with species transport are performed for humid air flow and heat trans-
port within the domain. Then using steady state solutions as input, simulations are repeated using discrete phase
model, where transient momentum and heat transfer are included in Lagrangian tracking of droplet trajectories.
Droplets are assumed stable and do not experience breakup due to the low We number (maximum We number
is 1.7). The governing equations and computational details can be found in the Supplementary Information.
Viral transmission analysis. We collect all droplets past designated distances, specifically 0.5, 1.0, 1.5
and 2.0 m from the source and characterize their respective size distributions time-averaged up to 10 s since
the onset of the cough and adjusted for wind speed (0.3 m/s). The droplet count probability is a probability
function obtained by taking the ratio of the number of droplets of a certain size and the width of the corre-
sponding size interval based on the original size histogram45. To assess viral transmission potential, we calculate
the number of viral copies found in each droplet in terms of the viral load (copies per volume). The median
viral count probability is a probability distribution obtained by taking the product of median SARS-CoV-2 viral
load (3.3 × 10⁶ copies/mL)47 and the droplet count probability distribution. The day-0 viral load sampled from
patients on admission day is 5.7 × 10⁷ copies/mL47. More recent data reported similar viral loads, with average
load of 7.0 × 10⁶ copies/mL and peak load of 2.35 × 10⁹ copies/mL48. The viral loading found in saliva is assumed
to be homogeneously distributed among droplets emitted during a cough49.
Risk assessment. To assess the extent of exposure, we collect droplets deposited on the Listener model
surfaces, over the entire body (surface area 1.43 m2) and the mouth region (3.5 c m2), assuming mouth breath-
ing, and including normal breathing cycles. Separately, we include a scenario where the Listener is wearing
a mask (aspect ratio 1.43) and account for droplets landing on the mask (288 cm2). The droplet deposition
count probability is a probability function obtained by taking the ratio of the number of deposited droplets of
a certain size and the interval of that size based on the original size histogram45. The median viral deposition
count probability is a probability distribution obtained by taking the product of median SARS-CoV-2 viral load
(3.3 × 10⁶ copies/mL)47 and the droplet deposition count probability distribution. Total deposited viral counts
are obtained by integrating the respective median viral count probability distributions within size distribution
limits (2–100 µm). Pulmonary deposition efficiency is not considered, since all droplets are in micron size range
and do not escape readily via exhalationx50. In addition, we do not distinguish between exposure to ingested or
inhaled droplets, and trapped droplets do not re-entrain.
Scientific Reports | (2021) 11:4617 | https://doi.org/10.1038/s41598-021-84245-2 2
Vol:.(1234567890)
www.nature.com/scientificreports/
Figure 1. Droplet dispersion (side and top-down views) from a single cough inclined downwards at 27.5° for
non-evaporative (top) and evaporative (bottom) cases at relative humidity of 60%. Color bar indicates droplet
sizes (2–100 µm). Vertical lines are spaced 1 m apart and arrows are drift markers based on a background wind
speed of 0.3 m/s. Ambient air temperature is 25 °C and breath temperature is 36 °C. Plume angles 14–10° from
the chest 10 s after the cough and lateral dispersion fits a 20° forward wedge.
Results
Droplet dispersion. For the base case with a single Cougher, Fig. 1 shows snapshots of 2–100 µm droplet
dispersion up to 10 s following a cough, side and top-down view, without (top) and with evaporation physics
(bottom). Generally, larger droplets (in red) separate from the cloud and settle in seconds with a dispersion
range of barely 1 m; smaller droplets (in blue) are buoyant and spread over large distances but may also evaporate
rapidly into residues known as droplet nuclei26. For non-evaporative case (Fig. 1; top), the droplet cloud starts off
as a fast moving puff15 from the oral region but quickly disperses into a plume33 inclined at an angle from 14° to
10° (10 s) from the chest. Top-down view shows that the lateral droplet dispersion in depth is relatively constant,
and by inspection, the plume can be effectively confined within a 20° forward wedge. Droplets near the sides of
the virtual wedge travel faster than those near the center due to entrainment of air flow into the wake.
For the evaporative case, significant reduction in droplet counts is observed seconds from the cough (Fig. 1;
bottom). At relative humidity of 60%, the lifetime of a droplet 10–100 µm is in the order of seconds (Supplemen-
tary Figure S1). Small droplets rapidly evaporate into droplet nuclei, which continue to remain airborne for a long
time due to their small size. As evaporating droplets decrease in size, the settling times are increased, resulting
in a horizontal plume at hip level. Droplets are also observed to become more mono-disperse (a decrease in
diversity of droplet sizes) compared to non-evaporative case. Top-down view shows minimal lateral dispersion
for the remaining droplets. Taking the 20° forward wedge plume from the non-evaporative case, it is likely that
evaporated droplets, or droplet nuclei, would follow similar dispersion trends.
At very short distances from the cough (< 0.2 m), the central velocity is higher due to the cough jet stream
being greater than the surrounding air v elocity51,52. However, this study concerns the long-range dispersion of
droplets partly propelled by the wind. Since the wind is coming from behind the cougher, there is a velocity
deficit in the wake, such that the edge velocity is higher than the center. This results in the dispersion profile as
shown in Fig. 1.
The droplet count probability depends on the droplet size distribution and distance from the Cougher (Fig. 2).
The mode of the distribution lies between 8 and 16 µm; closer to 8 µm at short distances (< 1 m) but closer to
16 µm at longer distances. Increase in distance results in reduction of droplet counts across all droplet sizes.
Interestingly, we find that droplets between 32 and 40 µm represent the highest transmission potential in terms
Scientific Reports | (2021) 11:4617 | https://doi.org/10.1038/s41598-021-84245-2 3
Vol.:(0123456789)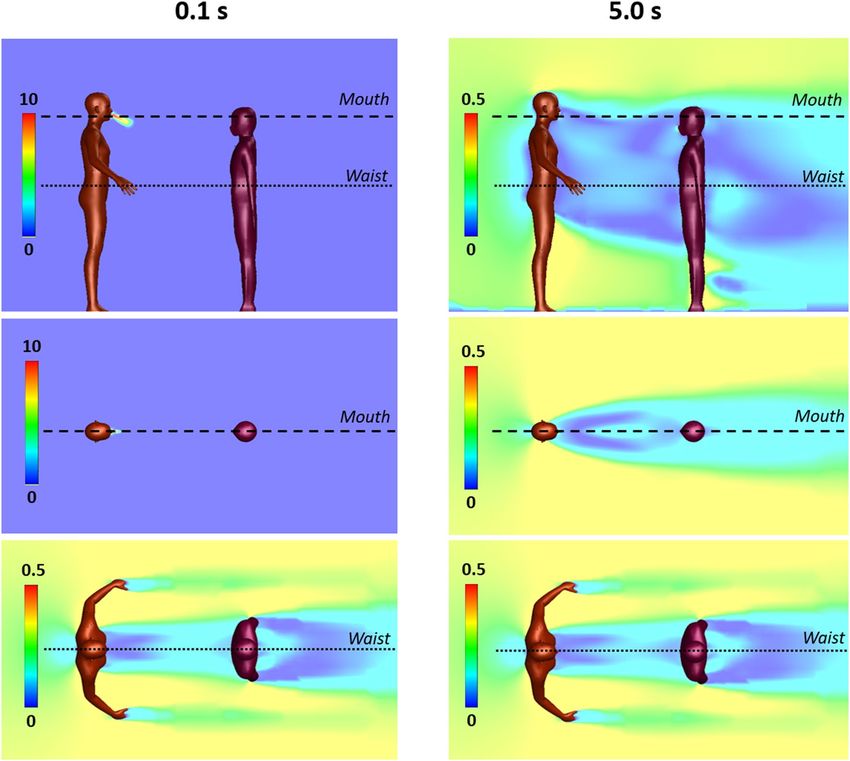
www.nature.com/scientificreports/
Figure 2. Airborne droplets with horizontal distances exceeding indicated distances from source, time-
averaged up to 10 s since onset of cough, adjusted for wind drift (0.3 m/s). (A) Droplet count probability.
Mode: 8–16 µm. (B) Median viral count probability based on median viral load (3.3 × 10⁶ copies/mL)46. Mode:
32–40 µm. Droplets larger than 75 µm have low airborne transmission potential despite high viral counts.
Figure 3. Median viral count collected at indicated distances from source in time, for cases (A) without
evaporation and (B) with evaporation at relative humidity of 60%. Evaporated droplets persist as droplet nuclei
which may pose infection risk over extended distance and time scales. Vertical lines along the abscissa denote
the time required for wind drift to cover the indicated distance (m).
of droplet sizes. Fewer in numbers compared to 8–16 µm droplets, these 32–40 µm droplets contain much higher
viral counts due to their larger volumes. Larger droplets greater than 75 µm contain even higher viral count per
droplet, but they tend to settle rapidly and therefore present little airborne transmission potential except under
strong wind conditions41.
Exposure to virus via droplets depends on distancing, as well as wind speed and direction (Fig. 3). For 0.5 m
distancing without evaporation, the median viral count accumulates rapidly to 80 in less than 1 s due to high
velocity droplet transport from the cough jet, which is substantially faster than the background wind drift.
Between 5 to 9 s, viral counts are elevated from 100 copies up to 147 due to the passage of a cloud of large droplets
drifting close to the ground before settling (Fig. 3; 5–7.5 s); these droplets contain high viral counts. As distanc-
ing increases, the droplets become more wind dispersed, in this case, at a wind speed of 0.3 m/s. In particular, it
takes approximately 7 s for viruses to be projected over a distance of 2 m. This delay may provide sufficient time
for simple reactive measures, such as stepping away or wearing a surgical mask.
For the evaporative case with 0.5 m distancing, the median viral count accumulates rapidly to 70, then
decreases as smaller droplets with lifetimes under 1 s evaporate into nuclei. Between 4.5 to 8 s, viral count
increases from 33 copies up to 121 also due to the passage of a cloud of large droplets drifting close to the ground.
Compared to the non-evaporative case, this increase is more significant, because large droplets tend to evapo-
rate slowly compared to small ones (Supplementary Information), and as droplet lifetimes are increased as they
shrink in size and they remain airborne for longer periods of time. In addition, the non-volatile components
are conserved, so the viral loads (in copies per unit volume) in evaporating droplets are higher than the original
viral loads released from the source. Upon complete droplet evaporation, viruses persist in the dry residue as
Scientific Reports | (2021) 11:4617 | https://doi.org/10.1038/s41598-021-84245-2 4
Vol:.(1234567890)www.nature.com/scientificreports/
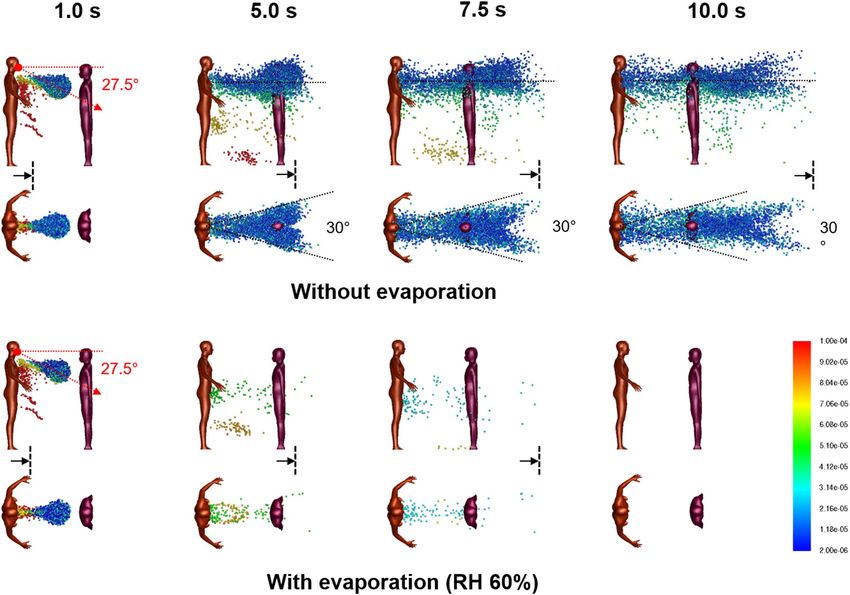
Figure 4. Droplet dispersion (side and top-down views) from a single cough inclined downwards at 27.5° for
non-evaporative (top) and evaporative (bottom) cases at relative humidity of 60%. Listener is 1 m away facing
Cougher. Color bar indicates droplet sizes (2–100 µm). Arrows represent drift markers based on a background
wind speed of 0.3 m/s. Ambient air temperature is 25 °C and breath temperature is 36 °C. Plume is aligned
horizontally from the chest up to 10 s after the cough and lateral dispersion fit a 30° forward wedge.
airborne nuclei, which continue to pose infection risks over extended distance and time. Here, the viral counts
shown in Fig. 3 represents droplet transmission and excludes viruses contained in airborne nuclei.
The number of viral copies required to establish an infection in half of individuals, or Infectious Dose (ID),
is wide-ranging and depends significantly on the type of virus. The ID for SARS-CoV-2 is currently unknown
but expected to be small, based on how fast the virus has spread globally. Since the viral load sampled from
patients on admission day (day-0) is more than 17 times the median load47, reading off at a rescaled viral dose
of ~ 6 (100/17) would suggest significant infection probabilities.
Two persons separated by 1 m. For 1 m distancing, Fig. 4 shows snapshots of 2–100 µm droplet disper-
sion up to 10 s following a cough, side and top-down view, without (top) and with evaporation (bottom). With
a Listener model as an obstacle to air flow, the aerodynamics is modified so that the droplet plume is elevated
and its angle is now horizontal from the Cougher’s chest level up to 10 s following the cough. The presence of the
Listener at 1 m has effectively increased the dispersion range of the droplet plume, with practical consequences.
Observe that the head of the Listener is engulfed by the droplet plume when it should not be at that distance
(Fig. 1). Also, now since air has to move around the Listener, the lateral dispersion length is now defined by the
characteristic width of the Listener (shoulder to shoulder), which by inspection, results in a 30° wedge, instead
of the 20° wedge previously obtained for single Cougher case (Fig. 1). Further downstream, the lateral plume
angle is horizontal and as before, the droplets further from the center travel faster than those near the center due
to entrainment of air in the Listener’s wake.
For the evaporative case, significant reduction in droplet counts is observed seconds from the cough (Fig. 4).
Unlike the non-evaporative case, the dispersion of evaporating droplets is found to be relatively unaffected by the
presence of the Listener. Dispersion of droplet nuclei is expected to follow air streamlines due to their small sizes.
Figure 5 shows the air flow field with Listener 1 m away at 0.1 and 5.0 s from the cough. At the mouth level,
the velocity field is initially dominated by the high velocity air jet from the cough. Both the width of the cough
jet and the decay of jet speed fall within expected ranges reported in experimentally measured cough p rofiles53.
At the waist level, the flow field is unaffected by the cough jet.
Scientific Reports | (2021) 11:4617 | https://doi.org/10.1038/s41598-021-84245-2 5
Vol.:(0123456789)www.nature.com/scientificreports/
Figure 5. Velocity fields between a Cougher and a Listener spaced 1 m apart at 0.1 and 5 s following a single
cough inclined downwards at 27.5°. Color bar indicates velocity magnitude. Top panels: side view (center plane);
middle panels: top-down view (cross-section at Cougher mouth level); Bottom panels: top-down view (cross-
section at Cougher waist level) reveals steady flow fields.
Two persons separated by 2 m. For 2 m distancing, Fig. 6 shows droplet dispersion up to 10 s following
a cough, for both side and top-down views, without (top) and with evaporation (bottom). With the Listener now
further away, the droplet plume reverts to the base case scenario (Fig. 1), where it is inclined from 14° to 10° from
the chest level of the Cougher up to 10 s. Closer to the Listener, however, the plume realigns horizontally as air
wraps around the chest level. Top-down view shows that the lateral plume is now confined within a 20° forward
wedge (instead of 30° for 1 m distancing), since the width of the Listener is smaller than the characteristic width
of the wake at that distance. The chest presents a wider obstacle to droplet dispersion compared to the head
(Fig. 1), resulting in a droplet-free wake further downstream from the Listener. For the evaporative case, the
dispersion of evaporating droplets is similarly unaffected by the Listener at 2 m.
Droplet deposition and viral transmission. Figure 7 shows that most of the droplets deposit on the
body surface, and only a small fraction on the mouth region, which are inhaled or ingested. The modes for body
deposition are 8–16 µm at 1 m and 16–24 µm at 2 m; the average mode for mouth and mask deposition is 4–8 µm
at both distancing. Although the number of droplets deposited on the mouth (inhaled) is less than on the body,
the deposition efficiency (per unit area) is substantial since the surface area of the mouth region is only 0.02%
of the entire body. The droplet Stokes number ranges from 10–6 for 2 µm droplet to 0.002 for 100 µm droplet.
During the inhalation half cycle, droplets are transported by the air intake into the mouth where they may
be ingested, inhaled or exhaled. Droplet deposition on the mask is enhanced due to breathing cycles. Inhaled
droplets are generally smaller (mode: 4–8 µm) in size compared to those deposited on the Listener’s body (mode:
8–24).
The median viral deposition count probability based on SARS-CoV-2 viral load (3.3 × 10⁶ copies/mL)46 shows
significant viral deposition on the body surface (Fig. 7). Interestingly, the highest viral counts found on the body
are deposited by droplets of sizes 32–40 µm at 1 m and 24–32 µm at 2 m, which is the opposite trend for droplet
Scientific Reports | (2021) 11:4617 | https://doi.org/10.1038/s41598-021-84245-2 6
Vol:.(1234567890)www.nature.com/scientificreports/
Figure 6. Droplet dispersion (side and top-down views) from a single cough inclined downwards at 27.5°
for non-evaporative (top) and evaporative (bottom) cases at relative humidity of 60%. Listener is 2 m away
facing Cougher. Color bar indicates droplet sizes (2–100 µm). Vertical lines are spaced 1 m apart and arrows
are drift markers based on a background wind speed of 0.3 m/s. Ambient air temperature is 25 °C and breath
temperature is 36 °C. Plume angles 14–10° from the chest level and lateral dispersion fits a 20° forward wedge.
Figure 7. Droplet and virus deposition on the surfaces of the Listener model, including body (1.43 m
2),
mouth (3.5 cm2) and mask (288 cm2). (A) Droplet deposition count probability. Modes: 8–16 µm (body; 1 m),
16–24 µm (body; 2 m) and 4–8 µm (mouth/mask). (B) Median viral deposition count probability (3.3 × 10⁶
copies/mL)46. Modes: 32–40 µm (body; 1 m) and 24–32 µm (body; 2 m). Inset shows viral deposition count
probabilities for mouth and mask. Mode: 16–24 µm (mouth/mask; 1 m). For 1 m distancing, the total deposited
viral counts on the Listener model are 25.3 (body), 0.55 (mouth) and 0.72 (mask).
Scientific Reports | (2021) 11:4617 | https://doi.org/10.1038/s41598-021-84245-2 7
Vol.:(0123456789)www.nature.com/scientificreports/
counts (8–16 µm at 1 m; 16–24 µm at 2 m). This is because large droplets 32–75 µm settle preferentially at dis-
tance 1–2 m, leading to significant reductions in viral counts. Total deposited viral counts are 25.3 viral copies
on the Listener’s body, 0.72 on mask, and 0.55 on mouth (inhaled). The projected inhalation exposure increases
to 9.3 copies for day-0 viral load (5.7 × 10⁷ copies/mL)47, up to 390 copies at peak loading (2.35 × 10⁹ copies/
mL)48. Increasing distancing to 2 m results in significant reductions in viral deposition counts on the body and
transmission risks from droplet inhalation.
Discussion and conclusion
Young children may be at greater risk from droplet transmission compared to adults (Fig. 1). Inspection of the
droplet plume shows maximum droplet count densities at characteristic heights at 1.2 m for 1 m distancing, and
1.0 m for 2 m. A useful guideline for height-related risk would be within a height difference of 50 cm at a distance
of 1 m, and 70 cm a distance of 2 m, depending on the height of the Cougher.
In this model, we define airborne droplets as 8–16 µm in diameter, and droplets as 32–40 µm in diameter,
which may potentially be more infectious due to higher viral content (Fig. 2). Nevertheless, we point out that
aerosol sampling studies have reported more viral copies collected from fine particles (< 5 µm) than coarse
(> 5 µm) ones, so droplet size alone may not be the best indicator of airborne viral i nfectiousness54,55, and sev-
eral studies have shown that viral copy numbers may be higher in smaller particles, such as aerosols56. Surgical
masks are known to be effective at trapping these larger droplets, so they are recommended for use as necessary55.
However, it is important to note that the loose-fitting surgical masks (i.e. they are not fit-tested) are less effective
at protecting the wearer from aerosols because they can be inhaled from around the side of the mask, rather than
the mask failing to capture them d irectly57.
Our results suggest that social distancing is generally effective at reducing droplet counts across all droplet
sizes. Specifically, an increase in distancing from 0.5 to 1 m significantly reduces potential exposure to large drop-
lets greater than 75 µm, and further increase in distancing to 2 m further halves the transmission potential across
all droplet sizes. Understanding the infectious dose of SARS-CoV-2 is essential to quantitative risk assessment.
Under low humidity conditions, small droplets evaporate rapidly in a fraction of a second, whereas mod-
erately large droplets can persist over a few seconds and remain airborne (Fig. 3). Evaporated droplet residues,
or nuclei, contain high viral densities and present long ranged airborne transmission risks. Smaller and lighter,
these droplet nuclei contain viral residues in a compact form and could remain airborne for long period of time,
projecting transmission risks over long distances. The effect of desiccation on the viability of SARS-CoV-2 found
in droplet nuclei is currently not well understood.
Interesting aerodynamics come into play when a person obstructs the airflow downstream from the cough
(Fig. 4). Counter-intuitively, the person being 1 m away from the cough may not only fail to obstruct the plume
itself, but instead enhance its dispersion range further downstream. This suggests that a 1 m distancing rule
between individuals in a queue may have adverse consequences.
The airflow result for 1 m distancing also has practical consequences for face shield users. Based on our mod-
elling results, the droplet plume for a person at 1 m follows the air flow over the chest (Fig. 5), so the droplets
reach the face region from a bottom-up direction which circumvents the face shield. Therefore, the face shield
may be ineffective as a protection against droplets based on aerodynamic considerations. An improvement to
the face shield design could be a chin plate that prevents air flow from the chest upwards; air could instead be
drawn in from the back of the head around the sides.
Based on median viral load, an average of 0.55 viral copies is inhaled 1 m away from a single cough. This
result could still be amplified through successive coughs at higher viral loads (day-0 or peak) and accumulated
over time. Other air sampling s tudies58–60 have reported comparable viral counts, accounting for sampling times
and flowrates. Droplets deposited on skin and clothes could still lead to secondary transmission modes such as
face touching.
The present study has several limitations. First, the cough model is idealized. The droplet size distribution is
based on 22 cough tests and measurements of some 3,000 droplets captured on slides44 and the cough airflow
based on 25 test subjects44. These sources, while representative, do not account for significant variations in
coughing intensity and d uration61s, droplets emitted through vocalization and sneezes are not considered in
this study. Third, the height of the Cougher can affect the dispersive range of droplets, especially larger droplets
which tend to settle rapidly on emission. This effectively increases the droplet transmission potential from taller
infected persons. Fourth, a light prevailing wind with constant speed is assumed for indoor conditions, but wind
speed significantly affects the dispersion range of droplet. Under outdoor conditions, wind speeds can reach up
to several meters per second, leading to dispersion ranges that exceed currently accepted social distances even
under strongly evaporative c onditions41. Fifth, this study does not distinguish between viable and non-viable
viruses, only viral count and load. Sixth, the evaporation physics used here is based on weak coupling between
droplets, so droplets evaporate rapidly into smaller droplet nuclei which persists airborne. Droplet evaporation
with non-volatile content is included in separate study46.
From our data, we conjecture that the concept of “airborne” or “droplet” transmission as applied to a res-
piratory pathogen may be relative. Physical factors, such as wind speed and direction, interact with biological
ones, such as infectious dose, to determine the likelihood with which the coughing sick infect others in their
immediate vicinity.
Data availability
The datasets generated during and/or analyzed during the current study are available from the corresponding
author on reasonable request.
Scientific Reports | (2021) 11:4617 | https://doi.org/10.1038/s41598-021-84245-2 8
Vol:.(1234567890)www.nature.com/scientificreports/
Received: 5 August 2020; Accepted: 8 February 2021
References
1. Wang, D. et al. Clinical characteristics of 138 hospitalized patients with 2019 novel coronavirus-infected pneumonia in Wuhan,
China. JAMA 323(11), 1061–1069 (2020).
2. Asadi, S., Bouvier, N., Wexler, A. S. & Ristenpart, W. D. The coronavirus pandemic and aerosols: Does COVID-19 transmit via
expiratory particles?. Aerosol Sci. Technol. 54(6), 635–638 (2020).
3. Peng, X. et al. Transmission routes of 2019-nCoV and controls in dental practice. Int. J. Oral Sci. 12(1), 1–6 (2020).
4. Morawska, L. & Cao, J. Airborne transmission of SARS-CoV-2: The world should face the reality. Environ. Int. 139, 105730 (2020).
5. Chia, P. Y. et al. Detection of air and surface contamination by SARS-CoV-2 in hospital rooms of infected patients. Nat. Commun.
11(1), 1–7 (2020).
6. Pica, N. & Bouvier, N. M. Environmental factors affecting the transmission of respiratory viruses. Curr. Opin. Virol. 2(1), 90–95
(2012).
7. Van Doremalen, N. et al. Aerosol and surface stability of SARS-CoV-2 as compared with SARS-CoV-1. N. Engl. J. Med. 382(16),
1564–1567 (2020).
8. Booth, T. F. et al. Detection of airborne severe acute respiratory syndrome (SARS) coronavirus and environmental contamination
in SARS outbreak units. J. Infect. Dis. 191(9), 1472–1477 (2005).
9. Shen, Y. et al. Community outbreak investigation of SARS-CoV-2 transmission among bus riders in eastern China. JAMA https
://doi.org/10.1001/jamainternmed.2020.5225 (2020).
10. Lu, J. et al. COVID-19 outbreak associated with air conditioning in restaurant, Guangzhou, China, 2020. Emerg. Infect. Dis. 26(7),
1628–1631 (2020).
11. Hamner, L. et al. High SARS-CoV-2 attack rate following exposure at a choir practice—Skagit County, Washington, March 2020.
Morbid. Mortal Wkly Rep. 69(19), 606–610 (2020).
12. Miller, S. L. et al. Transmission of SARS-CoV-2 by inhalation of respiratory aerosol in the Skagit Valley Chorale superspreading
event. Indoor Air https://doi.org/10.1111/ina.12751 (2020).
13. Park, S. Y. et al. Coronavirus disease outbreak in call center South Korea. Emerg. Infect. Dis. 26(7), 1666–1670 (2020).
14. Lindsley, W. G., Reynolds, J. S., Szalajda, J. V., Noti, J. D. & Beezhold, D. H. A cough aerosol simulator for the study of disease
transmission by human cough-generated aerosols. Aerosol Sci. Technol. 47(8), 937–944 (2013).
15. Bourouiba, L., Dehandschoewercker, E. & Bush, J. W. Violent expiratory events: on coughing and sneezing. J. Fluid Mech. 745,
537–563 (2014).
16. Chartier, Y. & Pessoa-Silva, C. L. Natural Ventilation for Infection Control in Health-Care Settings (World Health Organization,
Geneva, 2009).
17. Milton, D. K. A rosetta stone for understanding infectious drops and aerosols. J. Pediat. Inf. Dis Soc. 9(4), 413–415 (2020).
18. Tellier, R., Li, Y., Cowling, B. J. & Tang, J. W. Recognition of aerosol transmission of infectious agents: A commentary. BMC Infect.
Dis. 19(1), 101 (2019).
19. Kutter, J. S., Spronken, M. I., Fraaij, P. L., Fouchier, R. A. & Herfst, S. Transmission routes of respiratory viruses among humans.
Curr. Opin. Virol. 28, 142–151 (2018).
20. Fernstrom, A. & Goldblatt, M. Aerobiology and its role in the transmission of infectious diseases. J. Pathog. https://doi.
org/10.1155/2013/493960 (2013).
21. Ferguson, N. et al. Report 9: Impact of non-pharmaceutical interventions (NPIs) to reduce COVID-19 mortality and healthcare
demand (Imperial College COVID-19 Response Team, March 16 2020).
22. Huang, J. et al. Optimal temperature zone for the dispersal of COVID-19. Sci. Total Environ. https://doi.org/10.1016/j.scito
tenv.2020.139487 (2020).
23. Huang, J. et al. Global prediction system for COVID-19 pandemic. Sci. Bull. https://doi.org/10.1016/j.scib.2020.08.002 (2020).
24. Koo, J. R. et al. Interventions to mitigate early spread of SARS-CoV-2 in Singapore: A modelling study. Lancet. Infect. Dis 20(6),
678–688 (2020).
25. Kelso, J. K., Milne, G. J. & Kelly, H. Simulation suggests that rapid activation of social distancing can arrest epidemic development
due to a novel strain of influenza. BMC Public Health 9(1), 117 (2009).
26. Wells, W. F. On air-borne infection: Study II. Droplets and droplet nuclei. Am. J. Epidemiol. 20(3), 611–618 (1934).
27. Bourouiba, L. Turbulent gas clouds and respiratory pathogen emissions: Potential implications for reducing transmission of
COVID-19. JAMA 323(18), 1837–1838 (2020).
28. Guo, Z. et al. Aerosol and surface distribution of severe acute respiratory syndrome coronavirus 2 in hospital wards, Wuhan, China.
Emerg. Infect. Dis. 26(7), 1583–1591 (2020).
29. Sen-Crowe, B., McKenney, M. & Elkbuli, A. Social distancing during the COVID-19 pandemic: Staying home save lives. Am. J.
Emerg. Med. 38, 1515–1539 (2020).
30. Bahl, P. et al. Airborne or droplet precautions for health workers treating coronavirus disease 2019?. J. Infect. Dis. https://doi.
org/10.1093/infdis/jiaa189 (2020).
31. Mittal, R., Ni, R. & Seo, J. The flow physics of COVID-19. J. Fluid Mech. 894, F2. https://doi.org/10.1017/jfm.2020.330 (2020).
32. Ai, Z. T. & Melikov, A. K. Airborne spread of expiratory droplet nuclei between the occupants of indoor environments: A review.
Indoor Air 28(4), 500–524 (2018).
33. Wei, J. & Li, Y. Enhanced spread of expiratory droplets by turbulence in a cough jet. Build. Environ. 93, 86–96 (2015).
34. Tang, J. W., Liebner, T. J., Craven, B. A. & Settles, G. S. A schlieren optical study of the human cough with and without wearing
masks for aerosol infection control. J. R. Soc. Interface 6(6), S727-736 (2009).
35. Tang, J. W. et al. Airflow dynamics of coughing in healthy human volunteers by shadowgraph imaging: An aid to aerosol infection
control. PLoS ONE 7(4), e34818 (2012).
36. VanSciver, M., Miller, S. & Hertzberg, J. Particle image velocimetry of human cough. Aerosol Sci. Technol. 45(3), 415–422 (2011).
37. Zhu, S., Kato, S. & Yang, J. H. Study on transport characteristics of saliva droplets produced by coughing in a calm indoor environ-
ment. Build. Environ. 41(12), 1691–1702 (2006).
38. Fluent AN. 13.0 Theory guide, turbulence. ANSYS Inc. 2010.
39. Nielsen, P. V. Fifty years of CFD for room air distribution. Build. Environ. 91, 78–90 (2015).
40. Yang, L., Li, X., Yan, Y. & Tu, J. Effects of cough-jet on airflow and contaminant transport in an airliner cabin section. J. Comput.
Multiphase Flows 10(2), 72–82 (2018).
41. Dbouk, T. & Drikakis, D. On coughing and airborne droplet transmission to humans. Phys. Fluids 32(5), 053310 (2020).
42. Chaudhuri, S., Basu, S., Kabi, P., Unni, V. R. & Saha, A. Modeling the role of respiratory droplets in Covid-19 type pandemics.
Phys. Fluids 32(6), 063309 (2020).
43. Atmar, R. L. et al. Determination of the 50% human infectious dose for Norwalk virus. J. Infect. Dis. 209(7), 1016–1022 (2014).
44. Gupta, J. K., Lin, C. H. & Chen, Q. Flow dynamics and characterization of a cough. Indoor Air 19(6), 517–525 (2009).
45. Duguid, J. P. The size and the duration of air-carriage of respiratory droplets and droplet-nuclei. Epidemiol. Infect. 44(6), 471–479
(1946).
Scientific Reports | (2021) 11:4617 | https://doi.org/10.1038/s41598-021-84245-2 9
Vol.:(0123456789)www.nature.com/scientificreports/
46. Li, H. et al. Dispersion of evaporating cough droplets in tropical outdoor environment. Phys. Fluids 32, 113301 (2020).
47. To, K. K. et al. Consistent detection of 2019 novel coronavirus in saliva. Clin. Infect. Dis. https: //doi.org/10.1093/cid/ciaa14 9 (2020).
48. Wӧlfel, R. et al. Virological assessment of hospitalized patients with COVID-2019. Nature 581, 465–469 (2020).
49. Basu, S. Close-range exposure to a COVID-19 carrier: transmission trends in the respiratory tract and estimation of infectious
dose. medRxiv https://doi.org/10.1101/2020.07.27.20162362 (2020).
50. Darquenne, C. Aerosol deposition in health and disease. J. Aerosol Med. Pulmonary Drug Deliv. 25(3), 140–147 (2012).
51. Tang, J. W. & Settles, G. S. Coughing and aerosols. N. Engl. J. Med. 359, e19 (2008).
52. Tang, J. W., Liebner, T. J., Crazen, B. A. & Settles, G. S. A schlieren optical study of the human cough with and without wearing
masks for aerosol infection control. J. R. Soc. Interface 6, 727–736 (2009).
53. VanSciver, M., Miller, S. & Hertzberg, J. Particle image velocimetry of human cough. Aerosol Sci. Technol. 45, 415–422 (2011).
54. Yan, J. et al. Infectious virus in exhaled breath of symptomatic seasonal influenza cases from a college community. PNAS 115(5),
1081–1086 (2018).
55. Milton, D. K., Fabian, M. P., Cowling, B. J., Grantham, M. L. & McDevitt, J. J. Influenza virus aerosols in human exhaled breath:
Particle size, culturability, and effect of surgical masks. PLoS Pathog. 9(3), e1003205 (2013).
56. Yang, W., Elankumaran, S. & Marr, L. C. Concentrations and size distributions of airborne influenza A viruses measured indoors
at a health centre, a day-care centre and on aeroplanes. J. R. Soc. Interface 8(61), 1176–1184 (2011).
57. Tcharkhtchi, A. et al. An overview of filtration efficiency through the masks: Mechanisms of the aerosols penetration. Bioactive
Mater. 6(1), 106–122 (2020).
58. Kulkarni, H. et al. Evidence of respiratory syncytial virus spread by aerosol. Time to revisit infection control strategies?. Am. J.
Respir. Crit. Care Med. 194, 308–316 (2016).
59. Bischoff, W. E., Swett, K., Leng, I. & Peters, T. R. Exposure to influenza virus aerosols during routine patient care. J. Infect. Dis.
207(7), 1037–1046 (2013).
60. Tang, J. W., Kalliomaki, P., Varila, T. M., Waris, M. & Koskela, H. Nebulisers as a potential source of airborne virus. J. Infect. 81(4),
647–679 (2020).
61. Xie, X., Li, Y., Sun, H. & Liu, L. Exhaled droplets due to talking and coughing. J. R. Soc. Interface 6, S703-714 (2009).
Author contributions
H.Y.L. and G.X. ran the simulations. F.Y.L. and H.Y.L. wrote the manuscript. F.Y.L. interpreted and organized
data. C.W.K. and K.H.L. initiated and designed the study. B.H.T. and C.M.L. advised the study and proofread
the manuscript. All authors reviewed the manuscript.
Competing interests
The authors declare no competing interests.
Additional information
Supplementary Information The online version contains supplementary material available at https://doi.
org/10.1038/s41598-021-84245-2.
Correspondence and requests for materials should be addressed to F.Y.L.
Reprints and permissions information is available at www.nature.com/reprints.
Publisher’s note Springer Nature remains neutral with regard to jurisdictional claims in published maps and
institutional affiliations.
Open Access This article is licensed under a Creative Commons Attribution 4.0 International
License, which permits use, sharing, adaptation, distribution and reproduction in any medium or
format, as long as you give appropriate credit to the original author(s) and the source, provide a link to the
Creative Commons licence, and indicate if changes were made. The images or other third party material in this
article are included in the article’s Creative Commons licence, unless indicated otherwise in a credit line to the
material. If material is not included in the article’s Creative Commons licence and your intended use is not
permitted by statutory regulation or exceeds the permitted use, you will need to obtain permission directly from
the copyright holder. To view a copy of this licence, visit http://creativecommons.org/licenses/by/4.0/.
© The Author(s) 2021
Scientific Reports | (2021) 11:4617 | https://doi.org/10.1038/s41598-021-84245-2 10
Vol:.(1234567890)You can also read