An Examination of COVID-19 Clusters in NYC - Tri-State ...
←
→
Page content transcription
If your browser does not render page correctly, please read the page content below
An Examination of COVID-19 Clusters in NYC
CONTENTS

INTR O D UC T I ON                    3

APPR OAC H                            7

ANALYSI S                             8

GEOGRAPHIC DISTRIBUTION               11
COVID-19 Clusters                    12
Ridership Distribution               14
Mitigation Measures                  17

CONC LUSI O N                        22

APPEN D I X                          25

GEOGRAPHIC ANALYSIS METHODS          25

THE TRANSIT INNOVATION PARTNERSHIP   27

END NOT E S                          29
Copyright TSTC March 2021

                             Authored by
                           Miranda Adams
                             Kevin Garcia
                           Darwin Keung
                         Felicia Park-Rogers

                             Edited by
                            Liam Blank
                           Nick Sifuentes

                            Designed by
                            Isobel Cully

                   ACKNOWLEDGEMENTS

                    Thank you to our reviewers:

                          Toph Allen, MPH
                    Software Engineer, RStudio;
          formerly Senior Data Scientist, EcoHealth Alliance

                         John J. Chin, Ph.D.
      Professor and Director, Master of Urban Planning Program
              Department of Urban Policy and Planning
          Hunter College of the City University of New York

                        Jeremy R. Porter, Ph.D.
   Professor of Sociology and Director of the Quantitative Methods
                     City University of New York

        A special thanks to the Transit Innovation Partnership
                  for their assistance on this report.

Our work is supported by funding from The New York Community Trust.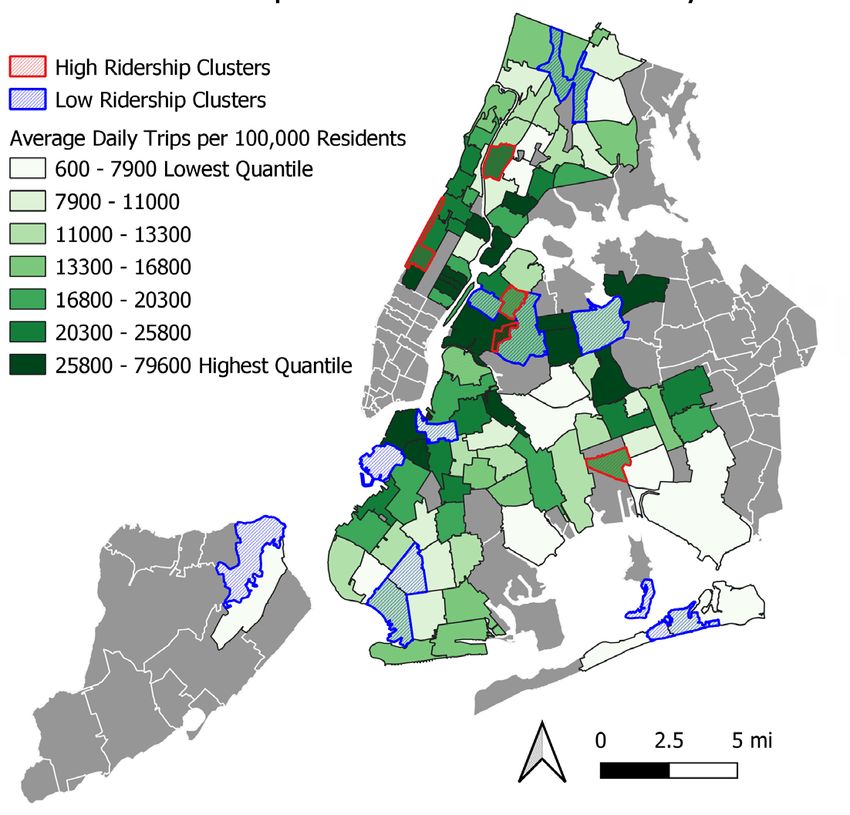
INTRODUCTION

Commuters, elected officials, and business leaders have expressed concerns
about the safety of riding public transit since March 2020, when the
COVID-19 pandemic forced the New York City region to shut down non-
essential business and travel. Recent public debate is largely centered on
how to best keep transit fleets clean, reduce overcrowding, and enforce mask
mandates.

Paranoia over the city’s subway system acting as a superspreader of the
coronavirus is fueling misinformation about the risks of riding transit,
which could have long-term implications for regional travel behavior and
the cash-strapped Metropolitan Transportation Authority. The pandemic
wiped out the MTA’s traditional funding streams (tolls, taxes, and fares),
which means riders can expect service cuts and fare hikes in the near future,
especially if ridership levels do not quickly—and safely—rebound. Given the
MTA’s dependence on a positive public perception for attracting riders and
generating revenue, it’s crucial that the risks of riding transit are based on the
most recent science, not speculation.

No other city in the country has a transit system as robust as New York City’s,
or such a high percentage of the population depending on public transit as
a primary mode of travel. At the height of the pandemic last spring, bus and
subway ridership plummeted from 8 million daily trips to less than a million.
Throughout the summer and fall, the city managed to keep transmission rates
low, yet transit ridership rebounded only slightly, holding steady at roughly 3
million daily trips. The remaining riders include many essential and frontline
workers who continue to travel to work and help combat the spread of the
virus, allowing many others in the workforce to work remotely and still have
access to essential services.

                                         TRACKING COVID-19 AND TRANSIT          4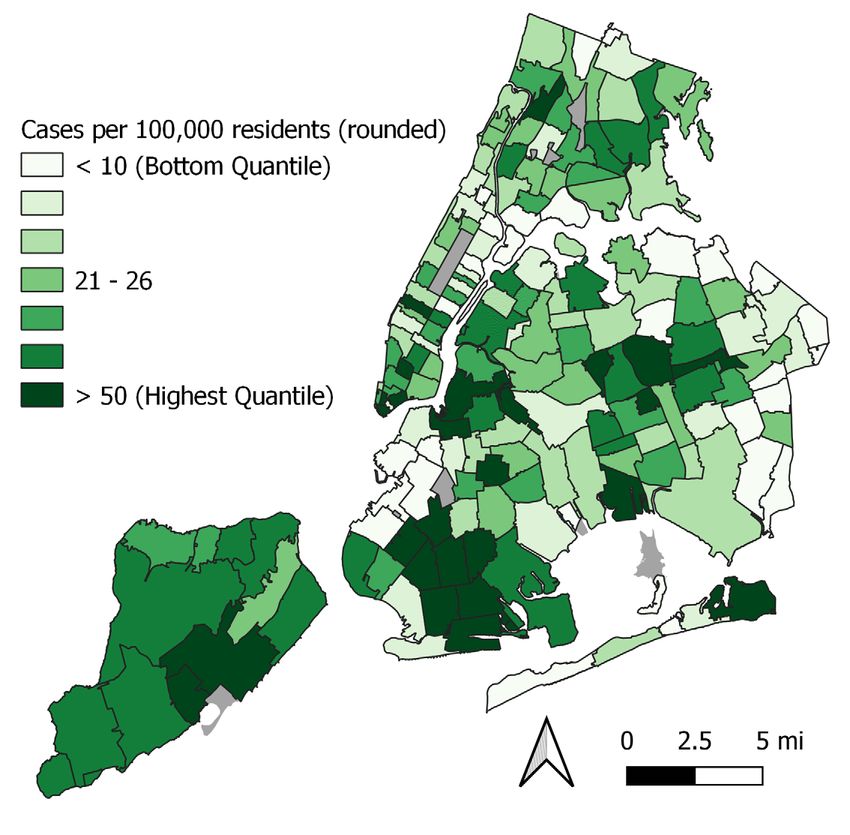
During the low-transmission period, the city relaxed some of its restrictions,
which allowed most non-essential businesses to reopen once proper public
health measures were implemented. For the MTA’s part, the authority is
conducting frequent and thorough cleanings of transit fleets and stations,
has implemented a mask mandate for riders, installed safety barriers for bus
drivers, and reduced the maximum passenger capacity on buses.1 Transit
ridership increased as many people went back to work, however COVID-19
infections did not.2

                                                                 When cases began to climb
                                                                 again in the fall of 2020, data
                                                                 from New York’s contact
                                                                 tracing program reported that
                                                                 70% of new COVID-19 cases
                                                                 occurred from households
                                                                 and small gatherings, whereas
                                                                 less than 0.96 percent came
                                                                 from public or private transit.3
                                                                 This is consistent with contact
                                                                 tracing results from France,
                                                                 where only 1% out of 531
Figure 1. Rates of a respiratory infectious disease such as flu/
pneumonia are actually lower in areas with high proportions
                                                                 clusters traced back to a
of transit commuters. This suggests that the possibility that    mode of transportation, a
coronavirus data, another such respiratory infectious disease,
could follow a similar trend.
                                                                 category that includes public
                                                                 transit, airplanes, boats, and
cars. Furthermore, a recent NYU study looking at data from 121 cities found
       4

no evidence of a positive relationship between public transit usage and
influenza/pneumonia mortality rates of the city (figure 1), suggesting that
“population level rates of transit use are not a singularly important factor in
the transmission of influenza.”5

While it is challenging to conclusively prove there is absolutely no elevated
risk of COVID-19 outbreaks due to transit use, this report aims to show that
transit systems are not a major source of person to person transmission of
coronavirus with proper precautions in place (ubiquitous mask compliance,

                                                 TRACKING COVID-19 AND TRANSIT                  5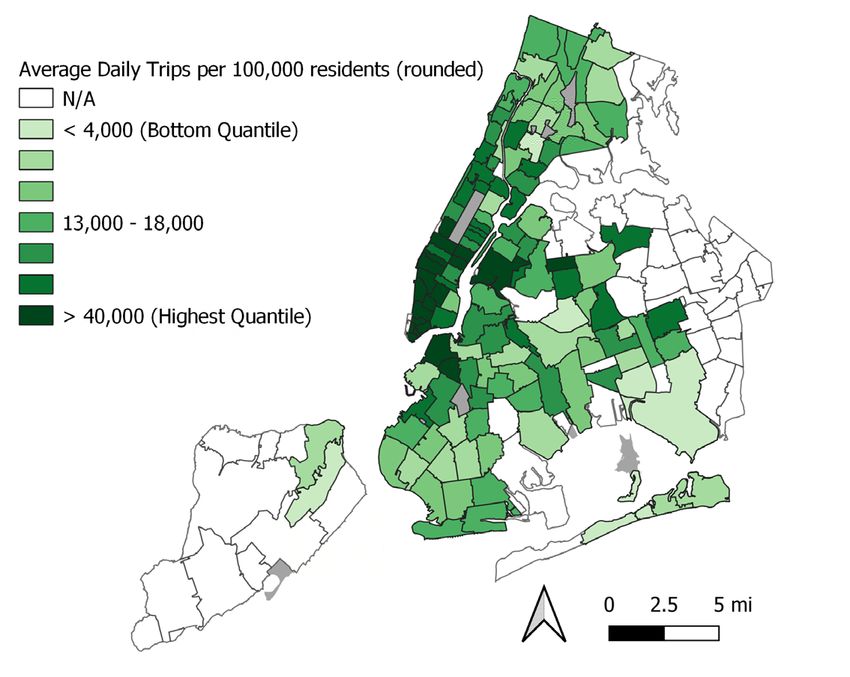
sufficient ventilation and air filtration systems, and lack of crowding). To
further assess the safety of New York City’s transit system, we examined
ridership and case patterns from the beginning of the micro-cluster strategy
that Governor Cuomo announced on October 6, 2020. 6 The Governor’s
strategy identified clusters of cases and designated Red, Orange, and Yellow
levels of restrictions based on case levels, with Red Zones having the highest
case rate and therefore the tightest restrictions.
When looking at these microclusters in Brooklyn and Queens (figure 2)
we can determine if ridership is a driving factor behind spikes of the novel
coronavirus by comparing subway turnstile data with rates of COVID cases
throughout the city.
Type of
Activity
RED ORANGE YE L LOW
Worship 25% capacity 33% capacity 50% capacity
Mass Gathering Prohibited 10 people max 25 people max
Closing high-risk
Only essential
Businesses non-essential Open
businesses open
businesses
Outdoor dining Indoor and outdoor
Dining Takeout only only, 4 person max dining, 4 person
per table max per table
Schools Closed Closed Open
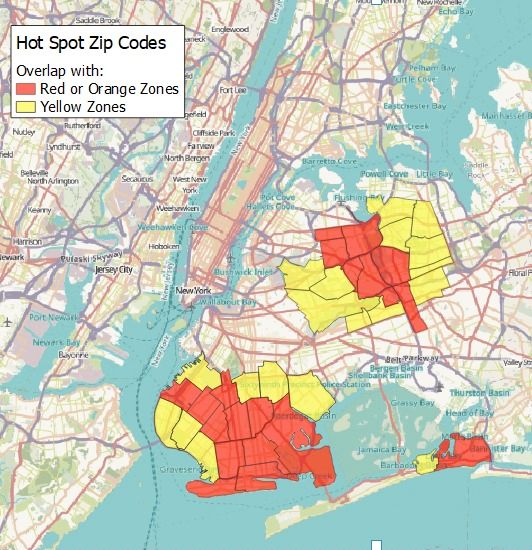
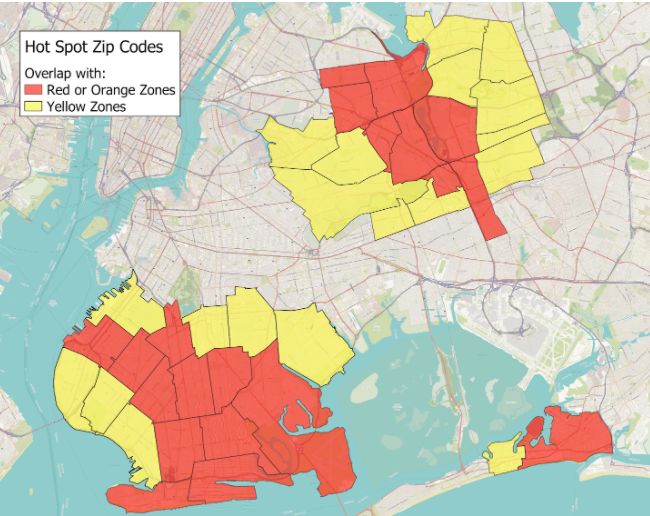
Figure 2: Approximation of zip codes in the restricted areas on 10/8/2020. This approximates which zip
codes overlap with the Governor’s targeted zones, with red representing zip codes overlapping with Red and
Orange Zones, and yellow indicating those zip codes overlapping with Yellow Zone restrictions summarized in
the table above.
If public transit were a major factor in the spread of the novel coronavirus,
we would expect to see sustained higher rates of transmission in areas
with significant transit use and lower rates in places with little or no transit
ridership. This is simply not the case—COVID-19 rides the air, not the subway.
TRACKING COVID-19 AND TRANSIT 6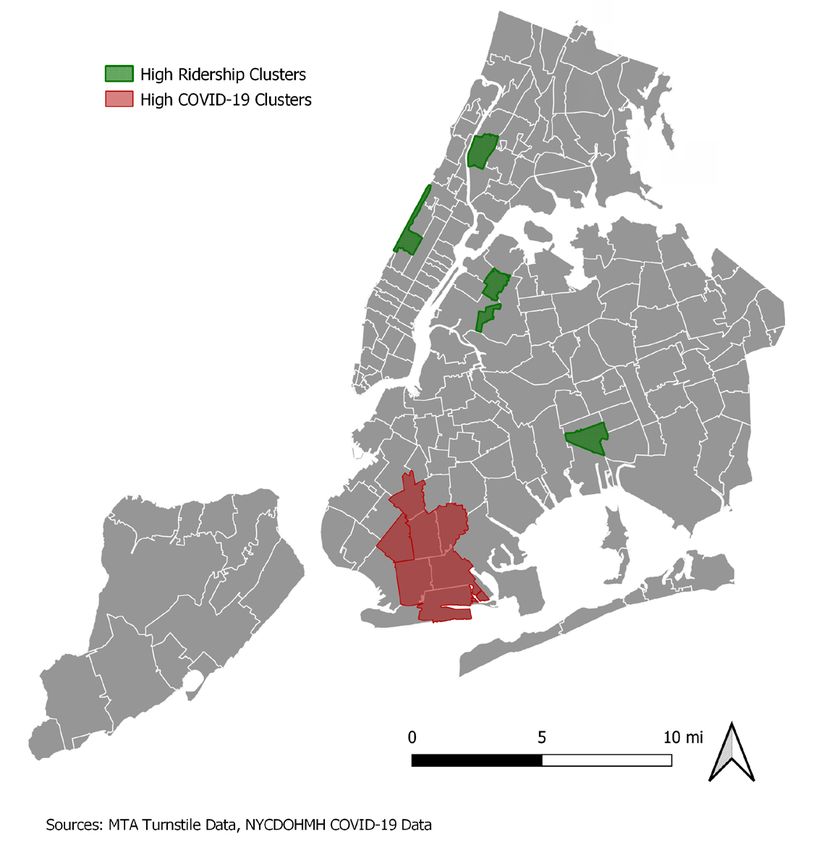
APPROACH

To conduct this study, we utilized public datasets from two sources: the
Metropolitan Transportation Authority and the New York City Department
of Health. We used the turnstile entry counts from the MTA as a proxy for
ridership: while these counts exclude anyone who evades the fare, they will
record someone’s trip in both directions and work well to illustrate relative
changes in subway usage over time. We compared this ridership data to the
New York City Department of Health’s coronavirus dataset, which includes
daily cases, hospitalizations, deaths, and other relevant data broken down by
borough. For our geographic analysis, we calculated weekly subway turnstile
averages to establish high traffic station totals within NYC neighborhoods,
defined by modified Zip Code Tabulation Areas used by the NYC Department
of Health for their case number reports.

For the analysis, we focused on the microclusters in New York City
preceding the fall season’s spike in cases, as identified by Governor Cuomo
on October 8, 2020. These microclusters were geographically defined by
streets and addresses that we approximated to predefined geographies
such as neighborhoods and zip codes. In order to complete an analysis,
we approximated the zip codes that contained hotspot clusters. The
ridership analysis focused on the two weeks preceding the October 8th
announcement, during the buildup of the local cases in the hotspot. Focusing
on these hotspots and this time period just before the start of the winter
spike of COVID-19 cases allowed us to avoid certain confounding factors from
increased indoor gatherings. Indoor dining had just restarted on September
30, 2020, so any cases spread through restaurants are likely not reflected in
the case numbers until one or two weeks into October. Examining this time
period in late September also precedes the holiday season where household
“living room spread” have contributed to roughly 74% of cases in New York,
according to Governor Cuomo’s December 11, 2020 press conference.7

                                       TRACKING COVID-19 AND TRANSIT        7
ANALYSIS
There has been little relation, temporally or spatially, between subway use
and identified COVID-19 cases in New York City. The following graphs depict
turnstile entries and COVID-19 case counts from February 29th to October
31st. The blue highlights on each graph show the period of September 13th
to October 8th, the two-week period leading up to the announcement of the
hotspots.
As shown in Figure 3, subway ridership plummeted in early March as a vast
majority of daily subway commuters began to work from home or lost work
entirely. Once restrictions began to lift, ridership began increasing again, and
there was a slow but steady upwards trajectory which essentially plateaued at
a ridership rate of approximately 70% of normal across the system beginning
in the summer of 2020. Despite the increased ridership, coronavirus cases
remained low until winter. Figure 4 depicts the COVID-19 case count for the
entire city: after the spring peak, cases stayed relatively low throughout the
summer. Case numbers then began rising again in late September and early
October, leading to hotspot restrictions being announced on October 8th.
In the two weeks leading up to Governor Cuomo announcing the COVID-19
hotspots and related restrictions, there was nothing particularly different
about ridership that would indicate an anticipated increase in Coronavirus
cases. Data from the MTA indicates that proper mask usage on transit during
this time period averaged around 82%.
TRACKING COVID-19 AND TRANSIT 8NYC RIDERSHIP AND COVID-19 CASES AT A GLANCE
Rolling 7-Day Average Turnstile Counts
Analysis period
Figure 3: After an initial
steep drop in subway
ridership, trips have
been slowly but steadily
increasing since mid-April.
There was no change in
this trend in the two-week
period leading up to the
hotspot restrictions.
Rolling 7-Day Average COVID-19 Cases
Analysis period
Figure 4: COVID-19 case
numbers in New York
peaked in early April, then
declined dramatically
and stayed relatively low
throughout the summer
despite steadily increasing
subway ridership starting
in mid-April. Case numbers
then began rising again
in late September and
early October, leading to
hotspot restrictions being
announced on October 8th.
TRACKING COVID-19 AND TRANSIT 9While these numbers provide context for total cases and ridership in New
York City, COVID-19 is a disease that demonstrates stark geographical
distinctions. As such, citywide aggregates can often obscure other trends and
factors. Figures 5 and 6 show turnstile entries and COVID-19 cases broken
down by borough. The worst devastation during the peak of the pandemic
in New York City occurred in low-income communities and communities of
color that are home to many essential workers. By contrast, in the borough
of Manhattan, wealthier commuters largely ceased riding public transit when
lockdowns began. When cases began to rise again in September, they were
mainly concentrated in Queens and Brooklyn, despite subway ridership
increasing most in Manhattan. The cultural and socioeconomic differences
between boroughs must be taken into account when understanding the
prevalence of COVID-19 in each area.
Rolling 7-Day Average Turnstile Counts
Figure 5: Other than in Staten Island, which does not have any subway stations, each borough showed similar
trends as the city as a whole. Manhattan had the most trips before the pandemic, saw the steepest drop, and
by October had significantly higher station traffic than the other boroughs.
Rolling 7-Day Average COVID-19 Cases
Figure 6: All of the boroughs had steadily low case counts throughout the summer, and all but Staten Island
began to see increases in the fall. The increase in cases in the weeks leading up to the hotspot restrictions
was most pronounced in Brooklyn, followed by Queens, where the restrictions were placed.
TRACKING COVID-19 AND TRANSIT 10Subway ridership and stations are not evenly distributed throughout the
city, so even borough-level aggregations can obscure whether or not a
relationship exists between subway ridership and COVID-19. Therefore, we
mapped the geographic distribution of cases and station activity to further
examine the relationship between station activity and COVID-19 cases.
GEOGRAPHIC DISTRIBUTION OF COVID-19 AND RIDERSHIP
In order to get a better sense of spatial relationships between subway use
and COVID-19 cases, we took the turnstile counts for individual stations and
compared them to the COVID-19 hotspots8 Governor Cuomo singled out
for October 8th restrictions under guidance issued via Executive Order No.
202.68 (Figures 7a to 7c). We identified the zip codes that were within or
intersected with the designated hotspots (Figure 2) because the clusters
the Governor identified did not align with any established geographical
boundaries. We use the assumption that people will utilize the subway
stations based in their home neighborhoods, and that anyone coming from
other areas of the city could also potentially bring the virus there. Therefore,
stations that see high ridership would indicate that many residents use the
subway, and subway riders travel to those neighborhoods.
Our findings show that neighborhoods with higher case
rates are not associated with high ridership stations.
Conversely, areas that contain busy subway stations do
not have disproportionate numbers of COVID-19 cases.
This strongly suggests that COVID-19 outbreaks bear very
little to no relation to subway ridership.
TRACKING COVID-19 AND TRANSIT 11COVID-19 Clusters
COVID-19 cases tend to propagate in clusters, as shown in figures 5 through
7. New York State health officials began to classify micro-cluster zones in
areas that have high cases as yellow, orange, or red, with red as the most
restricted, as shown in figures 5a through 5c. 9 We overlaid these zones with
zip codes to allow for easier comparisons with other data. Those results are
shown in figure 2.
Our analysis for the week of September 20th to 26th found the same clusters
that the state reported during that month. The area highlighted red (figure
7b) in southern Brooklyn was declared a ‘red zone’ on October 8th, 2020.
Other ZCTA in dark green such as the Rockaways (10/8/2020) and Central
Queens were later declared to be microclusters by the state.
Figure 2: Approximation of
zip codes within the restricted
areas, 10/8/2020.
Brooklyn Cluster Zones
Red Zone
Orange Zone
Yellow Zone
Figure 7a: Targeted restriction cluster in Brooklyn, 10/8/2020. Red is
the epicenter of cases and most restricted area, followed by orange and
yellow as defined by the New York State Governor’s Office.
TRACKING COVID-19 AND TRANSIT 12Figure 2: Approximation of
zip codes within the restricted
areas, 10/8/2020.
Queens Flushing Cluster Zones
Red Zone
Orange Zone
Yellow Zone
Figure 7b: Targeted restriction cluster in near Flushing, Queens,
10/8/2020
Figure 2: Approximation of
zip codes within the restricted
areas, 10/8/2020.
Queens Far Rockaway Cluster Zones
Red Zone
Orange Zone
Yellow Zone
Figure 7c: Targeted restriction cluster in Far Rockaway, Queens
10/8/2020
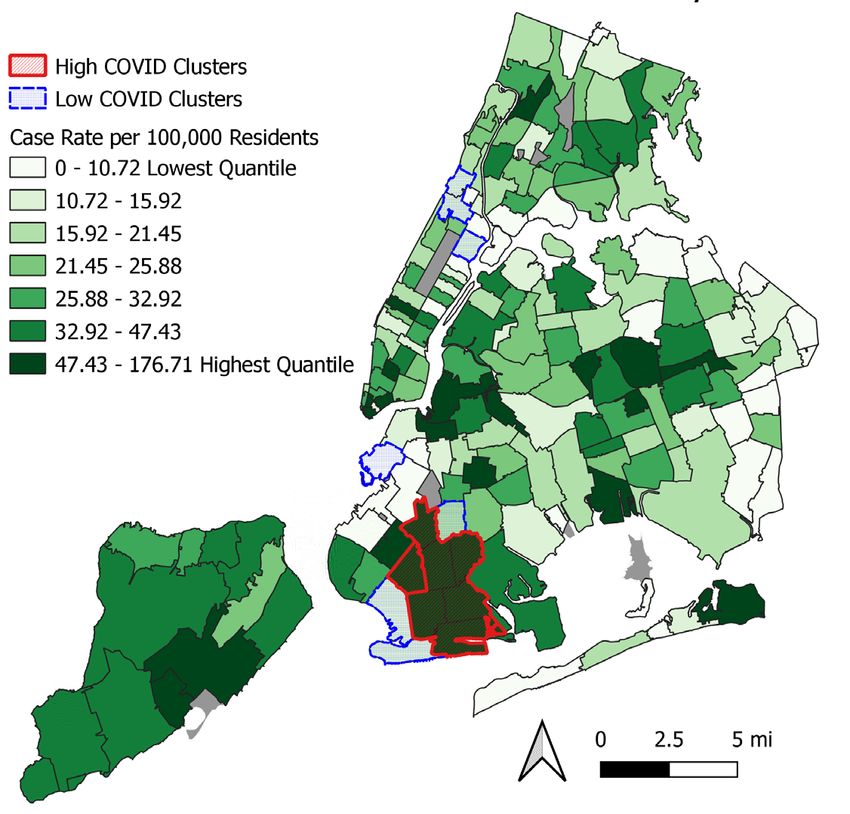
TRACKING COVID-19 AND TRANSIT 13One of the earliest defined micro-clusters appeared in Southern Brooklyn
(highlighted in red in figure 8b) in October 2020. During the week of September
27th, the percentage of people testing positive had reached 6.69 percent.10
COVID-19 Cases in New York City COVID-19 Clusters in New York City
by Zip Code, September 20th-26th 2020
Figure 8a: The total number of confirmed Figure 8b: Areas of high rates of COVID-19 cases
COVID-19 cases per 100,000 residents by modified from the week of September 20th to the 26th.
Zip Code Tabulation Areas (ZCTA), for the week of Statistically significant clusters are outlined red as
September 20th to 26th. areas with high rates of coronavirus. Notable areas
of low rates of coronavirus are outlined in blue. All
clusters are statistically significant (pFor this analysis we focused on ridership outside of Manhattan’s Central Business
District and in the residential areas of New York City. By removing the ridership
from a commuter-heavy destination such as the Central Business District, we can
see more origin trips, specifically trips from a place of residence rather than a
trip from a destination such as a commute back home from the workplace. The
distinction between trips from a residence is necessary to match how COVID
cases are counted—by place of residence. The resulting areas of high ridership
outside the urban core can be found in (figure 9b).
Subway Ridership in New York City COVID-19 Clusters in New York City
by Zip Code, September 20th-26th 2020
Figure 9a: The average daily turnstile count for the Figure 9b: NYC ridership outside of the Central Busi-
week of September 20th to 26th for the subway ness District. Outside the Central Business District
stations within each ZCTA, per 100,000 residents NYC ridership shows areas with high ridership and
in that ZCTA. pockets of statistically significant clustering in neigh-
borhoods (Moran’s I: 0.226). Significant clusters of
ridership are highlighted with high areas in red and
low areas in blue (p-value > 0.05).
TRACKING COVID-19 AND TRANSIT 15A SUMMARY OF COVID-19 CLUSTERS AND RIDERSHIP
COVID-19 Clusters in New York City Clusters of Subway Ridership and COVID-19 COVID-19 Clusters in New York City
cases in New York City
Figure 10a: Areas of high rates of COVID-19 cases from Figure 10b: Clusters of high subway ridership (green) Figure 10c: NYC ridership outside of the Central
the week of September 20th to the 26th. Statistically and high COVID-19 case rates (red). Business District. Outside the Central Business Dis-
significant clusters are outlined red as areas with high There is no geographic overlap of ZCTAs or clusters trict NYC ridership shows areas with high ridership
rates of coronavirus. Notable areas of low rates of of high ridership and high cases in the week ending and pockets of statistically significant clustering in
coronavirus are outlined in blue. All clusters are statis- 9/26/20, one week preceding the announcements of neighborhoods (Moran’s I: 0.226). Significant clusters
tically significant (p 0.05).While ridership is still dramatically lower than the eight million daily riders
seen at the start of 2020, even in the midst of a pandemic, weekday subway
ridership remains at about 1.5 million, according to the MTA estimates.12 Public
transit remains an essential and vital service for residents, from shopping
for essentials to enabling front line workers to providing access to medical
facilities. Thus, while usage has decreased, there is still a substantial amount
of people and potentially vectors for transmission on the system. If riding the
subway is a major risk factor in the transmission of COVID then we would see
a pattern of overlap between high ridership and high cases in our analysis.
However, there is none. To examine why transit might not be a major factor
in transmission, we can look at the mitigation measures taken by transit
agencies and riders to create a safer environment.
Mitigation Measures
A possible reason that ridership activity does not directly reflect case numbers
is due to the significant amount of masking on the system. Transit is actively
seeking ways to keep riders safe by promoting masking, improving filtration,
and seeking out innovative solutions to combat the spread of coronavirus.
Proper usage of masks while on the system is a key factor in risk reduction
for riders, staff, and the public. Mask compliance has remained high since
the summer throughout the MTA’s subway and bus system. Proper mask
usage was around 80 percent of riders at the time of the Brooklyn cluster in
late September and early October, and has improved to nearly 90 percent
during the winter. The MTA reported at their January 21, 2021 board meeting
a positivity rate of 2% among MTA staff, while the rate for NYC as a whole at
that time was around 6%.13 This statistic suggests that mitigation measures
taken by MTA are effective in reducing the risk of transmission in a public
transit environment. Proper masking will continue to play an important role
through the winter peak of cases and the vaccination rollouts.
Transit agencies and public health experts have long advocated for masking
to mitigate person to person transmission and as necessary safety measures.
The prolonged debate over the efficacy of masks under the previous federal
administration, as well as the lack of a federal directive to require masking,
undermined guidance from the CDC and cast doubt on the ability of mask usage
TRACKING COVID-19 AND TRANSIT 17to dramatically slow the spread of COVID. In fact, in October of 2020, the Trump
White House blocked the CDC 14 from requiring masks on public transportation.
Locally, the MTA required masks on transit beginning April 17, 2020.15 In July
2020 the MTA launched its first Mask Force campaign to distribute masks to
riders across the system to stress rider safety and promote mask usage in
the system.16 An executive order requiring passengers to wear face coverings
during interstate travel finally came after President Biden took office.17 On
January 29, 2021 the CDC announced that mask-wearing will be mandatory
across all modes of interstate transportation. It is estimated that this long-
awaited mandate will save 50,000 lives from February to April 2021. Finally,
the federal government’s actions are in line with what the science and local
transit agencies have already known.
While proper mask compliance is a cornerstone to addressing the spread
of COVID-19, transit is also looking to innovation to advance ever safer
and more layered pandemic interventions into our transportation systems.
Technological solutions and recommendations provided in TSTC’s 2020
report, Back on Board: A Guide to Safe(r) Transit in the Era of COVID-19,18
are taking root at the agency level, further spurred by the Transit Innovation
Partnership, a public-private initiative formed by the Metropolitan
Transportation Authority and the Partnership for New York City to incubate
and test solutions that address top-priority challenges posed by COVID-19.
In July 2020, the Transit Innovation Partnership launched The COVID-19
Response Challenge Transit Tech Lab, building on the MTA’s improved
ventilation and mask mandate to combat the virus and to contribute to
riders’ ability to safely return to transit en masse.19 Choosing from a pool of
more than 200 submissions, eight promising technologies were selected for
a rapid proof-of-concept pilot testing over the course of eight weeks. 20 The
proposed solutions include integration of micro-mobility, integrating crowd
size data with station and platform wayfinding, improved air filtration, and
new cleaning methods for facilities, buses and subway cars. Many of these
pilot innovations address primary factors of spread via aerosolization. If
proven effective, they may lead to solutions that build public health resilience
and confidence in transit, as well as improve the overall rider experience.
TRACKING COVID-19 AND TRANSIT 18BUS MAS K COMP LIA N CE SUBWAY MASK COMPL IA N C E
96% 96% 97% 98% 98% 99% 96% 97 % 97 %
95 %
10 0 100 91% 87 %
91%
80 9 0% 92%
8 6% 88% 80 86 % 88%
83% 82%
80%
60 60 73%
66%
40 40
20 20
0 0
7/ 1 3-7/24 8 / 10- 8 /21 9/7- 9/ 18 10/5 -10/ 16 11/2 -1 1 / 1 3 1 1 /30 -1 2 / 1 1 6/ 1 5-7/9 7/27- 8/7 8/24- 9/4 9/2 1 -1 0/2 1 0/ 1 9 -1 0/30 1 1 / 1 6 -1 1 /2 0 1 2 / 1 4-1 2 / 18
Mask worn correctly Total wearing a mask
B U S M AS K COM P LIA N C E
Survey Period No. of Mask worn Mask worn No mask Total wearing
observations correctly incorrectly a mask
11/30-12/11 76,780 92% 7% 1% 99%
11/2-11/13 62,793 90% 8% 2% 98%
10/5-10/16 60,773 88% 10% 2% 98%
9/7-9/18 57,168 86% 11% 3% 97%
8/10-8/21 57,437 83% 13% 4% 96%
7/13-7/24 47,945 n/a* n/a* 4% 96%
S U BWAY M AS K CO M P L I A N C E
Survey Period No. of Mask worn Mask worn No mask Total wearing
observations correctly incorrectly a mask
12/14-12/18 65,845 88% 9% 3% 97%
11/16-11/20 98,420 86% 11% 3% 97%
10/19-10/30 75,999 82% 14% 4% 96%
9/21-10/2 93,221 80% 14% 5% 95%
8/24-9/4 41,993 73% 18% 9% 91%
7/27-8/3 18,077 66% 22% 13% 87%
6/15-7/9 124,345 n/a* n/a* 9% 91%
*The MTA mask compliance survey initially only recorded if passengers were wearing a mask or not.
Figure 11: Mask compliance has remained high since the summer throughout the sub-
way and bus system. Proper mask usage (fully covering both the nose and mouth)
was around 80 percent around the time of the Brooklyn cluster in late September and
early October and has improved to nearly 90 percent. Proper masking will continue to
play an important role as cases climb during the winter. Source: MTA Subway and bus
mask compliance statistics
TRACKING COVID-19 AND TRANSIT 19The following are the eight companies that were chosen to complete the
Transit Tech Lab’s eight-week proof of concept alongside the health and safety
recommendations TSTC released with our original Back on Board Report:
Related recommendation
Company Technology
from Back on Board
Individually leased folding electric bikes
Beyond and scooters to expand public transit Integrate micromobility
(Brooklyn, NY) access. Will work with NYC DOT to transportation options.
comply with safety guidelines.
Disinfection technology that works with
Improve air quality by upgrading
CASPR Group ambient air to provide continuous air
ventilation systems in vehicles and
(Dallas, TX) and surface protection without harmful
indoor spaces.
chemicals or an operator.
Aggregate and make public stations
City Swift Provides riders and train operators with and train crowding data in real time
(Galway, Ireland) capacity levels on trains and buses. using proprietary and third-party data.
Visualizes disinfection through a
Kinnos colorized powder formula that dissolves
Improve cleaning protocols and
(Brooklyn, NY) practices.
into liquid bleach.
Improve air quality by upgrading
Knorr Merak Air filtration and purification
solution. ventilation systems in vehicles and
(Munich, Germany) indoor spaces.
Collects real time passenger crowding
Develop a smart messaging
Piper data from trains and platforms for
integration with mobile apps and system for real-time crowding
(San Diego, CA) alerts.
in-station digital communication.
Train and continually update all
Strongarm Wearable technology to promote transit staff on disease transmis-
(Brooklyn, NY) worker safety and social distancing. sion and protocols to reduce its
spread.
Continuous non-ultraviolet antimicrobi- Explore far-UVC sanitization for
Vyv stations, trains, buses, and air
al light to reduce bacteria/microbes
(Troy, NY) from surfaces. ventilation systems.
Successful companies may be chosen for a year-long pilot to deploy their
tools at scale. Learn more at www.transitinnovation.org.
TRACKING COVID-19 AND TRANSIT 20CONCLUSION
If the premise that public transit is a major driver of COVID-19 outbreaks
were true, then we would find a correlation between subway ridership
counts and COVID-19 cases. Given that this correlation is not evident from
the data, a causative link cannot be conclusively established. Based on our
analysis, there is no geographic association between subway ridership and
COVID-19 case rates. There are additional factors that affect this relationship,
including high mask compliance levels (between 80 and 90 percent), lower
than normal ridership allowing for proper social distancing, and the subway’s
ventilation system (which undergoes more air changes than the standard
office building and other enclosed settings).21 Surface cleaning by the MTA
may also ameliorate the spread of COVID-19,22 although the latest scientific
consensus now shows that surface transmission is limited and rare.
We speculate that the spike in positive COVID-19 cases in October, 2020 may
have been caused by factors other than transit use. These factors include
social gatherings, especially indoor gatherings, associated with various
religious and secular holidays during the time period we analyzed. Governor
Cuomo in his December 11, 2020 press conference cited data showing that
“living room spread” made up 74% of cases in New York at that time.23
While the movement of people has clearly played a role in the global spread
of COVID-19, this does not necessarily mean that transmission from person
to person while on transit is a major vector of COVID-19 transmission. When
blame for COVID-19 spread is erroneously focused on transit, that public
narrative not only harms transit’s recovery from the pandemic, it artificially
limits commutation options and distracts from the real drivers of infection.
TRACKING COVID-19 AND TRANSIT 21Given the dramatic rise in transmission and positivity rates across the country
over the course of the winter, including in suburban and rural communities
and areas where transit usage per capita is minimal compared with New York
City, the argument that public transit is a primary vector of infection loses its
potency. Public resources should be devoted to effective practices such as
masking, social distancing, and proper ventilation, ensuring that all innovative
mitigation efforts are focused on preventing the root causes of spread and on
an efficient vaccination campaign.
New York City needs transit ridership to rebound for the economy to
recover—essential workers rely on transit to reach work and other critical
destinations. If workers turn away from transit and to cars to commute
to work, a glut of vehicles on our roads will clog our city and hamper
our recovery just as vaccine uptake begins to make the reopening of
workplaces and commercial facilities viable. If farebox revenue continues
to be depressed, even federal rescue aid will be insufficient to stave off
massive cuts to bus and subway service just as riders return to work in
larger numbers. Unwarranted fear of COVID-19 transmission risk on buses
and subways will undermine our ability to resume pre-pandemic economic
activity. The city and state must do more to reassure residents that they are
not putting themselves at risk by using transit.24
Along with a campaign to inform New Yorkers of transit’s safety, the MTA
must ensure there is adequate service frequency to prevent overcrowding on
the trains or buses until vaccine uptake rises to levels necessary to generate
herd immunity. Crowded indoor spaces create some measure of risk no
matter where they are, and the MTA must continue to use best practices
to keep riders safe by providing the service frequency needed to facilitate
safe distancing, as well as by promoting new and innovative measures such
as those being tested by the Transit Innovation Partnership to combat the
spread of COVID-19.
TRACKING COVID-19 AND TRANSIT 22Like many public authorities, COVID-19 stretched the MTA’s resources and
staff to their limits, shifting the foundations of general operating assumptions
and procedures. Practices such as increased sanitization, maintaining service
frequency, and piloting pandemic interventions, combined with decreased
farebox revenue, mean the MTA is in desperate need of further federal
funding. The aid will have far-reaching benefits for the region, as every $1
invested in public transportation generates $5 in economic returns, according
to APTA. Without it, the MTA—the backbone of the city and region’s
economy—could face a death spiral of service cuts, layoffs, and fare hikes,
reducing service quality and frequency, and ultimately further depressing
both ridership levels and the economy through lack of access to employment.
TRACKING COVID-19 AND TRANSIT 23APPENDIX I
GEOGRAPHIC ANALYSIS METHODS: COMPARING SUBWAY
ACTIVITY AND CASE CLUSTERS DISTRIBUTION
If subway activity was a major factor in the spread of COVID-19 cases, then we
would expect clusters of cases to align with clusters of ridership. To assess if
there are overlaps of clusters, we used a local indicator of spatial association
(LISA) statistical test via a local Moran statistic as a way to identify local
clusters and local spatial outliers and to assess spatial dependency and a local
spatial autocorrelation of ridership and COVID-19 cases.25 In other words, the
Moran’s I statistic paints a picture of how randomly geographically distributed
clusters are distributed on a scale of -1 to 1; a value of 1 represents the strongest
clusters spatial nonrandom distribution, 0 as completely random, and -1 as the
most dispersed or evenly distributed.
Dispersed Clustered
Image source: ESRI ArcGIS
We undertook an analysis of ridership and COVID-19 clusters using only
modified ZCTA (“MODZCTA”) with subway access, removing areas that don’t
have turnstiles for our analysis. We also focused on the area outside of the
central business district of Manhattan (defined as the area south of 59th
Street) which is known to have ridership that overwhelmingly exceeds the
residential population and was the strongest cluster of ridership in the city.
By subtracting out this outlier of high ridership and low population we were
better able to zero in on clusters outside of the core of the city.
TRACKING COVID-19 AND TRANSIT 24At a city-wide level, we find a small but significant positive spatial
dependence exists between MODZCTA and ridership clusters outside of the
Central Business District (Moran’s I = 0.191, p-value 0.008). In other words,
throughout the city subway ridership activity is not randomly distributed
by geography and has a noticeable pattern. We ran the same analysis for
clusters of COVID-19 case rates and found a stronger and significant spatial
dependency of case rates (Moran’s I = 0.434, p-value = 0.001). The COVID
case clustering patterns are consistent with the 10/8/20 COVID hot spot
zones that health officials announced a week later. Using this method, we
highlight significant clusters of local areas with high values of cases and
riders in red (figure 9) and clusters at low values in blue (figure 9). There is no
geographic overlap of clusters of high ridership and high cases in the week
ending 9/26/20, one week preceding the announcements of the 10/8/20
COVID hotspots in Brooklyn and Queens. The lack of a distinct overlapping
patterns of clusters or even overlapping areas of high ridership and high
COVID prior to the winter surge of cases suggests that subway use alone is
not the major driving factor in how a microcluster of COVID-19 grows.
TRACKING COVID-19 AND TRANSIT 25APPENDIX II
THE TRANSIT INNOVATION PARTNERSHIP
The Transit Innovation Partnership is a public-private initiative formed by
the Metropolitan Transportation Authority and the Partnership for New York
City with the mission to make New York the global leader in public transit.
A board of leaders from academia, business, labor, civic organizations and
government guides the Transit Innovation Partnership, which brings together
diverse stakeholders to realize public-private projects that address top-
priority challenges.
The COVID-19 Challenge was launched in July 2020 by the Transit Tech
Lab, building on MTA’s unprecedented cleaning measures to help riders
return confidently to transit. More than 200 submissions were submitted by
companies across the globe. Five transit agencies participated, including
the Metropolitan Transportation Authority, the Port Authority of New York &
New Jersey, NJ TRANSIT, New York City Department of Education, and New
York City Department of Transportation. Solutions range from micromobility
and improved air filtration to new cleaning solutions for facilities, buses and
subway cars. More than 50 public and private sector evaluators reviewed
submissions. Transit agencies then selected the eight most promising
technologies for a rapid proof-of-concept over the course of eight weeks.
The following are the eight selected companies that completed the Transit
Tech Lab’s eight-week proof of concept offering promising results.:
Company: Beyond (Brooklyn, N.Y.)
Technology: Individually leased folding electric bikes and scooters to
expand public transit access. Will work with NYC DOT to comply with safety
guidelines.
TRACKING COVID-19 AND TRANSIT 26Company: CASPR Group (Dallas, Texas)
Technology: Disinfection technology that works with ambient air to provide
continuous air and surface protection without harmful chemicals or an
operator
Company: CitySwift (Galway, Ireland)
Technology: Provides riders and train operators with capacity levels for trains
and buses
Company: Kinnos (Brooklyn, N.Y.)
Technology: Visualizes disinfection through colorized powder formula that
dissolves into liquid bleach
Company: Knorr Merak (Munich, Germany)
Technology: Air filtration and purification solution
Company: Piper (San Diego, Calif.)
Technology: Collects real time passenger crowding data from trains and
platforms for integration with mobile apps and in-station displays
Company: Strongarm (Brooklyn, N.Y.)
Technology: Wearable technology to promote worker safety and social
distancing
Company: Vyv (Troy, N.Y.)
Technology: Continuous non-UV antimicrobial light to reduce bacteria/
microbes from surfaces
Successful companies may be chosen for a year-long pilot to deploy their
tools at scale. Learn more at https://transitinnovation.org.
TRACKING COVID-19 AND TRANSIT 27ENDNOTES
1. https://new.mta.info/coronavirus
2. https://www.nytimes.com/interactive/2020/nyregion/new-york-city-coronavirus-cases.
html
3. https://www.rochesterfirst.com/coronavirus/watch-live-gov-cuomo-updates-new-
yorkers-on-covid-19-pandemic-2/
4. https://www.scientificamerican.com/article/there-is-little-evidence-that-mass-transit-
poses-a-risk-of-coronavirus-outbreaks/
5. https://wagner.nyu.edu/impact/research/publications/public-transportation-and-
transmission-viral-respiratory-disease
6. https://twitter.com/NYGovCuomo/status/1313588620264124416?s=20
7. https://www.governor.ny.gov/news/video-audio-photos-rush-transcript-governor-
cuomo-updates-new-yorkers-states-progress-during-8
8. https://esd.ny.gov/ny-cluster-action-initiative-guidance, https://forward.ny.gov/micro-
cluster-strategy
9. https://www.governor.ny.gov/news/governor-cuomo-announces-new-cluster-action-
initiative
10. Coronavirus Updates: COVID-19 Cases In Brooklyn’s Red Zone Drops As Queens Sees
An Uptick
11. https://github.com/nychealth/coronavirus-data#geography-zip-codes-and-zctas
12. Day-by-day ridership numbers
13. https://www.youtube.com/
watch?v=wy7pRsuAoIs&list=PLZHkn788ZQJOFAVMHgiIcAZxcr8AFZCJB
14. https://www.nytimes.com/2020/10/09/health/coronavirus-covid-masks-cdc.html
15. https://www.mta.info/press-release/mta-headquarters/statement-mta-chairman-and-
ceo-patrick-j-foye
16. https://www.mta.info/press-release/mta-headquarters/mta-launches-
%E2%80%98operation-respect%E2%80%99-promote-universal-mask-compliance
17. https://www.npr.org/2021/01/21/959398694/no-mask-no-fly-biden-signs-order-
requiring-face-coverings-on-planes
18. http://www.tstc.org/wp-content/uploads/2020/06/06162020_-back-on-board.pdf
19. https://transitinnovation.org/challenge/covid
TRACKING COVID-19 AND TRANSIT 2820. https://transittechlab.medium.com/update-on-covid-19-response-challenge-
ba911630acc
21. https://www.nytimes.com/interactive/2020/08/10/nyregion/nyc-subway-coronavirus.
html
22. https://new.mta.info/coronavirus/cleaning
23. https://www.governor.ny.gov/news/video-audio-photos-rush-transcript-governor-
cuomo-updates-new-yorkers-states-progress-during-8
24. https://nyc.streetsblog.org/2020/12/14/mayor-i-accept-the-streetsblog-challenge-to-
ride-the-subway/
25. https://geodacenter.github.io/workbook/6a_local_auto/lab6a.html#lisa-principle
TRACKING COVID-19 AND TRANSIT 29You can also read