An improved pig reference genome sequence to enable pig genetics and genomics research
←
→
Page content transcription
If your browser does not render page correctly, please read the page content below
GigaScience, 9, 2020, 1–14

                                                                             doi: 10.1093/gigascience/giaa051
                                                                             RESEARCH

RESEARCH

                                                                                                                                                     Downloaded from https://academic.oup.com/gigascience/article/9/6/giaa051/5858065 by guest on 21 September 2020
An improved pig reference genome sequence to
enable pig genetics and genomics research
Amanda Warr 1 , Nabeel Affara2 , Bronwen Aken 3 , Hamid Beiki 4 ,
Derek M. Bickhart 5 , Konstantinos Billis 3 , William Chow 6 , Lel Eory 1 ,
Heather A. Finlayson1 , Paul Flicek 3 , Carlos G. Girón 3 ,
Darren K. Griffin 7 , Richard Hall 8 , Greg Hannum9 , Thibaut Hourlier 3 ,
Kerstin Howe 6 , David A. Hume 1,10 , Osagie Izuogu 3 , Kristi Kim8 ,
Sergey Koren 11 , Haibou Liu4 , Nancy Manchanda12 , Fergal J. Martin 3 ,
Dan J. Nonneman 13 , Rebecca E. O’Connor 7 , Adam M. Phillippy 11 ,
Gary A. Rohrer 13 , Benjamin D. Rosen 14 , Laurie A. Rund 15 ,
Carole A. Sargent2 , Lawrence B. Schook 15 , Steven G. Schroeder 14 ,
Ariel S. Schwartz9 , Ben M. Skinner 2 , Richard Talbot16 , Elizabeth Tseng 8 ,
Christopher K. Tuggle 4,12 , Mick Watson 1 , Timothy P. L. Smith 13,*
and Alan L. Archibald 1,*
1
  The Roslin Institute and Royal (Dick) School of Veterinary Studies, The University of Edinburgh, Easter Bush
Campus, Midlothian EH25 9RG, UK; 2 Department of Pathology, University of Cambridge, Tennis Court Road,
Cambridge CB2 1QP, UK; 3 European Molecular Biology Laboratory, European Bioinformatics Institute,
Wellcome Genome Campus, Hinxton CB10 1SD, UK; 4 Department of Animal Science, 2255 Kildee Hall, Iowa
State University, Ames, IA 50011-3150, USA; 5 Dairy Forage Research Center, USDA-ARS, 1925 Linden Drive,
Madison, WI 53706, USA; 6 Wellcome Sanger Institute, Wellcome Genome Campus, Cambridge CB10 1SA, UK;
7
  School of Biosciences, University of Kent, Giles Lane, Canterbury CT2 7NJ, UK; 8 Pacific Biosciences, 1305
O’Brien Drive, Menlo Park, CA 94025, USA; 9 Denovium Inc., San Diego, CA, USA; 10 Mater Research
Institute-University of Queensland, Translational Research Institute, Brisbane QLD 4104, Australia; 11 Genome
Informatics Section, Computational and Statistical Genomics Branch, National Human Genome Research
Institute, National Institutes of Health, 9000 Rockville Pike, Bethesda, MD 20892, USA; 12 Bioinformatics and
Computational Biology Program, Iowa State University, 2014 Molecular Biology Building, Ames, IA 50011, USA;
13
   USDA-ARS U.S. Meat Animal Research Center, 844 Road 313, Clay Center, NE 68933, USA; 14 Animal Genomics
and Improvement Laboratory, USDA-ARS, 10300 Baltimore Avenue, Beltsville, MD 20705-2350, USA;

Received: 28 October 2019; Revised: 12 March 2020; Accepted: 22 April 2020

C The Author(s) 2020. Published by Oxford University Press. This is an Open Access article distributed under the terms of the Creative Commons

Attribution License (http://creativecommons.org/licenses/by/4.0/), which permits unrestricted reuse, distribution, and reproduction in any medium,
provided the original work is properly cited.

                                                                                                                                                 1
2 An improved pig reference genome sequence to enable pig genetics and genomics research
15
Department of Animal Sciences, University of Illinois, 1201 West Gregory Drive, Urbana, IL 61801, USA and
16
Edinburgh Genomics, University of Edinburgh, Charlotte Auerbach Road, Edinburgh EH9 3FL, UK
∗
Correspondence address. Alan L. Archibald, The Roslin Institute and Royal (Dick) School of Veterinary Studies, The University of Edinburgh, Easter Bush
Campus, Midlothian EH25 9RG, UK. E-mail: alan.archibald@roslin.ed.ac.uk http://orcid.org/0000-0001-9213-1830; Timothy P.L. Smith, U.S. Meat Animal
Research Center, USDA-ARS, 844 Road 313, Clay Center, NE 68933, USA. E-mail: tim.smith2@usda.gov http://orcid.org/0000-0003-1611-6828
Abstract
Background: The domestic pig (Sus scrofa) is important both as a food source and as a biomedical model given its similarity
in size, anatomy, physiology, metabolism, pathology, and pharmacology to humans. The draft reference genome
(Sscrofa10.2) of a purebred Duroc female pig established using older clone-based sequencing methods was incomplete, and
Downloaded from https://academic.oup.com/gigascience/article/9/6/giaa051/5858065 by guest on 21 September 2020
unresolved redundancies, short-range order and orientation errors, and associated misassembled genes limited its utility.
Results: We present 2 annotated highly contiguous chromosome-level genome assemblies created with more recent
long-read technologies and a whole-genome shotgun strategy, 1 for the same Duroc female (Sscrofa11.1) and 1 for an
outbred, composite-breed male (USMARCv1.0). Both assemblies are of substantially higher (>90-fold) continuity and
accuracy than Sscrofa10.2. Conclusions: These highly contiguous assemblies plus annotation of a further 11 short-read
assemblies provide an unprecedented view of the genetic make-up of this important agricultural and biomedical model
species. We propose that the improved Duroc assembly (Sscrofa11.1) become the reference genome for genomic research in
pigs.
Keywords: pig genomes; reference assembly; pig; genome annotation
Background The previously published draft pig reference genome se-
quence (Sscrofa10.2), developed under the auspices of the
High-quality, richly annotated reference genome sequences are
Swine Genome Sequencing Consortium (SGSC), has a num-
key resources and provide important frameworks for the discov-
ber of consequential deficiencies [14–17]. The BAC-by-BAC hi-
ery and analysis of genetic variation and for linking genotypes
erarchical shotgun sequence approach [18] using Sanger se-
to function. In farmed animal species such as the domestic pig
quencing technology can yield a high quality genome sequence
(Sus scrofa, NCBI:txid9823) genome sequences have been integral
as demonstrated by the public Human Genome Project. How-
to the discovery of molecular genetic variants and the devel-
ever, with a fraction of the financial resources of the Human
opment of single-nucleotide polymorphism (SNP) chips [1] and
Genome Project, the resulting draft pig genome sequence com-
enabled efforts to dissect the genetic control of complex traits,
prised an assembly, in which long-range order and orienta-
such as growth, feed conversion, body composition, reproduc-
tion is good, but the order and orientation of sequence con-
tion, behaviour, and responses to infectious diseases [2].
tigs within many BAC clones was poorly supported and the se-
Genome sequences are an essential resource not only for en-
quence redundancy between overlapping sequenced BAC clones
abling research but also for applications in the life sciences. Ge-
was often not resolved. Moreover, ∼10% of the pig genome,
nomic selection, in which associations between thousands of
including some important genes, was not represented (e.g.,
SNPs and trait variation as established in a phenotyped train-
CD163) or incompletely represented (e.g., IGF2) in the assem-
ing population are used to choose amongst selection candidates
bly [19]. Whilst the BAC clones represent an invaluable re-
for which there are SNP data but no phenotypes, has delivered
source for targeted sequence improvement and gap closure
genomics-enabled genetic improvement in farmed animals [3]
as demonstrated for chromosome X (SSCX) [20], a clone-by-
and plants. From its initial successful application in dairy cat-
clone approach to sequence improvement is expensive notwith-
tle breeding, genomic selection is now being used in many sec-
standing the reduced cost of sequencing with next-generation
tors within animal and plant breeding, including by leading pig
technologies.
breeding companies [4, 5].
The dramatically reduced cost of whole-genome shotgun se-
The domestic pig (S. scrofa) has importance not only as a
quencing using Illumina short-read technology has facilitated
source of animal protein but also as a biomedical model. The
the sequencing of several hundred pig genomes [17, 21, 22].
choice of the optimal animal model species for pharmacologi-
Whilst a few of these additional pig genomes have been assem-
cal or toxicology studies can be informed by knowledge of the
bled to contig level, most of these genome sequences have sim-
genome and gene content of the candidate species including
ply been aligned to the reference and used as a resource for vari-
pigs [6]. A high quality, richly annotated genome sequence is
ant discovery.
also essential when using gene editing technologies to engineer
The increased capability and reduced cost of third-
improved animal models for research or as sources of cells and
generation long-read sequencing technology as delivered
tissue for xenotransplantation and potentially for improved pro-
by Pacific Biosciences (PacBio) and Oxford Nanopore platforms
ductivity [7, 8].
have created the opportunity to generate the data from which
The highly continuous pig genome sequences reported here
to build highly contiguous genome sequences as illustrated
are built upon a quarter of a century of effort by the global pig
recently for cattle [23, 24]. Here we describe the use of PacBio
genetics and genomics research community including the de-
long-read technology to establish highly continuous pig genome
velopment of recombination and radiation hybrid (RH) maps [9,
sequences that provide substantially improved resources for
10], cytogenetic and bacterial artificial chromosome (BAC) phys-
pig genetics and genomics research and applications.
ical maps [11, 12], and a draft reference genome sequence [13].Warr et al. 3
Table 1: Assembly statistics
Statistic Sscrofa10.2 Sscrofa11 Sscrofa11.1 USMARCv1.0 GRCh38.p13
Total sequence length 2,808,525,991 2,456,768,445 2,501,912,388 2,755,438,182 3,099,706,404
Total ungapped length 2,519,152,092 2,454,899,091 2,472,047,747 2,623,130,238 2,948,583,725
No. of scaffolds 9,906 626 706 14,157 472
Gaps between scaffolds 5,323 24 93 0 349
No. of unplaced scaffolds 4,562 583 583 14,136 126
Scaffold N50 576,008 88,231,837 88,231,837 131,458,098 67,794,873
Scaffold L50 1,303 9 9 9 16
No. of unspanned gaps 5,323 24 93 0 349
No. of spanned gaps 233,116 79 413 661 526
Downloaded from https://academic.oup.com/gigascience/article/9/6/giaa051/5858065 by guest on 21 September 2020
No. of contigs 243,021 705 1,118 14,818 998
Contig N50 69,503 48,231,277 48,231,277 6,372,407 57,879,411
Contig L50 8,632 15 15 104 18
∗ ∗
No. of chromosomes∗ ∗21 19 21 21 24
Summary statistics for assembled pig genome sequences and comparison with current human reference genome (source: NCBI, https://www.ncbi.nlm.nih.gov/assem
bly/). ∗ Includes mitochondrial genome.
Results Remaining gaps between contigs within scaffolds, and be-
tween scaffolds predicted to be adjacent on the basis of other
Two individual pigs were sequenced independently: (i) TJ
available data, were targeted for gap filling with a combination
Tabasco (Duroc 2–14), i.e., the sow that was the primary source
of unplaced contigs and previously sequenced BACs, or by iden-
of DNA for the published draft genome sequence (Sscrofa10.2)
tification and sequencing of BAC clones predicted from their end
[13] and (ii) MARC1423004, which was a crossbred barrow (i.e.,
sequences to span the gaps. The combination of methods filled
castrated male pig) from a composite population (approximately
2,501 gaps and reduced the number of contigs in the assembly
one-half Landrace, one-quarter Duroc, and one-quarter York-
from 3,206 to 705. The assembly, Sscrofa11 ( GCA 000003025.5),
shire) at the United States Department of Agriculture (USDA)
had a final contig N50 of 48.2 Mb, only 103 gaps in the se-
Meat Animal Research Center. The former allowed us to build
quences assigned to chromosomes, and only 583 remaining un-
upon the earlier draft genome sequence, exploit the associated
placed contigs (Table 1). Two acrocentric chromosomes (SSC16,
CHORI-242 BAC library resource [25], and evaluate the improve-
SSC18) were each represented by single, unbroken contigs. The
ments achieved by comparison with Sscrofa10.2. The latter al-
SSC18 assembly also includes centromeric and telomeric re-
lowed us to assess the relative efficacy of a simpler whole-
peats (Tables S2 and S3; Figs S1 and S2), albeit the former
genome shotgun sequencing and Chicago Hi-Rise scaffolding
probably represent a collapsed version of the true centromere.
strategy [26]. This second assembly also provided data for the Y
The reference genome assembly was completed by adding Y
chromosome and supported comparison of haplotypes between
chromosome sequences from other sources (GCA 900119615.2)
individuals. In addition, full-length transcript sequences were
[20] because TJ Tabasco (Duroc 2–14) was female. The result-
collected for multiple tissues from the MARC1423004 animal and
ing reference genome sequence was termed Sscrofa11.1 and
used in annotating both genomes.
deposited in the public sequence databases (GCA 000003025.6)
(Table 1).
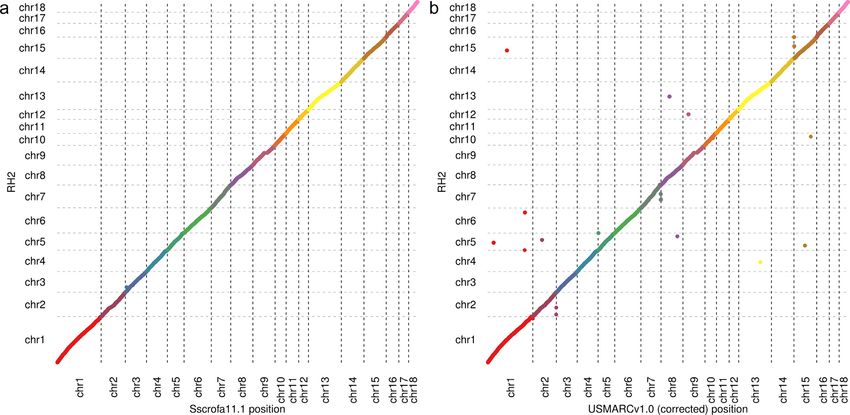
The medium- to long-range order and orientation of the Ss-
Sscrofa11.1 assembly
crofa11.1 assembly was assessed by comparison with an exist-
Approximately 65-fold coverage (176 Gb) of the genome of ing RH map [9]. The comparison strongly supported the over-
TJ Tabasco (Duroc 2–14) was generated using PacBio single- all accuracy of the assembly (Fig. 1a), despite the fact that the
molecule real-time (SMRT) sequencing technology. A total of RH map was prepared from a cell line of a different individual.
213 SMRT cells produced 12,328,735 subreads of mean length There is 1 major disagreement between the RH map and the as-
14,270 bp and with a read N50 of 19,786 bp (Table S1). Reads were sembly on chromosome 3, which will need further investigation.
corrected and assembled using Falcon (v.0.4.0) [27], achieving a The only other substantial disagreement on chromosome 9 is
minimum corrected read cut-off of 13 kb that provided 19-fold explained by a gap in the RH map [9]. The assignment and ori-
genome coverage for input, resulting in an initial assembly com- entation of the Sscrofa11.1 scaffolds to chromosomes was con-
prising 3,206 contigs with a contig N50 of 14.5 Mb. firmed with FISH of BAC clones (Table S4, Fig. S3). The Sscrofa11.1
The contigs were mapped to the previous draft assembly (Ss- and USMARCv1.0 assemblies were searched using BLAST [30]
crofa10.2) using Nucmer [28]. The long-range order of the Ss- with sequences derived from the BAC clones that had been used
crofa10.2 assembly was based on fingerprint contig [12] and RH as probes for the FISH analyses. For most BAC clones these se-
physical maps with assignments to chromosomes based on flu- quences were BAC end sequences [12], but in some cases these
orescence in situ hybridization (FISH) data. This alignment of Ss- sequences were incomplete or complete BAC clone sequences
crofa10.2 and the contigs from the initial Falcon assembly of the [13, 20]. The links between the genome sequence and the BAC
PacBio data provided draft scaffolds that were tested for consis- clones used in cytogenetic analyses by FISH are summarized in
tency with paired BAC and fosmid end sequences and the RH Table S4. The FISH results indicate areas where future assem-
map [9]. The draft scaffolds also provided a framework for gap blies might be improved. For example, the Sscrofa11.1 unplaced
closure using PBJelly [29], or finished quality Sanger sequence scaffolds contig1206 and contig1914 may contain sequences that
data generated from CHORI-242 BAC clones from earlier work could be added to the ends of the long arms of SSC1 and SSC7,
[13, 20]. respectively.4 An improved pig reference genome sequence to enable pig genetics and genomics research
Downloaded from https://academic.oup.com/gigascience/article/9/6/giaa051/5858065 by guest on 21 September 2020
Figure 1: Assemblies and radiation hybrid (RH) map alignments. Plots illustrating co-linearity between RH map and (a) Sscrofa11.1 and (b) USMARCv1.0 assemblies
(autosomes only).
The quality of the Sscrofa11 assembly, which corresponds USMARCv1.0 assembly
to Sscrofa11.1 after the exclusion of SSCY, was assessed as de-
Approximately 65-fold coverage of the genome of the
scribed previously for the existing Sanger sequence–based draft
MARC1423004 barrow was generated on a PacBio RSII in-
assembly (Sscrofa10.2) [14]. Alignments of Illumina sequence
strument. The sequence was collected during the transition
reads from the same female pig were used to identify regions
from P5/C3 to P6/C4 chemistry, with approximately equal
of low quality (LQ; regions with high GC normalized coverage,
numbers of subreads from each chemistry. A total of 199 cells
prevalence of improperly paired reads, and prevalence of reads
of P5/C3 chemistry produced 95.3 Gb of sequence with mean
with improper insert sizes) or low coverage (LC; regions with
subread length of 5.1 kb and subread N50 of 8.2 kb. A total
low GC normalized coverage) (Table 2). The analysis confirms
of 127 cells of P6/C4 chemistry produced 91.6 Gb of sequence
that Sscrofa11 represents a substantial improvement over the
with mean subread length 6.5 kb and subread N50 of 10.3 kb,
Sscrofa10.2 draft assembly. For example, the low-quality low-
resulting in an overall mean subread length, including data
coverage (LQLC) proportion of the genome sequence has de-
from both chemistries, of 6.4 kb. The reads were assembled
creased from 33.1% to 16.3% when repetitive sequence is not
using Celera Assembler 8.3rc2 [32] and Falcon [27]. The resulting
masked and to 1.6% when repeats are masked prior to read
assemblies were compared, and the Celera Assembler result
alignment. The remaining LQLC segments of Sscrofa11 have a
was selected on the basis of better agreement with a Dovetail
mean GC content of 61.6%. Thus, these regions may represent
Chicago R library [26] (i.e., there was a lower proportion of
sequence where short-read coverage is low as a result of the
conflicting links between read pairs from the Chicago library)
known systematic bias of the short-read platform against ex-
and was used to create a scaffolded assembly with the HiRiseTM
treme GC content sequences, rather than deficiencies of the as-
scaffolder consisting of 14,818 contigs with a contig N50 of
sembly.
6.372 Mb (GenBank accession GCA 002844635.1; Table 1). The
The Sscrofa11.1 assembly was also assessed visually using
USMARCv1.0 scaffolds were therefore completely independent
gEVAL [31]. The improvement in short-range order and orien-
of the existing Sscrofa10.2 or new Sscrofa11.1 assemblies, and
tation as revealed by alignments with isogenic BAC and fos-
they can act as supporting evidence where they agree with
mid end sequences is illustrated for a particularly poor re-
those assemblies. However, chromosome assignment of the
gion of Sscrofa10.2 on chromosome 12 (Fig. S4). The prob-
scaffolds was performed by alignment to Sscrofa10.2 and does
lems in this area of Sscrofa10.2 arose from failures to or-
not constitute independent confirmation of this ordering. The
der and orient the sequence contigs and resolve the redun-
assignment of these scaffolds to individual chromosomes was
dancies between these sequence contigs within BAC clone
confirmed post hoc by FISH analysis as described for Sscrofa11.1
CH242-147O24 (ENA: FP102566.2). The improved contiguity in
above. The FISH analysis revealed that several of these chro-
Sscrofa11.1 not only resolves these local order and orienta-
mosome assemblies (SSC1, 5, 6–11, 13–16) are inverted with
tion errors but also facilitates the annotation of a complete
respect to the cytogenetic convention for pig chromosome
gene model for the ABR locus. Further examples of com-
(Table S4; Figs S3 and S8–S10). After correcting the orientation of
parisons of Sscrofa10.2 and Sscrofa11.1 reveal improvements
these inverted scaffolds, there is good agreement between the
in contiguity, local order and orientation, and gene models
USMARCv1.0 assembly and the RH map [9] (Fig. 1b, Table S5).
(Figs S5–S7).Warr et al. 5
Table 2: Summary of quality statistics for SSC1–18, SSCX
% Genome
Statistic Bases, Sscrofa11 Sscrofa11 Sscrofa10.2
High coverage 119,341,205 4.9 2.6
LC 185,385,536 7.5 26.6
Low proportion properly paired 95,508,007 3.9 5.0
High proportion large inserts 40,835,320 1.7 1.5
High proportion small inserts 114,793,298 4.7 4.0
LQ 284,838,040 11.6 13.9
Total LQLC 399,927,747 16.3 33.1
LQLC windows that do not 39,918,551 1.6
Downloaded from https://academic.oup.com/gigascience/article/9/6/giaa051/5858065 by guest on 21 September 2020
intersect RepeatMasker regions
Quality measures and terms as defined [14]. LC: low coverage; LQ: low quality.
Sscrofa11.1 and USMARCv1.0 are co-linear Putative telomeres were identified at the proximal ends of
Sscrofa11.1 chromosome assemblies of SSC2, SSC3, SSC6, SSC8,
The alignment of the 2 PacBio assemblies reveals a high de-
SSC9, SSC14, SSC15, SSC18, and SSCX (Fig. S1; Table S2). Putative
gree of agreement and co-linearity, after correction of the in-
centromeres were identified in the expected locations in the Ss-
versions of several USMARCv1.0 chromosome assemblies (Fig.
crofa11.1 chromosome assemblies for SSC1–7, SSC9, SSC13, and
S11). The agreement between the Sscrofa11.1 and USMARCv1.0
SSC18 (Fig. S2, Table S3). For the chromosome assemblies of each
assemblies is also evident in comparisons of specific loci (Figs
of SSC8, SSC11, and SSC15, 2 regions harbouring centromeric
S5–S7) although with some differences (e.g., Fig. S6). The whole-
repeats were identified. Pig chromosomes SSC1-12 plus SSCX
genome alignment of Sscrofa11.1 and USMARCv1.0 (Fig. S11)
and SSCY are all metacentric, whilst chromosomes SSC13–18 are
masks some inconsistencies that are evident when the align-
acrocentric. The putative centromeric repeats on SSC17 do not
ments are viewed on a single chromosome-by-chromosome ba-
map to the expected end of the chromosome assembly.
sis (Figs S8–S10). It remains to be determined whether the small
differences between the assemblies represent errors in the as-
semblies or true structural variation between the 2 individuals Completeness of the assemblies
(see discussion of the ERLIN1 locus below).
The Sscrofa11.1 and USMARCv1.0 assemblies were assessed
Pairwise comparisons amongst the Sscrofa10.2, Sscrofa11.1,
for completeness using 2 tools, BUSCO [34] and Cogent [35].
and USMARCv1.0 assemblies using the Assemblytics tools [33]
BUSCO uses a database of expected gene content based on near-
revealed a peak of insertions and deletion with sizes of ∼300 bp
universal single-copy orthologs from species with genomic data,
(Figs S12a–S12c). We assume that these correspond to short
while Cogent uses transcriptome data from the organism being
interspersed nuclear elements. Both the Sscrofa11.1 and US-
sequenced and therefore provides an organism-specific view of
MARCv1.0 assemblies have more differences against Sscrofa10.2
genome completeness. BUSCO analysis suggests that both new
(33,347 and 44,023, respectively) than against each other (28,733).
assemblies are highly complete, with 93.8% and 93.1% of BUS-
This is despite the fact that Sscroffa11.1 and Sscrofa10.2 repre-
COs complete for Sscrofa11.1 and USMARCv1.0, respectively, a
sent the same pig genome. While some differences between Ss-
marked improvement on the 80.9% complete in Sscrofa10.2 and
crofa10.2 and Sscrofa11.1 may be due to differences in which
comparable to the human and mouse reference genome assem-
haplotype has been captured in the assembly, the reduction in
blies (Table S7).
LQ and LC regions and the dramatic decrease in differences
Cogent is a tool that identifies gene families and reconstructs
versus USMARCv1.0 lead us to conclude that the majority are
the coding genome using full-length, high-quality (HQ) tran-
improvements in the Sscrofa11.1 assembly. The differences be-
scriptome data without a reference genome and can be used to
tween Sscrofa11.1 and USMARCv1.0 will represent a mix of true
check assemblies for the presence of these known coding se-
structural differences and assembly errors that will require fur-
quences [35]. PacBio transcriptome (Iso-Seq) data consisting of
ther research to resolve. The Sscrofa11.1 and USMARCv1.0 as-
HQ isoform sequences from 7 tissues (diaphragm, hypothala-
semblies were also compared with 11 Illumina short-read as-
mus, liver, skeletal muscle [longissimus dorsi], small intestine,
semblies [17] (Table S6).
spleen, and thymus) [36] from the pig whose DNA was used as
the source for the USMARCv1.0 assembly were pooled together
for Cogent analysis. Cogent partitioned 276,196 HQ isoform se-
Repetitive sequences, centromeres, and telomeres
quences into 30,628 gene families, of which 61% had ≥2 distinct
The repetitive sequence content of Sscrofa11.1 and USMARCv1.0 transcript isoforms. Cogent then performed reconstruction on
was identified and characterized. These analyses allowed the the 18,708 partitions. For each partition, Cogent attempts to re-
identification of centromeres and telomeres for several chromo- construct coding “contigs” that represent the ordered concate-
somes. The previous reference genome (Sscrofa10.2) that was nation of transcribed exons as supported by the isoform se-
established from Sanger sequence data and a minipig genome quences. The reconstructed contigs were then mapped back to
(minipig v1.0, GCA 000325925.2) that was established from Illu- Sscrofa11.1, and contigs that could not be mapped or map to >1
mina short-read sequence data were also included for compari- position were individually examined. There were 5 genes that
son. The numbers of the different repeat classes and the average were present in the Iso-Seq data but missing in the Sscrofa11.1
mapped lengths of the repetitive elements identified in these 4 assembly. In each of these 5 cases, a Cogent partition (which con-
pig genome assemblies are summarized in Figs S13 and S14, re- sists of ≥2 transcript isoforms of the same gene, often from mul-
spectively. tiple tissues) exists in which the predicted transcript does not6 An improved pig reference genome sequence to enable pig genetics and genomics research
Table 3: Annotation statistics for Ensembl annotation of pig (Sscrofa10.2, Sscrofa11.1, USMARCv1.0), human (GRCh38.p13), and mouse
(GRCm38.p6) assemblies
Sscrofa10.2 Sscrofa11.1 USMARCv1.0 GRCh38.p13 GRCm38.p6
Statistic (Release 89) (Release 98) (Release 97) (Release 98) (Release 98)
Coding genes 21,630 (incl 10 RT) 21,301 21,535 20,444 (incl 667 RT) 22,508 (incl 270 RT)
Non-coding genes 3,124 8,971 6,113 23,949 16,078
Small non-coding genes 2,804 2,156 2,427 4,871 5,531
Long non-coding genes 135 (incl 1 RT) 6,798 3,307 16,857 (incl 304 RT) 9,985 (incl 75 RT)
Miscellaneous non-coding genes 185 17 379 2,221 562
Pseudogenes 568 1,626 674 15,214 (incl 8 RT) 13,597 (incl 4 RT)
Gene transcripts 30,585 63,041 58,692 227,530 142,446
Downloaded from https://academic.oup.com/gigascience/article/9/6/giaa051/5858065 by guest on 21 September 2020
Genscan gene predictions 52,372 46,573 152,168 51,756 57,381
Short variants 60,389,665 64,310,125 665,834,144 83,761,978
Structural variants 224,038 224,038 6,013,113 791,878
Incl: including; RT: read through.
align back to Sscrofa11.1. NCBI-BLASTN of the isoforms from the The myoglobin gene (MB) is present in the expected location in
partitions revealed them to have near-perfect hits with existing the USMARCv1.0 assembly flanked by RASD2 and RBFOX2. Partial
annotations for CHAMP1, ERLIN1, IL1RN, MB, and PSD4 for other MB sequences are present distal to RBFOX2 on chromosome 5 in
species. the Sscrofa11.1 assembly. Because there is no gap here in the Ss-
ERLIN1 is missing from its predicted location on SSC14 be- crofa11.1 assembly it is likely that the incomplete MB is a result
tween the CHUK and CPN1 genes in Sscrofa11.1. There is good of a misassembly in this region. This interpretation is supported
support for the Sscrofa11.1 assembly in the region from the by a break in the pairs of BAC and fosmid end sequences that
BAC end sequence alignments, suggesting that this area may map to this region of the Sscrofa11.1 assembly. Some of the ex-
represent a true haplotype. Indeed, a copy number variant pected gene content missing from this region of the Sscrofa11.1
nsv1302227 has been mapped to this location on SSC14 [37] chromosome 5 assembly, including RASD2, HMOX1, and LARGE1,
and the ERLIN1 gene sequences present in BAC clone CH242- is present on an unplaced scaffold (AEMK02000361.1). Cogent
513L2 (ENA: CT868715.3) were incorporated into the earlier Ss- analysis also identified 2 cases of potential fragmentation in the
crofa10.2 assembly. However, an alternative haplotype contain- Sscrofa11.1 genome assembly that resulted in the isoforms be-
ing ERLIN1 was not found in any of the assembled contigs ing mapped to 2 separate loci, although these will require fur-
from Falcon and this will require further investigation. The ER- ther investigation. In summary, the BUSCO and Cogent analyses
LIN1 locus is present on SSC14 in the USMARCv1.0 assembly indicate that the Sscrofa11.1 assembly captures a very high pro-
(30,107,816–30,143,074; note that the USMARCv1.0 assembly of portion of the expressed elements of the genome.
SSC14 is inverted relative to Sscrofa11.1). Of 11 short-read pig
genome assemblies [17] that have been annotated with the En-
sembl pipeline (Ensembl release 98, September 2019) [38, 39], Improved annotation
ERLIN1 sequences are present in the expected genomic con-
text in all 11 genome assemblies. The fact that the ERLIN1 Annotation of Sscrofa11.1 was carried out with the Ensembl an-
gene is located at the end of a contig in 8 of these short- notation pipeline and released via the Ensembl Genome Browser
read assemblies suggests that this region of the pig genome (Ensembl release 90, August 2017) [38, 41]. Statistics for the an-
presents difficulties for sequencing and assembly and the ab- notation as updated in June 2019 (Ensembl release 98, Septem-
sence of ERLIN1 in Sscrofa11.1 is more likely to be an assembly ber 2019) are listed in Table 3. This annotation is more complete
error. than that of Sscrofa10.2 and includes fewer fragmented genes
The other 4 genes are annotated in neither Sscrofa10.2 nor and pseudogenes.
Sscrofa11.1. Two of these genes, IL1RN and PSD4, are present in The annotation pipeline used extensive short-read RNA-
the original Falcon contigs; however, they were trimmed off dur- sequencing (RNA-Seq) data from 27 tissues and long-read PacBio
ing the contig QC stage because of apparent abnormal Illumina, Iso-Seq data from 9 adult tissues. This provided an unprece-
BAC, and fosmid mapping in the region, which was likely caused dented window into the pig transcriptome and allowed for not
by the repetitive nature of their expected location on chromo- only an improvement to the main gene set but also the gen-
some 3 where a gap is present. The IL1RN and PSD4 genes are eration of tissue-specific gene tracks from each tissue sample.
present in USMARCv1.0, albeit their location is anomalous, and The use of Iso-Seq data also improved the annotation of un-
are also present in the 11 short-read assemblies [17]. CHAMP1 translated regions because they represent transcripts sequenced
(ENSSSCG00070014091) is present in the USMARCv1.0 assembly across their full length from the polyA tract.
in the sub-telomeric region of the q-arm, after correction of the In addition to improved gene models, annotation of the
inversion of the USMARCv1.0 scaffold, and is also present in all Sscrofa11.1 assembly provides a more complete view of the
11 short-read assemblies [17]. After correction of the orientation porcine transcriptome than annotation of the previous assem-
of the USMARCv1.0 chromosome 11 scaffold there is a small in- bly (Sscrofa10.2; Ensembl releases 67–89, May 2012 through May
version of the distal 1.07 Mb relative to the Sscrofa11.1 assembly; 2017) [42], with increases in the numbers of transcripts anno-
this region harbours the CHAMP1 gene. The orientation of the Ss- tated (Table 3). However, the number of annotated transcripts
crofa11.1 chromosome 11 assembly in this region is consistent remains lower than in the human and mouse genomes. The an-
with the predictions of the human-pig comparative map [40]. notation of the human and mouse genomes and in particular theWarr et al. 7
gene content and encoded transcripts has been more thorough same set of markers. We also found a region of 2.56 Mb that is
as a result of extensive manual annotation. currently devoid of suitable markers on the new reference.
Efforts were made to annotate important classes of genes, in A Spearman rank order (ρ) value was calculated for each
particular immunoglobulins and olfactory receptors. For these assembly (alternative hypothesis: ρ = 0; P < 2.2 × 10⁻¹⁶ ): Ss-
genes, sequences were downloaded from specialist databases crofa10.2: 0.88464; Sscrofa11.1: 0.88890; USMARCv1.0: 0.81260.
and the literature to capture as much detail as possible (see sup- This rank order comparison was estimated by ordering all of the
plementary information, section 2 annotation, for more details). SNP probes from all chips by their listed manifest coordinates
These improvements in terms of the resulting annotation against their relative order in each assembly (with chromosomes
were evident in the results of the comparative genomics anal- ordered by karyotype). Any unmapped markers in an assembly
yses run on the gene set. The previous annotation had 12,919 were penalized by giving the marker a “−1” rank in the assembly
one-to-one orthologs with human, while the new annotation of ranking order.
the Sscrofa11.1 assembly has 15,544. Similarly, in terms of con- To examine the general linear order of placed markers on
Downloaded from https://academic.oup.com/gigascience/article/9/6/giaa051/5858065 by guest on 21 September 2020
servation of synteny, the previous annotation had 11,661 genes each assembly, the marker rank order (y-axis; used above in the
with high-confidence gene order conservation scores, while the Spearman rank order test) was plotted against the probe rank or-
new annotation has 15,958. There was also a large reduction in der on the manifest file (x-axis) (Fig. S15). The analyses revealed
terms of genes that were either abnormally short or split when some interesting artefacts that suggest that the SNP manifest
compared to their orthologs in the new annotation. coordinates for the porcine 60 K SNP chip are still derived from
The Sscrofa11.1 assembly has also been annotated using the an obsolete (Sscrofa9) reference in contrast to all other manifests
NCBI pipeline [43]. We have compared these 2 annotations. The (Sscrofa10.2). Also, it confirms that several of the USMARCv1.0
Ensembl and NCBI annotations of Sscrofa11.1 are broadly similar chromosome scaffolds are inverted with respect to the canoni-
(Table S8). There are 17,676 protein-coding genes and 1,700 non- cal orientation of pig chromosomes. The large band of points at
coding genes in common. However, 540 of the genes annotated the top of the plot corresponds to marker mappings on the un-
as protein-coding by Ensembl are annotated as non-coding or placed contigs of each assembly. These unplaced contigs often
pseudogenes by NCBI and 227 genes annotated as non-coding correspond to assemblies of alternative haplotypes in heterozy-
by NCBI are annotated as protein-coding (215) or as pseudo- gous regions of the reference animal [24]. Marker placement on
genes (12) by Ensembl. The NCBI RefSeq annotation can be vi- these segments suggests that these variants are tracking differ-
sualized in the Ensembl Genome Browser by loading the RefSeq ent haplotypes in the population, which is the desired intent of
GFF3 track and the annotations compared at the individual lo- genetic markers used in genomic selection.
cus level. Similarly, the Ensembl annotated genes can be visual-
ized in the NCBI Genome Browser. Despite considerable invest-
ment there are also differences in the Ensembl and NCBI annota-
Discussion
tion of the human reference genome sequence, with 20,444 and
19,755 protein-coding genes on the primary assembly, respec- We have assembled a superior, extremely continuous reference
tively. The MANE (Matched Annotation from NCBI and EMBL-EBI) assembly (Sscrofa11.1) by leveraging the excellent contig lengths
project was launched to resolve these differences and identify provided by long reads, and a wealth of available data includ-
a matched representative transcript for each human protein- ing Illumina paired-end, BAC end sequence, finished BAC se-
coding gene [44]. To date a MANE transcript has been identified quence, fosmid end sequences, and the earlier curated draft as-
for 12,985 genes. sembly (Sscrofa10.2). The pig genome assemblies USMARCv1.0
We have also annotated the USMARCv1.0 assembly using the and Sscrofa11.1 reported here are 92- and 694-fold, respectively,
Ensembl pipeline [38], and this annotation was released via the more continuous than the published draft reference genome se-
Ensembl Genome Browser (Ensembl release 97, July 2019) [39] quence (Sscrofa10.2) [13]. The new pig reference genome assem-
(see Table 3 for summary statistics). More recently, we have an- bly (Sscrofa11.1) with its contig N50 of 48,231,277 bp and 506 gaps
notated a further 11 short-read pig genome assemblies [17] (En- compares favourably with the current human reference genome
sembl release 98, September 2019) [39]; see Tables S6 and S11 for sequence (GRCh38.p13), which has a contig N50 of 57,879,411 bp
summary statistics for the assemblies and annotation, respec- and 875 gaps (Table 1). Indeed, considering only the chromo-
tively. some assemblies built on PacBio long-read data (i.e., Sscrofa11—
the autosomes SSC1-SSC18 plus SSCX), there are fewer gaps in
the pig assembly than in human reference autosomes and HSAX
assemblies. Most of the gaps in the Sscrofa11.1 reference assem-
SNP chip probes mapped to assemblies
bly are attributed to the fragmented assembly of SSCY. The cap-
The probes from 4 commercial SNP chips were mapped to the turing of centromeres and telomeres for several chromosomes
Sscrofa10.2, Sscrofa11.1, and USMARCv1.0 assemblies. We iden- (Tables S2 and S3; Figs. S1 and S2) provides further evidence that
tified 1,709, 56, and 224 markers on the PorcineSNP60, GGP LD, the Sscrofa11.1 assembly is more complete. The increased conti-
and 80 K commercial chips that were previously unmapped and guity of Sscrofa11.1 is evident in the graphical comparison with
now have coordinates on the Sscrofa11.1 reference (Table S9). Sscrofa10.2 illustrated in Fig. 2.
These newly mapped markers can now be imputed into a cross- The improvements in the reference genome sequence (Ss-
platform, common set of SNP markers for use in genomic selec- crofa11.1) relative to the draft assembly (Sscrofa10.2) [13] are
tion. Additionally, we have identified areas of the genome that not restricted to greater continuity and fewer gaps. The major
are poorly tracked by the current set of commercial SNP mark- flaws in the BAC clone–based draft assembly were (i) failures
ers. The previous Sscrofa10.2 reference had a mean (SD) marker to resolve the sequence redundancy amongst sequence contigs
spacing of 3.57 (26.5) kb with markers from 4 commercial geno- within BAC clones and between adjacent overlapping BAC clones
typing arrays. We found this to be an underestimate of the actual and (ii) failures to accurately order and orient the sequence con-
distance between markers because the Sscrofa11.1 reference co- tigs within BAC clones. Although the Sanger sequencing tech-
ordinates consisted of a mean (SD) of 3.91 (14.9) kb between the nology used has a much lower raw error rate than the PacBio8 An improved pig reference genome sequence to enable pig genetics and genomics research
Downloaded from https://academic.oup.com/gigascience/article/9/6/giaa051/5858065 by guest on 21 September 2020
Figure 2: Visualization of improvements in assembly contiguity. Graphical visualization of contigs for Sscrofa11 (top) and Sscrofa10.2 (bottom) as alternating dark and
light grey bars.
technology, the sequence coverage was only 4–6-fold across the veyed has identified a large number (>54,000) of novel tran-
genome. The improvements in continuity and quality (Table 2; scripts [36]. A majority of these transcripts are predicted to be
Figs S5–S7) have yielded a better template for annotation, re- spliced and validated by RNA-Seq data. Beiki and colleagues
sulting in better gene models. The Sscrofa11.1 and USMARCv1.0 identified 10,465 genes expressing Iso-Seq transcripts that are
assemblies are classed as 4|4|1 and 3|5|1 (10X : N50 contig [kb]; present on the Sscrofa11.1 assembly but are unannotated in cur-
10Y : N50 scaffold [kb]; Z = 1|0: assembled to chromosome level), rent NCBI or Ensembl annotations [36].
respectively, compared to Sscrofa10.2 as 1|2|1 and the human The alignment of the Sscrofa11.1 and USMARCv1.0 assem-
GRCh38p5 assembly as 4|4|1 [45]. blies revealed that several of the USMARCv1.0 chromosome as-
The improvement in the complete BUSCO genes indicates semblies are inverted relative to Sscrofa11.1 and the cytogenetic
that both Sscrofa11.1 and USMARCv1.0 represent templates for map. Such inversions are due to the agnostic nature of genome
annotation of gene models that are superior to the draft Ss- assembly and post-assembly polishing programs. Unless these
crofa10.2 assembly and are comparable to the finished human are corrected post hoc by manual curation, they result in artefac-
and mouse reference genome sequences (Table S7). Further- tual inversions of the entire chromosome. However, such inver-
more, a companion bioinformatics analysis of available Iso-Seq sions do not generally affect downstream analysis that does not
and companion Illumina RNA-Seq data across the 9 tissues sur- involve the relative order/orientation of whole chromosomes.Warr et al. 9
To ascertain whether the differences between Sscrofa11.1 populations of the leading pig breeding companies is achievable
and USMARCv1.0 in order and orientation within chromosomes and potentially affordable. However, 10–30× genome coverage
represent assembly errors or real chromosomal differences will short-read data generated on the Illumina platform and aligned
require further research. The sequence present at the telomeric to a single reference genome is likely to remain the primary ap-
end of the long arm of the USMARCv1.0 chromosome 7 assem- proach to sequencing multiple individuals within farmed ani-
bly (after correcting the orientation of the USMARCv1.0 SSC7) is mal species such as cattle and pigs [21, 51].
missing from the Sscrofa11.1 SSC7 assembly, and currently lo- There are significant challenges in making multiple as-
cated on a 3.8-Mb unplaced scaffold (AEMK02000452.1). This un- sembled genome resources useful and accessible. The current
placed scaffold harbours several genes including DIO3, CKB, and paradigm of presenting a reference genome as a linear rep-
NUDT14 whose orthologues map to human chromosome 14 as resentation of a haploid genome of a single individual is an
would be predicted from the pig-human comparative map [40]. inadequate reference for a species. As an interim solution
This omission will be corrected in an updated assembly in fu- the Ensembl team are annotating multiple assemblies for
Downloaded from https://academic.oup.com/gigascience/article/9/6/giaa051/5858065 by guest on 21 September 2020
ture. some species such as mouse and dog [52, 53, 54]. We have
We demonstrate moderate improvements in the placement implemented this solution for pig genomes, including 11
and ordering of commercial SNP genotyping markers on the Ss- Illumina short-read assemblies [17] in addition to the refer-
crofa11.1 reference genome that will affect future genomic se- ence Sscrofa11.1 and USMARCv1.0 assemblies reported here
lection programs. The reference-derived order of SNP markers (Ensembl release 98, September 2019) [39, 41]. Although these
plays a significant role in imputation accuracy, as demonstrated additional pig genomes are highly fragmented (Table S6) with
by a whole-genome survey of misassembled regions in cattle contig N50 values from 32 to 102 kb, the genome annotation
that found a correlation between imputation errors and mis- (Table S11) provides a resource to explore pig gene space across
assemblies [46]. The gaps in SNP chip marker coverage that we 13 genomes, including 6 Asian pig genomes. The latter are
identified will inform future marker selection surveys, which are important given the deep phylogenetic split of ∼1 million years
likely to prioritize regions of the genome that are not currently between European and Asian pigs [13].
being tracked by marker variants in close proximity to potential The current human genome reference already contains sev-
causal variant sites. In addition to the gaps in coverage provided eral hundred alternative haplotypes, and it is expected that the
by the commercial SNP chips there are regions of the genome single linear reference genome of a species will be replaced with
assemblies that are devoid of annotated sequence variation as a new model—the graph genome [55–57]. These paradigm shifts
hitherto sequence variants have been discovered against incom- in the representation of genomes present challenges for cur-
plete genome assemblies. Thus, there is a need to re-analyse rent sequence alignment tools and the “best-in-genome” anno-
good-quality resequence data against the new assemblies in or- tations generated thus far. The generation of high quality an-
der to provide a better picture of sequence variation in the pig notation remains a labour-intensive and time-consuming en-
genome. terprise. Comparisons with the human and mouse reference
The cost of high-coverage whole-genome sequencing (WGS) genome sequences, which have benefited from extensive man-
precludes its routine use in breeding programs. However, it has ual annotation, indicate that there is further complexity in the
been suggested that low coverage WGS followed by imputation porcine genome as yet unannotated (Table 3). It is very likely
of haplotypes may be a cost-effective replacement for SNP ar- that there are many more transcripts, pseudogenes, and non-
rays in genomic selection [47]. Imputation from low coverage coding genes (especially long non-coding genes) to be discov-
sequence data to whole-genome information has been shown ered and annotated on the pig genome sequence [36]. The more
to be highly accurate [48, 49]. At the 2018 World Congress on highly continuous pig genome sequences reported here pro-
Genetics Applied to Livestock Production Aniek Bouwman re- vide an improved framework against which to discover func-
ported that in a comparison of Sscrofa10.2 with Sscrofa11.1 tional sequences, both coding and regulatory, and sequence
(for SSC7 only) for imputation from 600 K SNP genotypes to variation. After correction for some contig/scaffold inversions
whole-genome sequence, overall imputation accuracy on SSC7 in the USMARCv1.0 assembly, the overall agreement between
improved considerably from 0.81 (1,019,754 variants) to 0.90 the assemblies is high and illustrates that the majority of ge-
(1,129,045 variants) (A. Bouwman, personal communication). nomic variation is at smaller scales of structural variation.
Thus, the improved assembly may not only serve as a better However, both assemblies still represent a composite of the 2
template for discovering genetic variation but also have advan- parental genomes present in the animals, with unknown ef-
tages for genomic selection, including improved imputation ac- fects of haplotype switching on the local accuracy across the
curacy. assembly.
Advances in the performance of long-read sequencing and Future developments in top class genome sequences for the
scaffolding technologies, improvements in methods for as- domestic pig are likely to include (i) gap closure of Sscrofa11.1
sembling the sequence reads, and reductions in costs are to yield an assembly with 1 contig per (autosomal) chromo-
enabling the acquisition of ever more complete genome se- some arm, exploiting the isogenic BAC and fosmid clone re-
quences for multiple species and multiple individuals within a source as illustrated here for chromosomes 16 and 18; and (ii)
species. For example, in terms of adding species, the Vertebrate haplotype-resolved assemblies of a Meishan and White Com-
Genomes Project [50] aims to generate error-free, near-gapless, posite F1 crossbred pig (i.e., the offspring of a Meishan sire and a
chromosomal-level, haplotyped phase assemblies of all of the White Composite dam that is approximately one-half Landrace,
∼66,000 vertebrate species and is currently in its first phase, one-quarter Duroc, and one-quarter Yorkshire) currently being
which will see such assemblies created for an exemplar species sequenced. Beyond this, haplotype-resolved assemblies for key
from all 260 vertebrate orders. At the level of individuals within a genotypes in the leading pig breeding company nucleus popu-
species, smarter assembly algorithms and sequencing strategies lations and of miniature pig lines used in biomedical research
are enabling the production of high quality truly haploid genome can be anticipated in the next 5 years. Unfortunately, some of
sequences for outbred individuals [24]. The establishment of as- these genomes may not be released into the public domain. The
sembled genome sequences for key individuals in the nucleus first wave of results from the Functional Annotation of Animal10 An improved pig reference genome sequence to enable pig genetics and genomics research
Genomes (FAANG) initiative [58, 59] are emerging and will add presence of potentially novel repeats was assessed by Repeat-
to the richness of pig genome annotation. Masker using the novel repeat library generated by RepeatMod-
In conclusion, the new pig reference genome (Sscrofa11.1) eler (v.1.0.11, RRID:SCR 015027) [62].
described here represents a substantially enhanced resource for Telomeres were identified by running TRF [65] with default
genetics and genomics research and applications for a species parameters apart from Mismatch (5) and Minscore (40). The
of importance to agriculture and biomedical research. identified repeat sequences were then searched for the occur-
rence of 5 identical, consecutive units of the TTAGGG vertebrate
motif or its reverse complement and total occurrences of this
Methods motif were counted within the tandem repeat. Regions that con-
Additional detailed methods and information on the assemblies tained ≥200 identical hexamer units, were >2 kb in length, and
and annotation are included in the Supplementary Materials. had a hexamer density of >0.5 were retained as potential telom-
eres.
Downloaded from https://academic.oup.com/gigascience/article/9/6/giaa051/5858065 by guest on 21 September 2020
Centromeres were predicted using the following strategy.
Preparation of genomic DNA
First, the RepeatMasker output, both default and novel, was
DNA was extracted from Duroc 2–14 cultured fibroblast cells pas- searched for centromeric repeat occurrences. Second, the as-
sage 16–18 using the Qiagen Blood & Cell Culture DNA Maxi Kit. semblies were searched for known, experimentally verified,
DNA was isolated from lung tissue from barrow MARC1423004 centromere-specific repeats [66, 67] in the Sscrofa11.1 genome.
using a salt extraction method. Then the 3 sets of repeat annotations were merged together with
BEDTools (BEDTools, RRID:SCR 006646) [68] (median and mean
length: 786 and 5,775 bp, respectively) and putative centromeric
Genome sequencing and assembly
regions closer than 500 bp were collapsed into longer super-
Genomic DNAs from the samples described above were used regions. Regions that were >5 kb were retained as potential cen-
to prepare libraries for sequencing on PacBio RS II se- tromeric sites.
quencer (PacBio RS II Sequencing System, RRID:SCR 017988)
[60]. For Duroc 2–14 DNA P6/C4 chemistry was used, whilst for Long-read RNA sequencing (Iso-Seq)
MARC1423004 DNA a mix of P6/C4 and earlier P5/C3 chemistry
was used. The following tissues were harvested from MARC1423004
Reads from the Duroc 2–14 DNA were assembled into con- at age 48 days: brain (BioSamples: SAMN05952594), di-
tigs using the Falcon v0.4.0 assembly pipeline (Falcon, RRID: aphragm (SAMN05952614), hypothalamus (SAMN05952595),
SCR 016089) following the standard protocol [27]. Quiver v. 2.3.0 liver (SAMN05952612), small intestine (SAMN05952615),
[61] was used to correct the primary and alternative contigs. skeletal muscle—longissimus dorsi (SAMN05952593), spleen
Only the primary pseudo-haplotype contigs were used in the as- (SAMN05952596), pituitary (SAMN05952626), and thymus
sembly. The reads from the MARC1423004 DNA were assembled (SAMN05952613). Total RNA from each of these tissues was
into contigs using Celera Assembler v8.3rc2 (Celera Assembler, extracted using Trizol reagent (ThermoFisher Scientific) and the
RRID:SCR 010750) [32]. The contigs were scaffolded as described provided protocol. Briefly, ∼100 mg of tissue was ground in a
in the Results section. mortar and pestle cooled with liquid nitrogen, and the powder
was transferred to a tube with 1 mL of Trizol reagent added
Fluorescence in situ hybridization and mixed by vortexing. After 5 min at room temperature,
0.2 mL of chloroform was added and the mixture was shaken
Metaphase preparations were fixed to slides and dehydrated for 15 sec and left to stand another 3 min at room temperature.
through an ethanol series (2 mins each in 2× SSC, 70%, 85%, and The tube was centrifuged at 12,000g for 15 min at 4◦ C. The
100% ethanol at room temperature). Probes were diluted in a for- RNA was precipitated from the aqueous phase with 0.5 mL
mamide buffer (Cytocell) with Porcine Hybloc (Insight Biotech) of isopropanol. The RNA was further purified with extended
and applied to the metaphase preparations on a 37◦ C hot plate DNaseI digestion to remove potential DNA contamination. The
before sealing with rubber cement. Probe and target DNA were RNA quality was assessed with a Fragment Analyzer (Advanced
simultaneously denatured for 2 mins on a 75◦ C hot plate prior Analytical Technologies Inc.). Only RNA samples of RQN >
to hybridization in a humidified chamber at 37◦ C for 16 h. Slides 7.0 were used for library construction. PacBio Iso-Seq libraries
were washed after hybridization in 0.4× SSC at 72◦ C for 2 mins were constructed per the PacBio Iso-Seq protocol. Briefly,
followed by 2× SSC/0.05% Tween 20 at room temperature for starting with 3 μg of total RNA, complementary DNA (cDNA)
30 sec, and then counterstained using VECTASHIELD anti-fade was synthesized by using the SMARTer PCR cDNA Synthesis
medium with DAPI (Vector Labs). Images were captured using Kit (Clontech) according to the Iso-Seq protocol (Pacific Bio-
an Olympus BX61 epifluorescence microscope with cooled CCD sciences). Then the cDNA was amplified using KAPA HiFi DNA
camera and SmartCapture (Digital Scientific UK) system. Polymerase (KAPA Biotechnologies) for 10 or 12 cycles followed
by purification and size selection into 4 fractions: 0.8–2, 2–3, 3–5,
Analysis of repetitive sequences, including telomeres and >5 kb. The fragment size distribution was validated on a
Fragment Analyzer (Advanced Analytical Technologies Inc.) and
and centromeres
quantified on a DS-11 FX fluorometer (DeNovix). After a second
Repeats were identified using RepeatMasker (v.4.0.7, RRID:SCR 0 round of large-scale PCR amplification and end repair, SMRT
12954) [62] with a combined repeat database including Dfam bell adapters were separately ligated to the cDNA fragments.
(v.20170127) [63] and RepBase (v.20170127) [64]. RepeatMasker Each size fraction was sequenced on 4 or 5 SMRT Cells v3 using
was run with “sensitive” (-s) setting using sus scrofa as the query P6-C4 chemistry and 6-h movies on a PacBio RS II sequencer
species (– species “sus scrofa”). Repeats that showed >40% se- (Pacific Biosciences). Short-read RNA-Seq libraries were also
quence divergence or were shorter than 70% of the expected se- prepared for all 9 tissues using TruSeq stranded mRNA LT
quence length were filtered out from subsequent analyses. The kits and supplied protocol (Illumina), and sequenced on anWarr et al. 11
Illumina NextSeq500 platform using v2 sequencing chemistry the manifest marker site. To derive and compare relative marker
to generate 2 × 75 bp paired-end reads. rank order, a custom Perl script [78] was used to sort and number
The reads of interest were determined by using consensus- markers based on their mapping locations in each assembly.
tools.sh in the SMRT-Analysis pipeline v2.0, with reads that were
shorter than 300 bp and whose predicted accuracy was12 An improved pig reference genome sequence to enable pig genetics and genomics research
LQ: low quality; LQLC: low quality, low coverage; MANE: Matched formed cytogenetics analyses; L.E. analysed repeat sequences;
Annotation from NCBI and EMBL-EBI; Mb: megabase pairs; H.B., H.L., N.M., and C.K.T. analysed Iso-Seq data; D.M.B. and
mRNA: messenger RNA; NCBI: National Center for Biotechnol- G.A.R. analysed sequence variants; B.A., K.B., C.G.G., T.H., O.I.,
ogy Information; NIH: National Institutes of Health; PacBio: Pa- and F.J.M. annotated the assembled genome sequences; A.W.
cific Biosciences; polyA: poly adenine; QC: quality control; Ref- and A.L.A drafted the manuscript; all authors read and approved
Seq: NCBI Reference Sequence Database; RH: radiation hybrid; the final manuscript.
RNA-Seq: high-throughput short-read RNA sequencing; RQN:
RNA quality number; RT: read through; SGSC: Swine Genome
Sequencing Consortium; SMRT: single-molecule real-time; SNP: Acknowledgements
single-nucleotide polymorphism; SSC: saline sodium citrate;
We are grateful to Chris Tyler-Smith (Wellcome Trust Sanger In-
SSCn: Sus scrofa chromosome n; SD: standard deviation; TRF:
stitute) for sharing the SSCY sequence data for Sscrofa11.1.
Tandem Repeats Finder; USDA: United States Department of
Downloaded from https://academic.oup.com/gigascience/article/9/6/giaa051/5858065 by guest on 21 September 2020
Agriculture; WGS: whole-genome sequencing.
References
Competing Interests 1. Ramos AM, Crooijmans RPMA, Affara NA, et al. Design of
R.H., K.K., and E.T. are employed by Pacific Biosciences; all other a high density SNP genotyping assay in the pig using SNPs
authors declare that they have no competing interests. identified and characterized by next generation sequencing
technology. PLoS One 2009;4:e6524.
2. Hu ZL, Park CA, Reecy JM. Developmental progress and
Funding current status of the Animal QTLdb. Nucleic Acids Res
2016;44:D827–33.
This work was supported by the Biotechnology and Biological 3. Meuwissen T, Hayes B, Goddard M. Accelerating Improve-
Sciences Research Council, Institute Strategic Programme Grant, ment of livestock with genomic selection. Annu Rev Anim
BBS/E/D/20211550, A.L.A., M.W.; the Biotechnology and Biolog- Biosci 2013;1:221–37.
ical Sciences Research Council, Institute Strategic Programme 4. Christensen OF, Madsen P, Nielsen B, et al. Single-step meth-
Grant, BBS/E/D/10002070, A.L.A., M.W.; the Biotechnology and ods for genomic evaluation in pigs. Animal 2012;6:1565–71.
Biological Sciences Research Council, Response Mode Grant, 5. Cleveland M, Hickey JM. Practical implementation of cost-
BB/F021372/1, N.A.; the Biotechnology and Biological Sciences effective genomic selection in commercial pig breeding us-
Research Council, Response Mode Grant, BB/M011461/1, A.L.A.; ing imputation. J Anim Sci 2013;91:3583–92.
the Biotechnology and Biological Sciences Research Coun- 6. Vamathevan JJ, Hall MD, Hasan S, et al. Minipig and bea-
cil, Response Mode Grant, BB/M011615/1, P.F.; the Biotechnol- gle animal model genomes aid species selection in pharma-
ogy and Biological Sciences Research Council, Response Mode ceutical discovery and development. Toxicol Appl Pharmacol
Grant, BB/M01844X/1, A.L.A., M.W.; EU, FP7 Programme Quan- 2013;270:149–57.
tomics, KBBE222664, A.L.A.;Wellcome Trust, WT108749/Z/15/Z, 7. Klymiuk N, Seeliger F, Bohlooly M, et al. Tailored pig models
P.F.;USDA, CRIS Project, 8042-31000-001-00-D, D.M.B., B.D.R.; for preclinical efficacy and safety testing of targeted thera-
USDA, CRIS Project, 5090-31000-026-00-D, D.M.B.; USDA, CRIS pies. Toxicol Pathol 2016;44:346–57.
Project, 3040-31000-100-00-D, T.P.L.S. 8. Wells KD, Prather RS. Genome-editing technologies to im-
In addition to the funding acknowledged above we are grate- prove research, reproduction, and production in pigs. Mol Re-
ful for support from the University of Cambridge, Department prod Dev 2017;84:1012–7.
of Pathology, the European Molecular Biology Laboratory, and 9. Servin B, Faraut T, Iannuccelli N, et al. High-resolution auto-
the Roslin Foundation. In addition H.L. and H.B. were supported somal radiation hybrid maps of the pig genome and their
by USDA NRSP-8 Swine Genome Coordination funding; S.K. and contribution to the genome sequence assembly. BMC Ge-
A.M.P. were supported by the Intramural Research Program of nomics 2012;13:585.
the National Human Genome Research Institute, US National In- 10. Tortereau F, Servin B, Frantz L, et al. A high density re-
stitutes of Health. This work used the computational resources combination map of the pig reveals a correlation between
of the NIH HPC Biowulf cluster (https://hpc.nih.gov) and the Iowa sex-specific recombination and GC content. BMC Genomics
State University Lightning3 and ResearchIT clusters. The Ceres 2012;13:586.
cluster (part of the USDA SCInet Initiative) was used to analyse 11. Yerle M, Lahbib-Mansais Y, Mellink C, et al. The PiGMaP con-
part of this dataset. sortium cytogenetic map of the domestic pig (Sus scrofa do-
mestica). Mamm Genome 1995;6:176–86.
12. Humphray SJ, Scott CE, Clark R, et al. A high utility
Authors’ Contributions
integrated map of the pig genome. Genome Biol 2007;
A.L.A. and T.P.L.S. conceived, coordinated, and managed the 8:R139.
project; A.L.A., P.F., D.A.H., T.P.L.S., and M.W. supervised staff 13. Groenen MAM, Archibald AL, Uenishi H, et al. Analyses of
and students performing the analyses; D.J.N., L.A.R., L.B.S., and pig genomes provide insight into porcine demography and
T.P.L.S. provided biological resources; R.H., K.S.K., and T.P.L.S. evolution. Nature 2012;491:393–8.
generated PacBio sequence data; H.A.F., T.P.L.S., and R.T. gener- 14. Warr A, Robert C, Hume D, et al. Identification of low-
ated Illumina WGS and RNA-Seq data; N.A.A., C.A.S., and B.M.S. confidence regions in the pig reference genome (Sscrofa
provided SSCY assemblies; D.J.N. and T.P.L.S. generated Iso-Seq 10.2). Front Genet 2015;6:338.
data; G.H., R.H., S.K., A.M.P., A.S.S, and A.W. generated sequence 15. O’Connor RE, Fonseka G, Frodsham R, et al. Isolation of sub-
assemblies; A.W. polished and quality checked Sscrofa11.1; W.C., telomeric sequences of porcine chromosomes for transloca-
G.H., K.H., S.K., B.D.R., A.S.S., S.G.S., and E.T. performed qual- tion screening reveals errors in the pig genome assembly.
ity checks on the sequence assemblies; R.E.O’C. and D.K.G. per- Anim Genet 2017;48:395–403.You can also read