An Intelligent System for Trading Signal of Cryptocurrency Based on Market Tweets Sentiments
←
→
Page content transcription
If your browser does not render page correctly, please read the page content below

Article
An Intelligent System for Trading Signal of Cryptocurrency
Based on Market Tweets Sentiments
Man-Fai Leung 1, * , Lewis Chan 2 , Wai-Chak Hung 2 , Siu-Fung Tsoi 2 , Chun-Hin Lam 2 and Yiu-Hang Cheng 2

                                         1   School of Computing and Information Science, Faculty of Science and Engineering, Anglia Ruskin University,
                                             Cambridge CB1 1PT, UK
                                         2   School of Science and Technology, Hong Kong Metropolitan University, Kowloon, Hong Kong 999077, China
                                         *   Correspondence: man-fai.leung@aru.ac.uk

                                         Abstract: The purpose of this study is to examine the efficacy of an online stock trading platform in
                                         enhancing the financial literacy of those with limited financial knowledge. To this end, an intelligent
                                         system is proposed which utilizes social media sentiment analysis, price tracker systems, and machine
                                         learning techniques to generate cryptocurrency trading signals. The system includes a live price visu-
                                         alization component for displaying cryptocurrency price data and a prediction function that provides
                                         both short-term and long-term trading signals based on the sentiment score of the previous day’s
                                         cryptocurrency tweets. Additionally, a method for refining the sentiment model result is outlined.
                                         The results illustrate that it is feasible to incorporate the Tweets sentiment of cryptocurrencies into
                                         the system for generating reliable trading signals.

                                         Keywords: intelligent system; cryptocurrency; trading signal; sentiment analysis; machine learning

                                         1. Introduction
                                              The cryptocurrency market has become a rising trend recently, and even some novice
                                         investors want a piece of it. This market is typically open for trading 24 h a day, seven days
                                         a week since it is not regulated by a centralized market governance, central bank, or single
Citation: Leung, M.-F.; Chan, L.;        administrator. Research conducted by Ryan Farrell has outlined three leading indicators
Hung, W.-C.; Tsoi, S.-F.; Lam, C.-H.;    of the cryptocurrency industry, including market capitalization, the estimated number of
Cheng, Y.-H. An Intelligent System       cryptocurrency users, and daily transaction volume [1].
for Trading Signal of Cryptocurrency          The cryptocurrency market is highly volatile and can yield a high return on investment
Based on Market Tweets Sentiments.       in the short term. Using the 2017 Bitcoin market as an example, its price increased by 2000%,
FinTech 2023, 2, 153–169. https://       from USD 863 on 9 January 2017 [2] to a peak of USD 17,550 on 11 December 2017. Despite
doi.org/10.3390/fintech2010011           the potential for high returns, there is a high risk associated with this kind of investment.
Academic Editor: Yokyen Nguwi
                                         The collapse of the Mt. Gox exchange in February 2014 [3] demonstrates the vulnerability of
                                         investors to sudden exits from the market. As a beginner investor, it is difficult to monitor
Received: 19 January 2023                the crypto market 24/7 and make informed decisions without bias. To address this, a
Revised: 11 March 2023                   number of platforms for trading cryptocurrencies have emerged, providing tools to help
Accepted: 13 March 2023                  investors analyze past data from the crypto market.
Published: 16 March 2023
                                              However, having old data alone is not sufficient to help investors predict future trends
                                         or fluctuations in cryptocurrency prices. Research conducted by Connor Lamon, Eric
                                         Nielsen, and Eric Redondo has demonstrated that prices are typically affected by news
Copyright: © 2023 by the authors.
                                         and social media posts [4]. For instance, in 2021, Elon Musk, the founder of Tesla, posted
Licensee MDPI, Basel, Switzerland.       an announcement on Twitter, a popular social media platform, that his company would
This article is an open access article   discontinue accepting Bitcoin as a payment method from May onwards. Following this
distributed under the terms and          post, the price of Bitcoin decreased. Subsequently, after one month, Elon Musk posted
conditions of the Creative Commons       another announcement stating that Tesla would once again accept Bitcoin. Immediately,
Attribution (CC BY) license (https://    the prices of Bitcoin and Ethereum increased. It is assumed that positive sentiment scores
creativecommons.org/licenses/by/         of the tweets of the market will lead to an increase in the trading volume and price of the
4.0/).                                   coins, while negative sentiment scores of the tweets of the market will lead to a decrease in

FinTech 2023, 2, 153–169. https://doi.org/10.3390/fintech2010011                                              https://www.mdpi.com/journal/fintech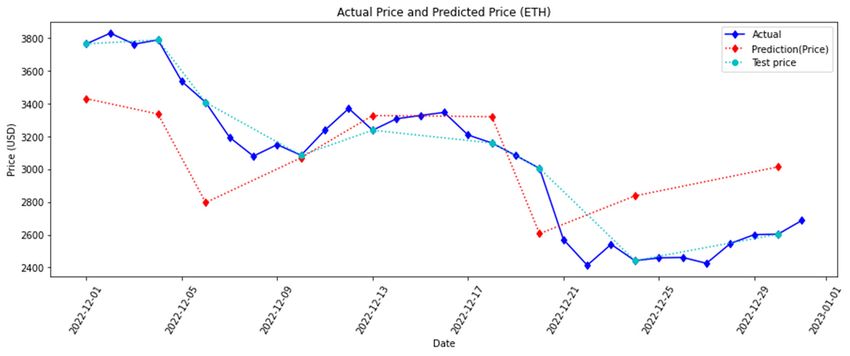
FinTech 2023, 2                                                                                                              154

                  the trading volume and price of the coins. It is also assumed that sentiment scores of the
                  tweets of the cryptocurrency market will have a positive correlation with the prices of the
                  coins. Based on the above assumptions, this work aims to develop a web application that
                  recommends profitable stock portfolios and provides easy-to-understand stock analytics
                  using machine learning and big data analytics.
                       This work contributes by developing a cryptocurrency analysis system for investors.
                  The system provides a price-tracking function and related information about the cryptocur-
                  rency, as well as a trading signal based on the sentiment analysis of related crypto tweets
                  using machine learning techniques. Additionally, an approach is designed to provide users
                  with the trading signal of the cryptocurrency based on the analyzed data.
                       The rest of the paper is arranged as follows: In Section 2, related online platforms and
                  machine learning techniques are introduced. In Section 3, the proposed system is described.
                  Section 4 demonstrates the prototype results and discussion. The paper is summarized in
                  Section 5.

                  2. Related Works
                        It is well-known that fluctuations in cryptocurrency can be extremely volatile, making
                  it difficult to forecast its price [5]. A study by Siddhi Velankar et al. has found that the
                  price of Bitcoin does not depend on business events or intervening governments, unlike the
                  stock market [6]. Furthermore, research has revealed that predictions based on historical
                  price data of cryptocurrencies alone are often inaccurate [7]. Although historical price data
                  reflects the performance of cryptocurrency in the past, it may not accurately reflect future
                  trends, especially in the cryptocurrency market. To correctly predict the cryptocurrency
                  market trend, other factors must be taken into consideration. It has been suggested that
                  there is a correlation between media sentiment and cryptocurrency trends [4]. A study
                  by Yu and Chen has found that including social media features can significantly improve
                  the accuracy of price prediction [2]. However, due to time limitations and cost, it is not
                  realistic to analyze all the social media posts from different platforms. Analyzing tweets for
                  cryptocurrency prediction is more efficient [6,8,9], as Twitter is the most popular source
                  of social media providing the earliest and fastest news updates in a concise format [10].
                  Therefore, a sentiment analysis model and related dataset are needed to provide an accurate
                  signal for predicting the future trends of cryptocurrencies.
                        There are a number of online platforms available to help users trade or predict the
                  cryptocurrency market (such as Coinbase, Cryptocurrency forecast: AI Prediction and
                  CoinMarketCap). Each platform has its own advantages and disadvantages, which are
                  listed in Table 1.

                  Table 1. A comparison of features across chosen platforms.

                                                                         Cryptocurrency Forecast:
                                                       Coinbase 1                                        CoinMarketCap 3
                                                                             AI Prediction 2
                            AI Prediction                  No                        Yes                          No
                              News Feed                    Yes                       Yes                          Yes
                             Live Trading                  Yes                       No                           Yes
                      Live Cryptocurrency Prices           Yes                       Yes                          Yes
                            Consumption                    No                        Yes                          No
                             Mobile App                    Yes                       Yes                          Yes
                  1 https://www.coinbase.com/ (accessed on 1 January 2022). 2. https://apps.apple.com/us/app/crypto-forecast-ai-p
                  rediction/id1526009011 (accessed on 1 January 2022). 3 https://coinmarketcap.com/ (accessed on 1 January 2022).

                       Coinbase is a free, open, and popular cryptocurrency exchange where users can pur-
                  chase, sell, and exchange cryptocurrency. It also provides the latest news on cryptocurrency
                  and supports mobile platforms. Although Coinbase does not provide an artificial intel-
                  ligence (AI) prediction feature, it has all the basic features for cryptocurrencies and its
                  interface is concise for cryptocurrency beginners.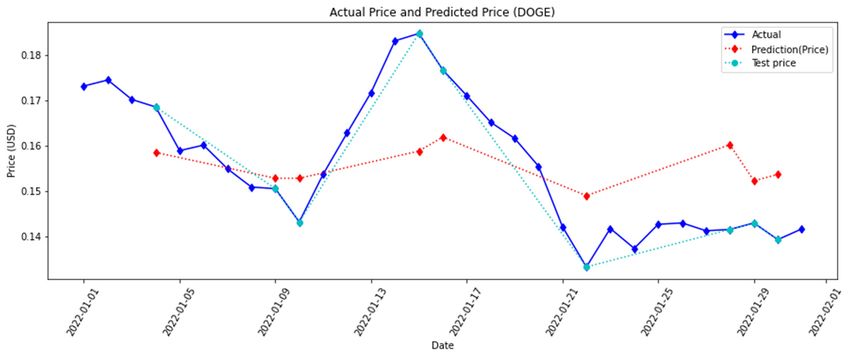
FinTech 2023, 2                                                                                                    155

                       Cryptocurrency Forecast: AI Prediction is a mobile application that uses neural net-
                  works to provide state-of-the-art predictions of cryptocurrency prices. It offers hourly and
                  daily price predictions of cryptocurrencies, as well as live market statistics, news, and
                  sentiment analysis, to help cryptocurrency users make informed decisions.
                       CoinMarketCap compiles projected data from user input, calculates the average es-
                  timated price, and compares it to the actual price. However, this method of predicting
                  cryptocurrencies based on user voting is rather imprecise; even when there are over
                  10,000 individuals forecasting, the prediction is still inaccurate.
                       Besides using social media posts to predict cryptocurrency prices [4,8], various tech-
                  nologies can be used to discover the relationship between social media data and cryptocur-
                  rency price changes. Neural networks, which are composed of many neurons and create
                  complex networks, have been heavily influenced by the human brain. With the introduc-
                  tion of transfer learning by G.E. Hinton, deep learning has become a reality, which is the
                  extraction of features from raw data with the help of layers [10]. Neural networks have
                  been applied to a variety of tasks such as signal and image reconstruction [11,12], asset al-
                  location [13,14], non-negative matrix factorization [15,16], model predictive control [17,18],
                  sentiment analysis [19] and clustering [20,21]. Furthermore, they are beneficial for text
                  creation, vector representation, word representation estimation, sentence classification,
                  phrase modeling, feature selection [22], and emotion recognition [23]. Networks with more
                  than three layers are generally considered deep learning approaches, such as convolutional
                  neural networks (CNN) and recurrent neural networks (RNN). Deep neural networks
                  require complex mathematical models to analyze inputs in intricate detail. Web scraping
                  is an automated process of extracting or mining data from structured web pages, which
                  can be leveraged for various applications, such as price monitoring, news monitoring, and
                  market research. Natural Language Processing (NLP) is a technology that interprets text
                  and spoken words in a similar manner to humans for sentiment analysis [24], allowing for
                  the classification of data as positive, negative, or neutral. The Natural Language Toolkit
                  (NLTK) is a widely used toolkit for training a machine learning model with the Python
                  package [25].
                       Logistic Regression [26] is a machine-learning classification technique that may be
                  used to estimate the probability of a certain outcome when utilizing cryptocurrency. By
                  taking into account multiple independent variables, Logistic Regression can provide a
                  detailed error analysis that may be used to help inform decision making. This approach is
                  particularly helpful when the expected outcome is binary, such as when trading or investing
                  in a cryptocurrency. Additionally, Logistic Regression can be used to identify the most
                  useful variables when making decisions in the cryptocurrency market. Mathematically, the
                  logistic regression model can be expressed as:

                                                         p(y = 1|x)= θ(θˆT x)

                  where θ is a vector of coefficients, x is a vector of predictors, and y is the target variable (in
                  this case, a binary variable).
                        The logistic function, (θˆT x) is defined as:

                                                     (θˆT x) = 1/(1 + eˆ(−θˆT x))

                         This function takes the dot product of the coefficient vector θ and the predictor vector x
                  and returns a value between 0 and 1, which represents the probability of the target variable
                  being 1.
                         The naive Bayes algorithm [27] can be applied to the world of cryptocurrency by using
                  it to classify digital assets. Its classifiers can be used to analyze the various attributes of digi-
                  tal assets, such as price, transaction volume, market capitalization, and other characteristics.
                  This can be beneficial in predicting the performance of digital assets and helping investors
                  make informed decisions. However, since the features of digital assets are not completely
                  independent, the result of using the Naive Bayes algorithm may not be accurate.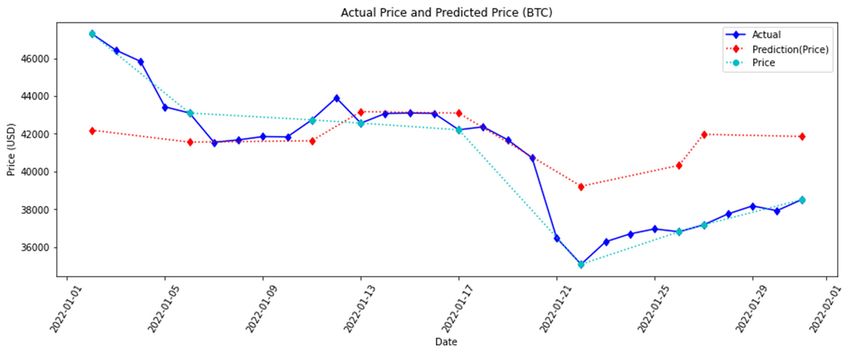
FinTech 2023, 2                                                                                                156

                       A Support Vector Machine (SVM) [28] is a supervised machine learning algorithm that
                  can be used for both classification and regression tasks. SVMs are more commonly used in
                  classification problems, such as text classification tasks (e.g., spam detection) and image
                  recognition challenges (e.g., recognizing color-based and aspect-based features). However,
                  due to its high computational demands, it is not recommended to use this method for
                  testing models, as the training time can be long with large datasets.
                       Each of the above classification models has its advantages and disadvantages; for
                  example, Support Vector Machine performs well in classification but requires a considerable
                  training period. Thus, when selecting a categorization model, it is essential to determine
                  which is most suitable for the given needs. With regard to data gathering, the same strategy
                  as before may be applied since it is common and a superior source is available.

                  3. Proposed System
                        The proposed system provides cryptocurrency information and prediction functions
                  using React Native. React Native Animated Charts [29] are utilized to provide different
                  types of charts and log plots that contain more cryptocurrency price data in a chart, de-
                  pending on the date or different time slot. The system consists of a classification model
                  and a regression analysis model. The classification model is employed to analyze the
                  sentiment of related selected tweets, while the regression analysis model is used to predict
                  a cryptocurrency’s future trends or price fluctuation based on the sentiment analysis results.
                  A machine learning-based approach is then developed to convert the given results to a
                  trading signal for users.
                        The proposed system must meet the following technical requirements. Firstly, it must
                  provide a list of the last prices of different cryptocurrencies. Secondly, the system must
                  provide related news of selected cryptocurrencies for the users. Thirdly, it must incorporate
                  a prediction function that gives the users a buy or sell signal. Finally, it must provide details
                  of the cryptocurrency that the user has selected.
                        As for the first requirement, many up-to-date price data are needed in order to provide
                  a list that reflects the latest prices of different cryptocurrencies. Considering the update rate
                  and convenience, the use of existing APIs is intended to provide the most recent price data
                  immediately upon sending a request, such as those provided by CoinGecko, CoinDesk,
                  and Cryptocompare API.
                        In order to return detail for user-selected cryptocurrencies, a large quantity of his-
                  torical data for different cryptocurrencies is necessary. To enable users to have a better
                  understanding of the price trend of the chosen cryptocurrency, a price chart with these
                  data is provided. As such, the react-native-animated-charts library is selected to plot aes-
                  thetically pleasing, animated linear charts based on a given input. As opposed to hosting
                  a database to store a large amount of data, using APIs is preferable. CoinGecko API is
                  chosen, as it can also provide the timestamps of the price data. Additionally, Cryptopanic
                  API is utilized to attach the relevant news for the selected cryptocurrencies to provide users
                  with related news.
                        The Tweepy Python library is used to access the Twitter API social platform in order
                  to collect tweets related to cryptocurrency. The TextBlob Python library utilizes NLTK
                  processing libraries to provide sentiment analysis and classification functions. NLTK, a
                  Natural Language Toolkit, provides over 50 corpora and lexical resources and is used for
                  data preprocessing to filter out useless data such as stop words and wordnets. A CNN-
                  LSTM sentiment analysis model is used to predict the sentiment of the tweets. Decision tree
                  and random forest regression machine models are used to predict the future cryptocurrency
                  price based on the last-day sentiment result. Google Colab and Tensorflow are employed for
                  the machine learning process and for observing the results. The Snscrape Python library is
                  utilized to scrape Twitter’s historical cryptocurrency-related tweets. The Pymongo Python
                  library is employed to work with MongoDB and store all the cryptocurrency-related tweets
                  in databases. The result of the sentiment analysis and regression algorithm is a predicted
                  price of the related cryptocurrency.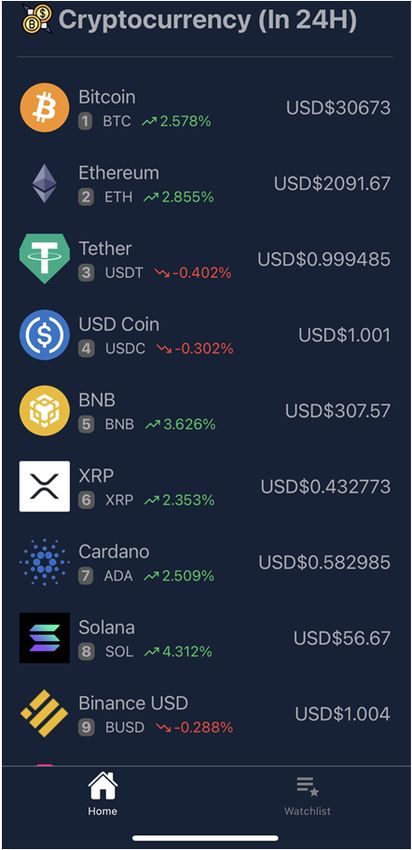
Figure 1 shows the component diagram of the proposed system. Upon initiation, the
   system requests cryptocurrency data by calling the CoinGecko API. Users are then able to
   select a cryptocurrency for more details or select their watchlist to view the stored crypto-
   currencies.
FinTech 2023, 2  The watchlist data is stored in the local database via the async-storage library.                              157
   After the user selects a cryptocurrency for detail, they access the detail page. The detail
   page then requests the detail of the selected cryptocurrency data by calling the CoinGecko
                                Figure 1 shows the component diagram of the proposed system. Upon initiation,
   API. After the data isthereturned,      users are able to view the cryptocurrency's detail, such as
                               system requests cryptocurrency data by calling the CoinGecko API. Users are then
   their real-time price, able
                           price    charta in
                                to select       different periods,
                                            cryptocurrency                and percentage
                                                             for more details                    of pricetochange.
                                                                                 or select their watchlist                  Ad-
                                                                                                                view the stored
   ditionally, users can view related news, add or remove cryptocurrencies from the watch-
                           cryptocurrencies.    The  watchlist data  is stored  in the local database    via the  async-storage
                           library. After the user selects a cryptocurrency for detail, they access the detail page. The
   list, or get trading signals.   For the watchlist function, users can add or remove the selected
                           detail page then requests the detail of the selected cryptocurrency data by calling the
   cryptocurrency on the       detail page.
                           CoinGecko             Upon
                                         API. After        performing
                                                     the data  is returned, these     actions,
                                                                              users are            the the
                                                                                         able to view    system        adds or
                                                                                                              cryptocurrency’s
   removes the cryptocurrency
                           detail, suchfrom    the
                                        as their    Async-Storage.
                                                 real-time                  The
                                                           price, price chart      news page
                                                                               in different periods,is and
                                                                                                        accessible
                                                                                                            percentageby     the
                                                                                                                          of price
   user, and the system requests        related news data from the Cryptopanic API. The news will
                           change. Additionally, users can view related news, add or remove cryptocurrencies from
                           the watchlist, or get trading signals. For the watchlist function, users can add or remove
   be listed on the page theonce   the system
                               selected             obtains
                                         cryptocurrency        the
                                                          on the    data
                                                                  detail    from
                                                                         page.  Uponthe   third-party
                                                                                       performing    these service.
                                                                                                            actions, theAddi-
                                                                                                                           system
   tionally, users will be able to access the prediction function, available in BTC, ETH, and
                           adds  or  removes  the cryptocurrency    from   the Async-Storage.    The  news   page    is accessible
   DOGE, by pressing the        prediction button. Upon executing the prediction function, the
                           by the user, and the system requests related news data from the Cryptopanic API. The news
                           will be listed on the page once the system obtains the data from the third-party service.
   system will send an API       requestusers
                           Additionally,     to the
                                                 willtrading
                                                       be able tosignal
                                                                  access theserver.   Thefunction,
                                                                               prediction    server available
                                                                                                        will then       call ETH,
                                                                                                                   in BTC,   the
   AI model, which willand   send
                                DOGE,an by
                                         API    request
                                            pressing       to the third-party
                                                      the prediction                  service to
                                                                      button. Upon executing      the obtain
                                                                                                      prediction the    related
                                                                                                                    function,  the
   data and analysis. Ultimately, the AI model will return the result to the client via the
                           system will send an API request to the trading signal server. The server will then call the
                           AI model, which will send an API request to the third-party service to obtain the related
   server. Figure 2 shows     the
                           data anddata-flow       diagram
                                      analysis. Ultimately, theof
                                                                AI the
                                                                    modelproposed
                                                                            will return system.
                                                                                        the result to the client via the server.
                                Figure 2 shows the data-flow diagram of the proposed system.

                                Figure 1. Component diagram of the proposed system.
  Figure 1. Component diagram of the proposed system.
                                     Figure 3 shows the machine learning model flowchart diagram. Initially, historical
                                cryptocurrency-related tweets are obtained and preprocessed to make them suitable for
                                sentiment model training. Data preprocessing [30] is a data mining approach for trans-
                                forming unstructured data into a useful and efficient format. This involves data cleansing,
                                noisy data, data transformation and data reduction. This approach is typically used prior
                                to machine learning to remove unnecessary data via data cleaning. Afterward, the model is
                                trained with the preprocessed dataset and evaluated. The best-performing model is chosen
                                as the cryptocurrency tweets sentiment model. Sentiment models are used to predict the
                                January 2022 Twitter cryptocurrency-related tweets sentiment score. Then, the January
                                2022 sentiment dataset with actual cryptocurrency price from investing.com is split into a
                                70% training set and a 30% testing set for model training and evaluation. After the trained
                                random forest regression model is completed, evaluation metrics are used to measure the
                                model performance and plot a graph compared to the actual cryptocurrency price.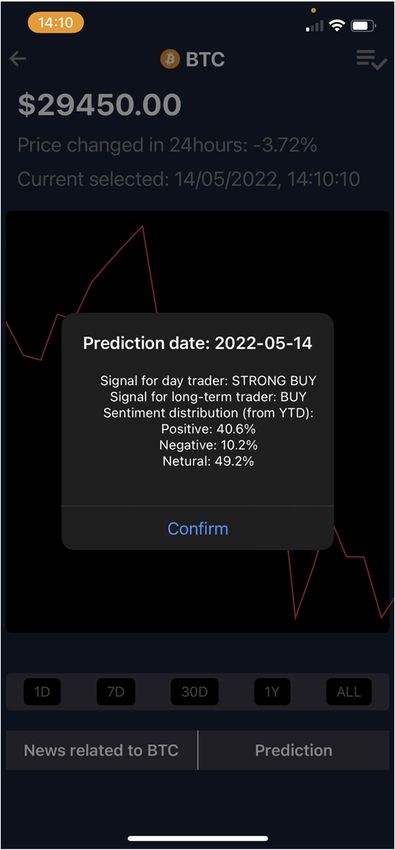
FinTech 2023, 2, FOR PEER REVIEW                                                                                             6
     FinTech 2023, 2                                                                                                            158

FinTech 2023, 2, FOR PEER REVIEW                                                                                                        7

                                     Figure 2. Data-flow diagram of the proposed system.
                                      Figure 2. Data-flow diagram of the proposed system.

                                               Figure 3 shows the machine learning model flowchart diagram. Initially, historical
                                         cryptocurrency-related tweets are obtained and preprocessed to make them suitable for
                                         sentiment model training. Data preprocessing [30] is a data mining approach for trans-
                                         forming unstructured data into a useful and efficient format. This involves data cleansing,
                                         noisy data, data transformation and data reduction. This approach is typically used prior
                                         to machine learning to remove unnecessary data via data cleaning. Afterward, the model
                                         is trained with the preprocessed dataset and evaluated. The best-performing model is cho-
                                         sen as the cryptocurrency tweets sentiment model. Sentiment models are used to predict
                                         the January 2022 Twitter cryptocurrency-related tweets sentiment score. Then, the January
                                         2022 sentiment dataset with actual cryptocurrency price from investing.com is split into a
                                         70% training set and a 30% testing set for model training and evaluation. After the trained
                                         random forest regression model is completed, evaluation metrics are used to measure the
                                         model performance and plot a graph compared to the actual cryptocurrency price.

                                     Figure 3. Machine learning model flowchart.
                                   Figure 3. Machine learning model flowchart.
                                           In order to create the trading signal for cryptocurrency trading, the model output is
                                         In order
                                     utilized, and to
                                                   thecreate  the trading
                                                       forecasting  approachsignal  for
                                                                              is used to cryptocurrency    trading,
                                                                                         forecast the trading signal. the
                                                                                                                      The model  output is
                                                                                                                          percentage
                                     change (pd) between each predicted price (A) and the last predicted close price of that
                                   utilized, and the forecasting approach is used to forecast the trading signal. The percent-
                                     cryptocurrency (B) is calculated using a percentage difference formula.
                                   age change (pd) between each predicted price (A) and the last predicted close price of that
                                   cryptocurrency (B) is calculated using
                                                               pd = 100    a percentage
                                                                        × |A  − B|/((A +difference
                                                                                        B)/2),    formula.           (1)

                                                                        pd = that
                                          The results of the (pd) revealed     100 ×the
                                                                                      |Apercentage
                                                                                          − B|/((A +difference
                                                                                                     B)/2), in price between the       (1)
                                     last day was positive, resulting in the signal returning “Buy”. If the percentage change
                                     wasThe   results
                                          equal  to or of the than
                                                       larger  (pd) 5%,
                                                                     revealed   thatreturned
                                                                         the signal   the percentage    difference
                                                                                              “Strong Buy”,    as theinmaximum
                                                                                                                        price between
                                                                                                                                 per- the
                                   last day was positive, resulting in the signal returning "Buy". If the percentage change
                                     centage  change   was observed   to  be around   5%. Figure 4 shows   the percentage  change in was
                                   equal  to or
                                     Bitcoin    larger than 5%, the signal returned "Strong Buy", as the maximum percentage
                                             price.
                                   change was observed to be around 5%. Figure 4 shows the percentage change in Bitcoin
                                   price.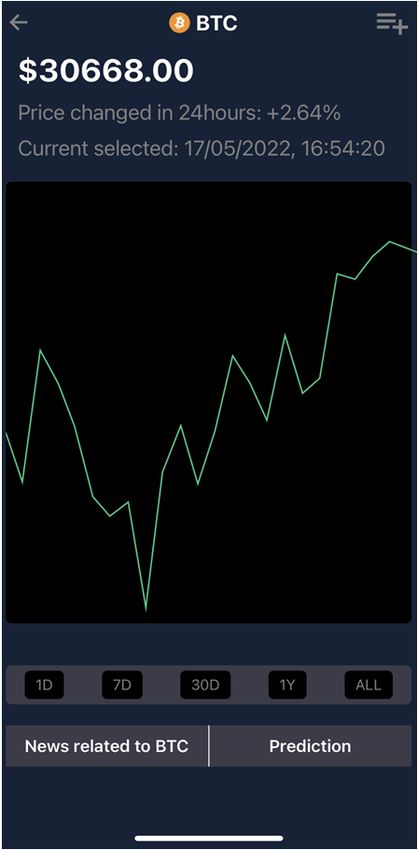
pd = 100 × |A − B|/((A + B)/2),                              (1)

                                     The results of the (pd) revealed that the percentage difference in price between the
                               last day was positive, resulting in the signal returning "Buy". If the percentage change was
                               equal to or larger than 5%, the signal returned "Strong Buy", as the maximum percentage
FinTech 2023, 2                                                                                                         159
                               change was observed to be around 5%. Figure 4 shows the percentage change in Bitcoin
                               price.

                               Figure4.4. March
                               Figure     March2022
                                                2022percentage
                                                    percentagechange
                                                               changeof
                                                                      ofBitcoin
                                                                         Bitcoinprice.
                                                                                 price.

                                    All the
                                    All  thesignal
                                             signal results
                                                     results calculated
                                                              calculated above
                                                                         above are
                                                                               are sent
                                                                                    sent to
                                                                                          to the
                                                                                              the prediction
                                                                                                  prediction API
                                                                                                             API server,
                                                                                                                 server, thereby
                                                                                                                          thereby
                               allowingthe
                               allowing   thesystem
                                              systemto toobtain
                                                          obtainpredicted
                                                                  predictedsignals
                                                                            signalsby
                                                                                    byposting
                                                                                       postingaarequest.
                                                                                                    request.

                               4. Prototype Result and Discussion
                               4.1. Implementation Results of the Model
                                   The accuracy formula will be used to evaluate the trading signal, with the January
                              2022 testing set being employed for each cryptocurrency.
                                   Table 2 shows the details of the datasets for analysis. Tweets contain a variety of
                              content from different users, some of which may be noisy. The raw data, having a polarity,
                              is susceptible to redundancy. Therefore, preprocessing of tweets is needed and includes the
                              following points: the removal of all URLs (e.g., www.abc.com), targets (@username), and
                              hashtags (e.g., #topic); the replacement of all emoticons and smileys; the removal of stop
                              words and punctuation; the replacement of extra white spaces; the removal of duplicate
                              tweets; the removal of tweets that contain “give away”, “pump”, “join”; the removal of
                              tweets with more than 14 hashtags; and the removal of tweets if the creator name contains
                              “bot” (as per the identification of cryptocurrency-related Twitter bot accounts [31]).

                               Table 2. Dataset composition.

 Dataset Name                              Source                                     Sentiment
                                           https://www.kaggle.com/datasets/ya         27,481 tweets, neutral 40%,positive31%,
 Twitter Tweets Sentiment Dataset
                                           sserh/twitter-tweets-sentiment-dataset     negative 28%
                                           https://www.kaggle.com/datasets/skul       23,965 tweets, positive 45%, neutral 43%,
 Bitcoin Tweets
                                           arat/bitcoin-tweets                        negative 12%
 Bitcoin/Ethereum/Dogecoin historical      https://www.investing.com/crypto/cry
                                                                                      N/A
 prices (January 2022)                     ptocurrencyname/historical-data
 Historical Tweets (January 2022)          scraper                                    N/A

                               4.2. Experiments on Sentiment Analysis
                                   Sentiment analysis models are used to understand the emotion communicated in a
                               tweet, whether it is positive, negative, or neutral. In order to determine the emotion of
                               a tweet, three different sentiment analysis models have been evaluated using the Twitter
                               Tweets Sentiment Dataset from Kaggle to train and test.
FinTech 2023, 2 160
4.2.1. TextBlob
The first sentiment analysis model that was tried was Textblob. An understanding of
sentiment analysis was sought, as well as the polarity relationship between tweets. Textblob
returns two properties of the tweets, polarity and subjectivity. The polarity score is a float
within the range [−1.0, 1.0], and the subjectivity is a float within the range [0.0, 1.0], where
0.0 is very objective, and 1.0 is very subjective. As Textblob is a pre-trained Lexicon-based
sentiment analyzer, no additional steps are required to use the model. For the first try,
values below [0] were assumed to be negative sentiment data, values equal to [0] were
assumed to be a neutral sentiment, and values above [0] were assumed to be a positive
sentiment. Table 3 shows the classification report of TextBlob. The classification report
shows that the overall accuracy of the model is 58%. Precision and recall for class 0 are
0.66 and 0.47, respectively, while precision and recall for class 1 are 0.59 and 0.50, respec-
tively. Furthermore, precision and recall for class 2 are 0.54 and 0.80, respectively. The
macro average of the precision, recall, and F1-score is 0.60, 0.59, and 0.58, respectively.
The weighted average of the precision, recall, and F1-score is 0.59, 0.58, and 0.57, respec-
tively. Overall, this classification report indicates that the model has performed relatively
FinTech 2023, 2, FOR PEER REVIEW well in terms of classifying the data into the three separate classes. The accuracy of the 9
model is not the highest, but it is still relatively good. Figure 5 shows the corresponding
confusion matrix.
Table 3. TextBlob
Table 3. TextBlob classification_report.
classification_report.
Precision Recall F1-Score Support
Precision Recall F1-Score Support
0 0.66 0.47 0.55 1556
0 0.66 0.47 0.55 1556
11 0.59
0.59 0.50
0.50 0.54
0.54 2224
2224
22 0.54
0.54 0.80
0.80 0.65
0.65 1717
1717
accuracy
accuracy // / / 0.58
0.58 5497
5497
macroavg
macro avg 0.60
0.60 0.59
0.59 0.58
0.58 5497
5497
weighted avg 0.59 0.58 0.57 5497
weighted avg 0.59 0.58 0.57 5497
Figure 5.
Figure Confusion matrix
5. Confusion matrix for
for TextBlob
TextBlob sentiment
sentiment analysis.
analysis.
4.2.2. Clustering with TextBlob
4.2.2. Clustering with TextBlob
TextBlob is the first sentiment analyzer, and its accuracy has been reported as 58%.
TextBlob
Blindly is thethe
clustering first sentiment
polarity analyzer,
score and its accuracy
and classifying has been
it as positive, reported
negative, or as 58%.
neutral
Blindly clustering the polarity score and classifying it as positive, negative, or neutral
may lead to inaccurate results. To achieve more consistent clustering, Jenks natural breaks may
lead to inaccurate
optimization can beresults. To achieve
implemented. Thismore consistent
technique clustering,
clusters Jenks naturaldataset
the one-dimensional breakswith
op-
timization can be implemented. This technique clusters the one-dimensional dataset
polarity values into different actual classes of data while maximizing the spaces between with
polarity values into different actual classes of data while maximizing the spaces between
the groupings. Figure 6 is the result of Jenks break for TextBlob. Jenks break clustered
polarity scores between [−1.0, −0.236] as negative sentiment data, between [−0.236, 0.328]
as neutral, and between [0.328, 1.0] as positive sentiment. The new model accuracy after
the Jenks break clustering is 59%. Table 4 shows the classification report of TextBlob to-FinTech 2023, 2 161
the groupings. Figure 6 is the result of Jenks break for TextBlob. Jenks break clustered
polarity scores between [−1.0, −0.236] as negative sentiment data, between [−0.236, 0.328]
as neutral, and between [0.328, 1.0] as positive sentiment. The new model accuracy after the
Jenks break clustering is 59%. Table 4 shows the classification report of TextBlob together
with clustering. The classification report indicates that the overall accuracy of the TextBlob
clustering model is 59%. This is slightly below average, showing that the model is not
particularly effective at accurately classifying the data. The precision scores for each cluster
are 0.79, 0.51, and 0.69, respectively. Precision indicates the percentage of correctly classified
instances out of all instances classified for each cluster. In this case, the model was not
particularly accurate in classifying the instances. The recall scores for each cluster are 0.32,
0.82, and 0.53, respectively. The model was more successful in this regard, with cluster
FinTech 2023, 2, FOR PEER REVIEW
1 having the highest recall score. The F1-scores for each cluster are 0.45, 0.63, and 0.60, 10
respectively. In this case, the model was not particularly accurate, with cluster 1 having the
highest F1-score.
Jenksbreak
Figure6.6.Jenks
Figure breakclustering
clusteringfor
forsentiment
sentimentanalysis.
analysis.
Table 4. Clustering with TextBlob classification_report.
Table 4. Clustering with TextBlob classification_report.
Precision
Precision Recall
Recall F1-Score
F1-Score Support
Support
00 0.79
0.79 0.32
0.32 0.45
0.45 1556
1556
1 0.51 0.82 0.63 2224
1 0.51 0.82 0.63 2224
2 0.69 0.53 0.60 1717
2
accuracy 0.69
/ 0.53
/ 0.60
0.59 1717
5497
accuracy
macro avg /
0.67 /
0.56 0.59
0.56 5497
5497
macro avg
weighted avg 0.67
0.65 0.56
0.59 0.56
0.57 5497
5497
weighted avg 0.65 0.59 0.57 5497
4.2.3. CNN-LSTM
4.2.3. CNN-LSTM
CNN-LSTM is an effective class of deep learning models for sentiment classification
tasksCNN-LSTM is an effective
due to its ability class
to extract of deepfrom
features learning models
text data andfor sentiment
then use these classification
features to
tasks due topredict
accurately its ability to extract of
the sentiment features from
the text. Thetext
CNN data and thenofuse
component thethese
modelfeatures to
can detect
accurately predict the sentiment of the text. The CNN component of the model can detect
patterns in the text, while LSTM is used to capture the temporal nature of the text and
patterns in the text,
its sentiment. Thiswhile LSTM isof
combination used
CNN to capture
and LSTM the provides
temporal an nature of theapproach
effective text and itsfor
sentiment.
classifyingThis combination
sentiment in text of CNN
data, and LSTM
making provides
it a suitable an effective
choice approach
for sentiment for clas-
analysis tasks.
sifying
In thissentiment
work, CNN in text data,to
is used making
extractitthe
a suitable choice
features of thefortokenized
sentimenttweets,
analysisand tasks.
LSTMIn
this work,
is used toCNN
predict is used to extract the
the sentiment features
of the tweet.ofThis
the tokenized
approach tweets, and LSTM
is well-suited is used
for Natural
toLanguage
predict the sentimenttasks,
Processing of the tweet.
such Thisclassification.
as text approach is well-suited
In comparison for Natural
to Textblob,Language
which
Processing tasks, such as text classification. In comparison to Textblob, which is ready to
is ready to use without any training, CNN-LSTM requires a more significant workload
use
for without
traininganyandtraining, CNN-LSTM
preprocessing. requires a more
The classification significant
report workloadcan
of CNN-LSTM for be
training
found
and preprocessing.
in Table The classification
5. The performance of thereport
CNN-LSTM of CNN-LSTM can be found
model appears to be in Table
fairly 5. TheIt
good.
performance of the CNN-LSTM model appears to be fairly good. It achieved an overall
accuracy of 70%, with precision scores of 0.69, 0.65, and 0.82 for classes 0, 1, and 2, respec-
tively. The recall scores were 0.71, 0.72, and 0.69 for classes 0, 1, and 2, respectively. The
F1-scores were 0.70, 0.68, and 0.75 for classes 0, 1, and 2, respectively. The weighted aver-FinTech 2023, 2 162
FinTech 2023, 2, FOR PEER REVIEW
achieved an overall accuracy of 70%, with precision scores of 0.69, 0.65, and 0.82 for
classes 0, 1, and 2, respectively. The recall scores were 0.71, 0.72, and 0.69 for classes
0, 1, and 2, respectively. The F1-scores were 0.70, 0.68, and 0.75 for classes 0, 1, and 2,
Table 5. CNN-LSTM
respectively. classification_report.
The weighted average F1-score, which takes into account all classes, was 0.71.
The corresponding confusion matrix is depicted in Figure 7.
Precision Recall F1-Score Sup
Table 5. CNN-LSTM classification_report.
0 0.69 0.71 0.70 1
1 Precision 0.65 Recall 0.72F1-Score 0.68
Support 2
0
1
2 0.69
0.65
0.82 0.71
0.72
0.69 0.70
0.68
0.75
1556
2224
1
accuracy
2 0.82 / 0.69 / 0.75 0.70
1717 5
macro avg
accuracy
macro avg
/
0.72
0.72 /
0.70
0.70 0.70
0.71
0.71
5497
5497
5
weighted
weighted avg avg 0.71 0.71 0.70 0.70 0.71 0.71
5497 5
Figure 7. Confusion matrix for CNN-LSTM sentiment analysis.
Figure 7. Confusion matrix for CNN-LSTM sentiment analysis.
The results of three different model performances show that the CNN-LSTM model
The
has the results
highest of three
accuracy different
and various model However,
advantages. performances show
a downside that theis CNN-LST
to consider the
has the highest accuracy and various advantages. However, a downside to consi
need for a training process and the requirement to learn a large number of words related to
cryptocurrency in order to understand tweets about cryptocurrency.
need for a training process and the requirement to learn a large number of word
to cryptocurrency
4.2.4. in order to understand
CNN-LSTM for Cryptocurrency Tweet tweets about cryptocurrency.
The CNN-LSTM model was trained with the Bitcoin Tweets dataset from Kaggle, as
4.2.4. CNN-LSTM
mentioned previously.for Cryptocurrency
Figure Tweettraining history, indicating that the
8 displays the model
accuracy of the model increases with the number of epochs. Table 6 shows the classification
reportThe CNN-LSTM
of the modelTweets
CNN-LSTM Bitcoin was trained withclassification
model. The the Bitcoin Tweets
report dataset
for the CNN- from K
mentioned
LSTM Bitcoin previously. Figure
tweets classification 8 displays
shows the model
that the model training
is performing wellhistory, indicating
in all classes.
accuracy of the model increases with the number of epochs. Table 6 shows the
The precision and recall scores are both at least 0.95 for the first class, 0.98 for the second
class, and 0.97 for the third class. The overall accuracy of the model is 0.97, which is
tion report
excellent. Theof the CNN-LSTM
average macro F1-scoreBitcoin Tweets
of 0.97 also showsmodel.
that theThe
modelclassification report for
is performing well
LSTM Bitcoin
in all classes. tweets
Overall, this classification
model seems to be shows that the
performing wellmodel is performing
for the given task. Figurewell
9 in a
The precision
displays and recall
the corresponding scores matrix.
confusion are both at least 0.95 for the first class, 0.98 for th
class, and 0.97 for the third class. The overall accuracy of the model is 0.97, whic
lent. The average macro F1-score of 0.97 also shows that the model is performin
all classes. Overall, this model seems to be performing well for the given task
displays the corresponding confusion matrix.2023, 2, FOR PEER REVIEW
FinTech 2023, 2 163
Figure 8. CNN-LSTM model training history for Bitcoin tweets.
Table 6. CNN-LSTM Bitcoin tweets classification_report.
Figure 8. CNN-LSTM
Figure model
8. CNN-LSTM modeltraining history
Precision
training history for Bitcoin
for Bitcoin tweets. tweets.
Recall F1-Score
0
Table 6. CNN-LSTM 0.95
Bitcoin tweets classification_report. 0.95 0.95
Table 6. CNN-LSTM Bitcoin tweets classification_report.
1 Precision 0.98 Recall 0.97
F1-Score 0.98
Support
0 2 Precision
0.95 0.97 0.95 Recall 0.98
0.95 11970.98
F1-Score Supp
0 accuracy 0.95 / 0.98 0.95
/0.98 0.9545780.97 119
1 0.98 0.97 4388
2 0.97 0.98
macro avg
1accuracy 0.98
/ 0.97 / 0.97 0.97
0.97 0.9810,1720.97 438
2weighted
avg avg 0.97
0.97 0.97 0.97 0.97
macro avg 0.97 0.97 0.97 10,172
weighted 0.97 0.98 0.97 0.9810,172 457
accuracy / / 0.97 1017
macro avg 0.97 0.97 0.97 1017
weighted avg 0.97 0.97 0.97 1017
Figure 9. Confusion matrix for CNN-LSTM bitcoin tweets.
Figure 9. Confusion matrix for CNN-LSTM bitcoin tweets.
4.3. Predicting Future Cryptocurrency Prices
4.3. The
Predicting Future Cryptocurrency Prices
effect of sentiment on cryptocurrency prices is well-known; therefore, a regression
machine-learning algorithm is required to predict future prices with sentiment. Decision
Tree, aThe
Figure 9. Confusioneffect
supervised of sentiment
matrix for CNN-LSTM
classification on cryptocurrency
machine tweets. prices
bitcoin algorithm,
learning is well-known;
was chosen there
for forecasting
sion machine-learning algorithm is required to predict future prices with s
cision Tree,
4.3. Predicting a supervised
Future Cryptocurrency classification
Prices machine learning algorithm, was ch
casting
The effectinitially, as it isona cryptocurrency
of sentiment simpler AI model. A decision
prices tree is much
is well-known; moreav
therefore,FinTech 2023, 2 164
initially, as it is a simpler AI model. A decision tree is much more visible, and its decisions
can be understood easier. However, a decision tree is susceptible to overfitting, and the
results are not exact. Random Forest Regression, on the other hand, is robust to outliers and
more accurate when compared to Decision trees. The Random Forest algorithm comprises
a large number of decision trees. The outputs from these randomly chosen decision trees
that make up the Random Forest are combined to make the final decision. Three Random
Forest Regressor models were trained using a combination of cryptocurrency prices from
January 2022 and sentiment from January 2022 cryptocurrency tweets. Each Random Forest
Regressor model corresponds to its respective cryptocurrencies, such as the Bitcoin Random
Forest Regressor learning from tweets related to Bitcoin and the Bitcoin historical price.
The MAE and MSE were employed to evaluate the model. The MAE and MSE of the
BTC-random forest model were 2788 and 10,540,621, respectively. The MAE and MSE of
the ETH-random forest model were 319 and 134,573, respectively. Lastly, the MAE and
MSE of the Doge-random forest model were 0.0134 and 0.000219, respectively.
4.4. Prototype
The work used @gensim, @pymongo, @pandas, @datetime, and @tweepy as the
libraries for the machine learning setup. In order to make Twitter’s tweets streaming
API work, a local MongoDB server was used for storing three different cryptocurrency
tweets collection and sentiment scores. RapidMiner Studio was also installed, and the
trained model was put into a custom process. The MongoDB URL was changed to the local
MongoDB URL. All dependencies and Python 3.6 or higher were installed. In this system,
an API service has been chosen to implement cryptocurrency data as it provides a vast
amount of data and reduces the risk of data loss for historical data. Additionally, using
an API service can reduce the cost of using database services and prevent the risk of SQL
injection by the user.
Users receive a list of cryptocurrencies first, which provides an overview of each. They
can then select the watchlist page, which displays all cryptocurrencies added by the user.
They also have the option to select a cryptocurrency and view its details, such as a price
chart and the latest price. After accessing the detail page, users can perform four actions:
add the cryptocurrency to the watchlist, remove it from the watchlist, execute the prediction
function, and view related news of the cryptocurrency.
From Figure 10a, a list of cryptocurrencies with their prices over the last 24 h, acquired
from the CoinGecko API, is provided. A tab navigator at the bottom of the page allows
the user to choose between the homepage and watchlist. By clicking on the watchlist tab,
the user is able to view any items that are on their watchlist, as shown in Figure 10b. If
the user selects a cryptocurrency, they will be directed to the detail page (Figure 10c). In
Figure 10c, the current price, price change, currently selected time, price chart, news button,
and prediction button are all obtained from the CoinGecko API. When the user points to
the price chart, the above values keep changing to the pointing value. Furthermore, the
user can press on the period bar to select a different period of the price chart. Each time the
user changes the period, the system calls the CoinGecko API again to obtain the data.
Furthermore, pressing the “News related to BTC” button executes the news function.
Figure 11a shows the news data obtained by the system, which sent a request to the
CryptoPanic API. Pressing the “prediction” button, if available, produces the prediction
result, which is shown as a popup message like Figure 11b. The result data is obtained
from the trading signal server. When the user presses the prediction button, the system
will send a request to the trading signal server if the function is available on the selected
cryptocurrency, and the result will be displayed as an alert message. Upon pressing the
news button, the system will send a request to the Cryptopanic API, and the result will be
displayed using the Flatlist component, which will list all related news.FinTech
FinTech 2, 2FOR PEER REVIEW
2023,
2023, 14165
(a) (b) (c)
Figure 10. Prototype screen dump of the (a) homepage, (b) watchlist, and (c) detail page.
Furthermore, pressing the “News related to BTC” button executes the news function.
Figure 11a shows the news data obtained by the system, which sent a request to the Cryp-
toPanic API. Pressing the “prediction” button, if available, produces the prediction result,
which is shown as a popup message like Figure 11b. The result data is obtained from the
trading signal server. When the user presses the prediction button, the system will send a
request to the trading signal server if the function is available on the selected cryptocur-
rency, and the (a)result will be displayed as an (b)alert message. Upon pressing (c) the news but-
ton, the system will send a request to the Cryptopanic API, and the result will be displayed
Figure 10.10.
Prototype screen
Prototype dump
screen dumpof of
thethe
(a)(a)
homepage,
homepage,(b)(b)
watchlist, and (c) detail page.
watchlist,
Figure
using the Flatlist component, which will list all related news. and (c) detail page.
Furthermore, pressing the “News related to BTC” button executes the news function.
Figure 11a shows the news data obtained by the system, which sent a request to the Cryp-
toPanic API. Pressing the “prediction” button, if available, produces the prediction result,
which is shown as a popup message like Figure 11b. The result data is obtained from the
trading signal server. When the user presses the prediction button, the system will send a
request to the trading signal server if the function is available on the selected cryptocur-
rency, and the result will be displayed as an alert message. Upon pressing the news but-
ton, the system will send a request to the Cryptopanic API, and the result will be displayed
using the Flatlist component, which will list all related news.
(a) (b)
Figure 11.11.Prototype
Figure screen-dump
Prototype screen-dumpofof(a)(a)news
newsfunction
functionand
and(b)
(b)prediction
predictionfunction.
function.
4.5. Trading Signal Prediction
Figures 12–14 show the results of the CNN–LSTM-based model for Bitcoin, Dogecoin,
and Ethereum over a period of one month. The red line indicates the predicted trend,
while the blue line indicates the actual trend. The cyan line shows the testing data, which
is randomly chosen from the actual trend. Figures 15–17 have eight periods, with each
edge between two points representing one period. These figures clearly demonstrate the
comparison between
(a) the predicted trend and the(b)
testing trend. Table 7 lists the total signal
and the successful signal for the same one-month period. The approach has an accuracy of
Figure 11. Prototype screen-dump of (a) news function and (b) prediction function.Figures 12–14 show the results of the CNN–LSTM-based model for Bitcoin, Doge-
coin, and Ethereum over a period of one month. The red line indicates the predicted trend,
while the blue line indicates the actual trend. The cyan line shows the testing data, which
is randomly chosen from the actual trend. Figures 15–17 have eight periods, with each
edge between two points representing one period. These figures clearly demonstrate the
FinTech 2023, 2 166
comparison between the predicted trend and the testing trend. Table 7 lists the total signal
and the successful signal for the same one-month period. The approach has an accuracy
of 62.5% in predicting the trends of the selected cryptocurrencies. The results depicted in
62.5% in predicting the trends of the selected cryptocurrencies. The results depicted in the
thegraphs
graphs and
and tables
tables indicate
indicate thatthat
this this approach
approach is stable
is stable and
and has thehas the capability
capability to predicttothe
predict
themarket
market trends of cryptocurrencies, thus generating trading
trends of cryptocurrencies, thus generating trading signals. signals.
Figure 12.12.
Figure The plot
The plotofofactual,
actual, test, andpredicted
test, and predictedtrends
trends
in in Bitcoin.
Bitcoin.
FinTech 2023, 2, FOR PEER REVIEW 16
Figure
Figure 13.13.
TheThe plotofofactual,
plot actual, test,
test, and
andpredicted
predictedtrends in in
trends Dogecoin.
Dogecoin.
Figure
Figure 14.14.
TheThe plotofofactual,
plot actual, test,
test, and
andpredicted
predictedtrends in Ethereum.
trends in Ethereum.FinTech 2023, 2 167
Figure 14. The plot of actual, test, and predicted trends in Ethereum.
Figure 14. The plot of actual, test, and predicted trends in Ethereum.
Figure
Figure15. Theplot
15.The
The plotof
plot tested vs.
of tested predicted trend
vs. predicted
predicted trend
trendininBitcoin.
Bitcoin.
FinTech 2023, 2, FOR PEER REVIEW 17
Figure 16. The
The plot
plot of tested vs. predicted
predicted trend
trend in Dogecoin.
Figure 16. The plot of tested vs. predicted trend in Dogecoin.
Figure 17. The plot of tested vs. predicted
predicted trend in Ethereum.
Table 7. Trading
Table 7. signal accuracy.
Trading signal accuracy.
Cryptocurrency
Cryptocurrency Test
TestSignal
Signal Successful
SuccessfulSignal
Signal Accuracy
Accuracy
Bitcoin
Bitcoin
88 55 0.625
0.625
Dogecoin
Dogecoin 88 55 0.625
0.625
Ethereum
Ethereum 88 55 0.625
0.625
5. Conclusions
In conclusion, this research has demonstrated the potential of combining sentiment
analysis with price prediction to create a cryptocurrency price tracker system. The pro-
posed model has achieved satisfactory accuracy in sentiment analysis and price trend pre-FinTech 2023, 2 168
5. Conclusions
In conclusion, this research has demonstrated the potential of combining sentiment
analysis with price prediction to create a cryptocurrency price tracker system. The proposed
model has achieved satisfactory accuracy in sentiment analysis and price trend prediction.
This study provides a novel approach to analyzing and predicting the cryptocurrency
market trend, which could benefit traders in their trading decision-making. In addition,
this research also provides a theoretical and practical framework for future research related
to cryptocurrency market trend analysis.
Author Contributions: Conceptualization, M.-F.L. and L.C.; methodology, W.-C.H., S.-F.T., C.-H.L.
and Y.-H.C.; software, W.-C.H.; validation, W.-C.H., S.-F.T., C.-H.L. and Y.-H.C.; formal analysis,
M.-F.L. and L.C.; investigation, M.-F.L.; resources, W.-C.H.; data curation, W.-C.H.; writing—original
draft preparation, W.-C.H., S.-F.T., C.-H.L. and Y.-H.C.; writing—review and editing, M.-F.L. and
L.C.; visualization, W.-C.H.; supervision, M.-F.L.; project administration, M.-F.L. and L.C.; funding
acquisition, M.-F.L. All authors have read and agreed to the published version of the manuscript.
Funding: This research received no external funding.
Institutional Review Board Statement: Not applicable.
Informed Consent Statement: Not applicable.
Data Availability Statement: Publicly available datasets were analyzed in this study. These data can
be found in the following URLs: https://www.kaggle.com/datasets/yasserh/twitter-tweets-senti
ment-dataset (accessed on 1 June 2022); https://www.kaggle.com/datasets/skularat/bitcoin-tweets
(accessed on 1 June 2022); https://www.investing.com/crypto/cryptocurrencyname/historical-data
(accessed on 1 June 2022).
Acknowledgments: The authors would also like to thank the anonymous reviewers for their insight-
ful comments.
Conflicts of Interest: The authors declare no conflict of interest.
References
1. Farell, R. An Analysis of the Cryptocurrency Industry. Penn Libraries Thesis, University of Pennsylvania Scholarly Commons,
Philadelphia, PA, USA, 2015. Available online: https://repository.upenn.edu/cgi/viewcontent.cgi?article=1133&context=whar
ton_research_scholars (accessed on 1 January 2022).
2. Wang, Y.; Chen, R. Cryptocurrency price prediction based on multiple market sentiment. In Proceedings of the 53rd Hawaii
International Conference on System Sciences, Maui, HI, USA, 7–10 January 2020.
3. Gandal, N.; Halaburda, H. Competition in the Cryptocurrency Market, CEPR Discussion Paper No. DP10157. Available online:
https://ssrn.com/abstract=2501640 (accessed on 1 January 2022).
4. Lamon, C.; Nielsen, E.; Redondo, E. Cryptocurrency price prediction using news and social media sentiment. SMU Data Sci. Rev.
2017, 1, 1–22.
5. Kim, K.; Kim, J.; Rinaldo, A. Time series featurization via topological data analysis. arXiv 2018, arXiv:1812.02987.
6. Velankar, S.; Valecha, S.; Maji, S. Bitcoin price prediction using machine learning. In Proceedings of the 2018 20th Interna-
tional Conference on Advanced Communication Technology (ICACT), Chuncheon, Republic of Korea, 11–14 February 2018;
pp. 144–147.
7. Jiang, Z.; Liang, J. Cryptocurrency portfolio management with deep reinforcement learning. In 2017 Intelligent Systems Conference
(IntelliSys); IEEE: Piscataway, NJ, USA, 2017; pp. 905–913.
8. Abraham, J.; Higdon, D.; Nelson, J.; Ibarra, J. Cryptocurrency price prediction using tweet volumes and sentiment analysis. SMU
Data Sci. Rev. 2018, 1, 1.
9. Jain, A.; Tripathi, S.; Dwivedi, H.D.; Saxena, P. Forecasting price of cryptocurrencies using tweets sentiment analysis. In
Proceedings of the 2018 Eleventh International Conference on Contemporary Computing (IC3), Noida, India, 2–4 August 2018;
pp. 1–7.
10. Hinton, G.E.; Osindero, S.; Teh, Y.W. A fast learning algorithm for deep belief nets. Neural Comput. 2006, 18, 1527–1554. [CrossRef]
[PubMed]
11. Dai, C.; Che, H.; Leung, M.F. A neurodynamic optimization approach for L1 minimization with application to compressed image
reconstruction. Int. J. Artif. Intell. Tools 2021, 30, 2140007. [CrossRef]
12. Li, J.; Che, H.; Liu, X. Circuit design and analysis of smoothed l0 norm approximation for sparse signal reconstruction. Circuits
Syst. Signal Process. 2022, in press. [CrossRef]FinTech 2023, 2 169
13. Leung, M.F.; Wang, J.; Che, H. Cardinality-constrained portfolio selection via two-timescale duplex neurodynamic optimization.
Neural Netw. 2022, 153, 399–410. [CrossRef] [PubMed]
14. Leung, M.F.; Wang, J.; Li, D. Decentralized robust portfolio optimization based on cooperative-competitive multiagent systems.
IEEE Trans. Cybern. 2022, 52, 12785–12794. [CrossRef] [PubMed]
15. Chen, K.; Che, H.; Li, X.; Leung, M.F. Graph non-negative matrix factorization with alternative smoothed L0 regularizations.
Neural Comput. Appl. 2022, in press. [CrossRef]
16. Che, H.; Wang, J.; Cichocki, A. Bicriteria sparse nonnegative matrix factorization via two-timescale duplex neurodynamic
optimization. IEEE Trans. Neural Netw. Learn. Syst. 2021, in press. [CrossRef]
17. Wang, J.; Wang, J.; Han, Q.L. Neurodynamics-based model predictive control of continuous-time under-actuated mechatronic
systems. IEEE/ASME Trans. Mechatron. 2021, 26, 311–322. [CrossRef]
18. Lv, G.; Peng, Z.; Liu, L.; Wang, J. Barrier-certified distributed model predictive control of under-actuated autonomous surface
vehicles via neurodynamic optimization. IEEE Trans. Syst. Man Cybern. Syst. 2023, 53, 563–575. [CrossRef]
19. Bello, A.; Ng, S.C.; Leung, M.F. A BERT Framework to Sentiment Analysis of Tweets. Sensors 2023, 23, 506. [CrossRef] [PubMed]
20. Li, H.; Wang, J. CAPKM++ 2.0: An upgraded version of the collaborative annealing power k-means++ clustering algorithm.
Knowl. Based Syst. 2023, 262, 110241. [CrossRef]
21. Li, H.; Wang, J. Capacitated clustering via majorization-minimization and collaborative neurodynamic optimization. IEEE Trans.
Neural Netw. Learn. Syst. 2022, in press. [CrossRef]
22. Wang, Y.; Wang, J.; Che, H. Two-timescale neurodynamic approaches to supervised feature selection based on alternative problem
formulations. Neural Netw. 2021, 142, 180–191. [CrossRef] [PubMed]
23. Chakravarthi, B.; Ng, S.C.; Ezilarasan, M.R.; Leung, M.F. EEG-based emotion recognition using hybrid CNN and LSTM
classification. Front. Comput. Neurosci. 2022, 16, 1019776. [CrossRef]
24. Xu, G.; Meng, Y.; Qiu, X.; Yu, Z.; Wu, X. Sentiment analysis of comment texts based on BiLSTM. IEEE Access 2019, 7, 51522–51532.
[CrossRef]
25. Loper, E.; Bird, S. Nltk: The natural language toolkit. arXiv 2002, arXiv:cs/0205028.
26. Peng, C.Y.J.; Lee, K.L.; Ingersoll, G.M. An introduction to logistic regression analysis and reporting. J. Educ. Res. 2002, 96, 3–14.
[CrossRef]
27. Jiang, L.; Li, C.; Wang, S.; Zhang, L. Deep feature weighting for naive Bayes and its application to text classification. Eng. Appl.
Artif. Intell. 2016, 52, 26–39. [CrossRef]
28. Sebald, D.J.; Bucklew, J.A. Support vector machine techniques for nonlinear equalization. IEEE Trans. Signal Process. 2000, 48,
3217–3226. [CrossRef]
29. Lebensold, J. React Native Cookbook: Bringing the Web to Native Platforms; O’Reilly Media, Inc.: Sebastopol, CA, USA, 2018.
30. García, S.; Luengo, J.; Herrera, F. Data Preprocessing in Data Mining; Springer International Publishing: Cham, Switzerland, 2015;
Volume 72.
31. Kraaijeveld, O.; De Smedt, J. The predictive power of public Twitter sentiment for forecasting cryptocurrency prices. J. Int. Financ.
Mark. Inst. Money 2020, 65, 101188. [CrossRef]
Disclaimer/Publisher’s Note: The statements, opinions and data contained in all publications are solely those of the individual
author(s) and contributor(s) and not of MDPI and/or the editor(s). MDPI and/or the editor(s) disclaim responsibility for any injury to
people or property resulting from any ideas, methods, instructions or products referred to in the content.You can also read