Measuring and Modeling of Snowmobile Noise - Xuetao Zhang - DIVA
←
→
Page content transcription
If your browser does not render page correctly, please read the page content below

Measuring and Modeling of Snowmobile Noise
                                                                            Xuetao Zhang
SP Technical Research Institute of Sweden

                                                                              Energy Technology

                                                                              SP Report 2012:17
Measuring and Modelling Snowmobile
Noise
Xuetao Zhang

3
Abstract
Two typical snowmobiles, one with two-stroke engine (113 kW) and the other with four-
stroke engine (88.4 kW), have been measured under different operating conditions:
stationary and at the idling engine rpm, or at a high rpm just below the
engagement, or at the one in the between;
stationary and with engine rpm swept from the idling rpm to the high rpm;
cruise-by at a speed of 25 km/h, 50 km/h or 75 km/h;
pass-by at full throttle.
Data were collected by recording the time history of the noise emission, at four receiver
positions. This time-history recording of the noise emission is of a great advantage in
post-analysis because it saves the full information of the noise emission. Then any desired
quantity such as SEL, Leq , or L pAS max , in any time period, becomes available in a post-
processing. The four receiver positions are (d/h): 7.5/1.2 m which is the standard position
in measuring road traffic noise and railway noise, 15/1.2 m which is the standard position
according to the North-America test method for acoustical certification of snowmobiles,
25/1.2 m and 25/3.5 m which are the two optional standard positions in measuring road
traffic noise and railway noise and which can also be used for evaluating ground effect on
sound propagation.
Also measured is the sound propagation above snow, by using a point sound source.
Moreover, the noise emission data of the four snowmobiles collected in 2009 by SP
Acoustics, and the snowmobile noise data found in literature, are referred to when making
the data analysis.
The main findings, outputs and conclusions are:
Engine/exhaust noise is the primary snowmobile noise. The speed dependence of
it can be described by 25*log10(V), where V is the speed;
Non-engine noise is negligible when a snowmobile drives on a soft trail;
On a trail of compacted snow, non-engine noise can become comparable to the
engine noise, above 300 Hz, for some snowmobile models. Non-engine noise can
become more serious if a snowmobile drives on an ice-hard surface;
The modified one-parameter impedance model (see section 3 for the definition)
can be used to handle sound propagation above snow;
A simple source model of snowmobile noise has been worked out. Then, the
sound power level of snowmobile noise at a given speed becomes predictable, for
the two typical snowmobiles tested within this project. The North-America noise
indicator, L pAS max , has also been related to in this source modelling;
Based on a study of available noise emission data of snowmobiles, the tested two
snowmobiles are found to be representative. Therefore, this simple source model
of snowmobile noise is believed to be generally applicable;
Sound attenuation in forest has been proposed based on a literature study together
with a reference to Finnish data;
Sound attenuation of snowmobile noise has been calculated and is provided in
tabular values for four typical terrains and up to 10 km. The four typical terrains
are: a flat and open field covered by soft snow, a flat and open field of an ice-
hard surface such as a frozen lake, a forest of a flat ground covered by soft snow,
and an open mountain area with a grade of 30% (i.e. a raise of 3 m for every 10 m
of run) covered by soft snow;
4
Noise impact of snowmobiles has also been calculated for the four typical
terrains and up to 10 km;
Modelling the non-engine noise is left to future research, because it requires an
extensive measurement study on a variety of snowmobile types combined with
several typical trail conditions (i.e. soft, moderate hard and ice-hard trails), which
has not been covered by this small project.
It was found that the noise indicators, L pAS max and LeqA , are not simply related.
If L pAS max limit value will be lowered by dL, the consequential reduction in
LeqA will be less and possibly be about 0.6dL ~ 0.7dL (if there is no change in the
traffic volume).
Key words: snowmobile, noise emission, measurement, engine noise, non-engine noise,
source modelling, flow resistivity, sound attenuation in forest, sound attenuation above
snow
SP Sveriges Tekniska Forskningsinstitut
SP Technical Research Institute of Sweden
SP Report :2012:17
ISBN 978-91-87017-37-7
ISSN 0284-5172
Borås 2012
5

Contents
Abstract                                                                      3

Contents                                                                      5

Preface 7

Sammanfattning                                                                8

1             Introduction                                                    11

2             Measurement of snowmobile noise                                 13
2.1         Measurement site and measurement conditions                       13
2.2         The tested snowmobiles                                            14
2.3         Measurements                                                      15
      2.3.1 Sound propagation of a point source above snow                    15
      2.3.2 Snowmobile stationary noise                                       15
      2.3.3 Snowmobile pass-by noise                                          15

3             Sound propagation above snow                                    17
3.1           The impedance model                                             17
3.2           Effective flow resistivity of a snow covered field              18
3.3           Sound propagation of the point source at the measurement site   19

4             Analysis of the measurements                                    23
4.1           The engine noise of the two snowmobiles                         23
      4.1.1   Measurement arrangement                                         23
      4.1.2   The noise spectrum of snowmobile engine noise                   24
      4.1.3   The rpm dependence of snowmobile engine noise                   25
      4.1.4   The source height of snowmobile engine noise                    27
4.2           Snowmobile pass-by noise: under a constant speed                30
      4.2.1   Measurement arrangement                                         30
      4.2.2   The noise spectrum of snowmobile pass-by noise                  31
      4.2.3   The speed dependence of snowmobile pass-by noise                36
4.3           Snowmobile pass-by noise: at full throttle                      38
      4.3.1   The North-America method SAE J192                               38
      4.3.2   Measurement arrangement                                         39
      4.3.3   The noise spectrum                                              39
4.4           Referring to some earlier measurements                          41
      4.4.1   Non-engine noise                                                42
      4.4.2   Directivity of engine noise                                     46

5             Modelling snowmobile noise                                      47
5.1           Literature study                                                47
5.2           Noise source and source height                                  48
5.3           Sound power and speed dependence                                48
5.4           Other factors                                                   51
5.5           Exhaust modification                                            51

6             Noise impact of snowmobiles                                     53
6.1         Propagation attenuation of snowmobile noise                       53
6.2         Noise impact of snowmobiles                                       58
      6.2.1 Instantaneous SPL caused by a single snowmobile                   58
      6.2.2 Equivalent SPL of snowmobile traffic noise                        62
6

      6.2.3 Consideration of noise spectrum components   70
6.3         About the new noise limit values             71

7          Summarization and discussion                  73

Reference                                                75
7

Preface
This project is funded by the Swedish Transport Agency (Transportstyrelsen), with the
registration number TSG 2011-6321.

The project has been carried out by Dr. Xuetao Zhang, Acoustics Section, SP Technical
Research Institute of Sweden. Dr. Krister Larsson (SP) is the project leader.

Dr. Krister Larsson, Dr. Hans Jonasson (SP) and Stefan Frisk (SMP Swedish Machinery
Testing Institute) engaged in the measurement planning. Stefan Frisk and Joachim
Grönlund (SMP) took part in carrying out the measurement. Stefan Frisk provided
valuable knowledge on snowmobiles.

All these supports are greatly appreciated!

Xuetao Zhang
September 2012, Borås
8
Sammanfattning
Tvåtypiska snöskotrar, en med tvåtaktsmotor (113 kW) och en med fyrtaktsmotor (88,4
kW), har testats under olika driftsförhållanden:
Stillastående påtomgång, eller vid ett högt motorvarvtal under ingrepp, eller vid
ett motorvarvtal mellan dessa;
Stillastående med motorvarvtalet svept mellan tomgång och det högre varvtalet;
förbipassage med en hastighet av 25 km/t, 50 km/t och 75 km/t;
förbipassage vid full acceleration.
Data samlades in genom att registrera tidshistoriken av ljudet vid fyra mottagarpositioner.
En inspelning av ljudet är en stor fördel i analysen av data, eftersom all information har
sparats och önskade mått som SEL, Leq eller L pAS max blir tillgängliga i varje tidsperiod.
De fyra mottagarpositioner är (d / h): 7.5/1.2 m, som är standardpositionen vid mätning
av vägtrafikbuller och järnvägstrafikbuller, 15/1.2 m som är standardposition enligt Nord-
Amerika testmetoden för certifiering av en snöskoter, 25/1.2 m och 25/3.5 m som är de
tvåvalfria standard positioner vid mätning av vägtrafikbuller och järnvägstrafikbuller och
som ocksåkan användas för att utvärdera markeffekter påljudutbredning.
Dessutom mättes ljudutbredningen över snömed hjälp av en punktljudkälla. Dessutom
utnyttjades data för fyra snöskotrar som samlades in 2009 av SP Akustik, samt bullerdata
som finns i litteraturen när dataanalys gjordes.
De viktigaste resultaten och slutsatserna är:
Motor/avgasljudet är den största bullerkällan hos snöskotrar. Hastighetsberoendet
kan beskrivas med, baserat påtillgängliga data, 25 * log10 (V), där V är
hastigheten i km/t;
Icke-motorljud är försumbart när en snöskoter kör påett mjukt underlag;
Påett underlag med packad snö, kan icke-motorljudet bli jämförbart med
motorbullret över 300 Hz, för vissa snöskoter modeller. Om en snöskoter driver
påen is-hård yta kan icke-motorljudet bli högre än motorljudet;
Den modifierade enparameter impedans modellen (se avsnitt 3 för definitionen)
kan användas för att hantera ljudutbredning över snö;
En enkel källmodell av snöskoterbuller har utarbetats. Med hjälp av den kan
ljudeffektnivåav snöskoterbuller vid en given hastighet förutsägas för de två
typiska skotrarna som testats inom detta projekt. Sambandet med det
Nordamerikanska bullermåttet har ocksåutarbetats i denna källmodell;
De tvåtestade snöskotrar har befunnits vara representativa för snöskotrar baserat
påen studie av tillgängliga data. Därför tros denna enkla källmodell av
snöskoterbuller vara allmänt tillämplig;
Ljuddämpning i skogen har föreslagits utifrån en litteraturstudie tillsammans med
en hänvisning till uppgifter från finska studier;
Ljuddämpning av snöskoterbuller har beräknats och anges i tabellform för fyra
typiska terränger upp till 10 km avstånd. De fyra typiska terrängerna är: ett platt
och öppet område som täcks av mjuk snö, ett platt och öppet fält av en is-hård
yta, t.ex. en frusen sjö, en skog med plan mark täckt av mjuk snö, och ett öppet
fjällområde med en lutning av 30% (dvs. en höjning på3 meter för varje 10 m
körning), som täcks av mjuk snö;
Bullernivåer från snöskotrar har ocksåberäknats för de fyra typiska terrängerna
upp till 10 km avstånd;
Modellering av icke-motorljudet lämnas till framtida forskning, eftersom det
kräver en omfattande mätstudie påen variationnav olika snöskotrar i kombination
9
med flera typiska markförhållanden (dvs. mjuka, måttliga hårda och is-hårda
spår), som inte omfattas av detta projektet.
Det visade sig att bullermåtten, L pAS max och LeqA , inte är relaterade påett enkelt
sätt. Om gränsvärdet L pAS max sänks med dL, komner minskningen av ljudnivån
LeqA att vara mindre, omkring 0.6dL ~ 0.7dL, om det inte finns någon förändring
i trafikvolymen.
10
11

1            Introduction
Nowadays environmental noise has become a social concern. One of such environmental
noise problems is acoustical pollution in noise-free mountain areas. Terrain vehicles
including snowmobiles are one of a few kinds of noise sources in these mountain areas.
In Sweden, about 8000 snowmobiles are sold every year; and, there are in total nearly 150
000 snowmobiles in use. The Swedish speed limit for snowmobiles is 70 km/h [1, 18].

During 2009 the European Commission was expected to elaborate an addendum to the
Directive 2000/14/EC on noise emission from equipment used outdoors. As at present
noise emission from snowmobiles has not been regulated, in order to have the noise
emission limit included in the ongoing revision of the directive, Sweden is a driving force
in terms of noise requirements on snowmobiles. According to the North-America
regulation, the noise limit for snowmobiles is 78 dB(A) (under the prescribed test
conditions). Sweden’s ambition is to set new limit values in two steps, with levels 75
dB(A) to 2017 and 73 dB(A) to 2021. For Sweden to work out a proposal of an
international level a solid knowledge base is required. This knowledge is also needed as
an assistant to achieve the national target, a magnificent mountain landscape.

The solid knowledge base mentioned above consists of two parts: the sound attenuation
above snow for typical terrains as well as a proper description of the sound power of
snowmobile noise. Within this project, which was ordered by the Swedish Transport
Agency, these two tasks have been worked on.

For sound propagation above snow, a literature study has been made in order to find a
proper method to handle such situations. Moreover, for validating the chosen method, a
well designed propagation measurement using a point sound source has been carried out.
As described in section 3, the two-parameter impedance model proposed in [2-3], or, the
modified one-parameter impedance model described in [4] which is in fact the simplified
version of the two-parameter model, has been found most suitable in describing sound
propagation above snow.

Aiming at determining the sound power of snowmobile noise together with its speed
dependence, a systematic measurement investigation has been made. Two typical
snowmobiles, one with two-stroke engine (113 kW) and the other with four-stroke engine
(88.4 kW), have been measured under different operating conditions: stationary, cruise-by
and pass-by at full throttle. The measurement arrangement and measurement details are
described in section 2 while the technical details of the measurement can also be found in
section 4. In section 4, data analysis was made, which also refers to the noise emission
data of the four snowmobiles measured in 2009 by SP. The engine noise and non-engine
noise, as well as the speed dependence, have been studied. Thus, based on this analysis
and other noise data found in literature, a source model of snowmobile noise has been
worked out. The process to reach this source model is described in section 5.

In section 6 sound attenuation above snow for four typical terrains is provided in tabular
values, wherein a neutral weather condition as well as a downwind condition has been
assumed. These sound attenuation values, together with the source model of snowmobile
noise, provide people a great convenience in evaluating the noise impact of snowmobiles.
Moreover, example noise impacts of snowmobiles, the instantaneous SPL of a single
snowmobile and the equivalent SPL of snowmobile passing by, have also been calculated
and provided in tabular values, for the four typical terrains.

And, in the last section, a survey of all the outputs has been provided.
12
13

2           Measurement of snowmobile noise
The purpose of the measurements is to collect noise emission data of snowmobiles, to
work out a source model for describing snowmobile noise.

The measurement was carried out in Umeå, February 23, 2012.

2.1         Measurement site and measurement conditions
The measurement site is Röbäcksdalen in Umeå, which has a free radius of about 500 m.
Two photos given in Figure 2-1 provide a view of the measurement site.

Figure 2-1. The microphone positions and the travel path at the measurement site
Röbäcksdalen, Umeå.

The snow depth is about 53 cm at the microphone positions and about 35 cm along the
travel path. The temperature is 1 oC and wind speed is about 3~5 m/s, roughly in 45o from
the travel path down to the microphone stands.
14

2.2        The tested snowmobiles
Two snowmobiles of popular brands are tested: Arctic Cat 2012 XF 800 HIGH
COUNTRY Sno Pro OS BLK (hereafter, the Arctic Cat), of two stroke engine and 2012
Yamaha RS Venture GT (hereafter, the Yamaha), of 4 stroke engine. Descriptions of
these two snowmobiles are given below.

1. Snowmobile Arctic Cat 2012 XF 800 HIGH COUNTRY SP OS BLK

      Chassis no                      Engine                  Track width   Total weight
                                                                 (mm)           (kg)
4UF12SNWXCT120214 Two-stroke, two cylinder, liquid-               381           254
                  cooled, 113 kW (~152 hp)

2. Snowmobile 2012 Yamaha RS Venture GT

      Chassis no                      Engine                  Track width   Total weight
                                                                 (mm)           (kg)
Not recorded             Four-stroke, three-cylinder, twin-       381           349
                         valve, liquid-cooled, 88.4 kW
                         (~120 hp)
15
2.3 Measurements
Three types of measurements have been carried out, as described in the following.
The measurement system is 01dB with four channels.
2.3.1 Sound propagation of a point source above snow
This measurement is to determine the effective flow resistivity of the snow covered
ground, which is the necessary parameter in handling sound propagation above snow.
A sound source, Brüel & Kjær HP 1001 type (shown in Figure 3-2), was used. The four
microphones positions are (d/h): 7.5/1.2, 15/1.2, 25/1.2 and 25/3.5 (m). These
microphone positions have also been used for the pass-by measurements.
The measurement details and the data analysis are described in section 3.
2.3.2 Snowmobile stationary noise
There are no doubts that engine noise is the most important component of snowmobile
noise. However, in general, other noise types such as transmission noise, suspension
noise and track noise may also contribute to the total snowmobile noise. Therefore, this
type of measurements is for collecting engine noise data of the two snowmobiles.
The four microphone positions are (d/h): 7.5/1.2, 7.5/2 and 7.5/3.5 m for the three
microphones along the normal line passing through the centre of the snowmobile (here
7.5 m is the distance between the microphone position and the snowmobile axis line); the
fourth microphone has a position similar to the first one (7.5/1.2 m) but one snowmobile
length (3.3 m) shifted to the rear side from the normal line. This fourth position is for
checking out if there is an important effect of horizontal directivity.
To find out the rpm dependence, engine noise has been measured under three rpm values:
the idling rpm, a high rpm which is below but close to the engagement rpm1 and a rpm in
between. Engine noise under an acceleration operating condition was also measured.
However, as only a gentle acceleration was possible to avoid engagement, it in fact
becomes a sweep operating condition (i.e. during the measurement the rpm value varies
from the idling rpm to the high rpm).
The data analysis for this measurement type is given in sub-section 4.1.
2.3.3 Snowmobile pass-by noise
Four microphone positions are (d/h): 7.5/1.2, 15/1.2, 25/1.2 and 25/3.5 m.
The first microphone position, 7.5/1.2 m, is the standard position used for measuring road
vehicle noise and railway noise. The second microphone position, 15/1.2 m, is close to
the standard position, 50/4 feet, which is used according to the North-America standard
SAE J192 [5]. The use of this position is aiming at understanding the North-America
noise limits. The last two microphone positions, 25/1.2 and 25/3.5 m, are used for
validating the impedance model in determining sound attenuation above snow.
1
The engagement rpm means that at this rpm value the snowmobile will start to move.16 Two types of pass-by measurements are carried out: pass-by under a constant speed and pass-by at full throttle. For pass-by under a constant speed, three speeds were taken: 25 km/h, 50 km/h and 75 km/h. This measurement type is for collecting noise emission data for determining the total sound power of snowmobile noise and also for determining the speed dependence of the noise emission. The measurement arrangement and the analysis of the noise emission data are given in sub-section 4.2. The pass-by at full throttle is for collecting the noise data under the conditions the same as those described in SAE J192, in order to understand the North-America noise limits. The measurement arrangement and the data analysis are given in sub-section 4.3.
17
3 Sound propagation above snow
The Nord2000 propagation model was used to calculate sound propagation outdoors. As
the impedance model for snow has not been implemented in the latest calculation
software, compro18e, this function has been added according to Eqs. (3-1)-(3-3) given in
sub-section 3.1.
In the following sub-sections the impedance model, the method to determine the snow
flow resistivity and the snow flow resistivity of the measurement site in Umeåwill be
described.
3.1 The impedance model
To handle sound propagation above a ground of a finite impedance, a proper impedance
model is needed. As proposed in the relevant Nordtest method [4], the modified one-
parameter model shall be used for a snow covered ground
Z n Z n1 * i cot Lk , (3-1)
2f
0.70 0.59
1000 f 1000 f
k 1 10.8 i10.3 , (3-2)
c
0.75 0.73
1000 f 1000 f
Z n1 1 9.08 i11.9 , (3-3)
where L is the snow depth. The Eq. (3-3) is the well known one-parameter impedance
model developed by Delany and Bazley [6].
0.06
real
imag
0.04
0.02
0
-0.02
-0.04
-0.06
1 2 3 4
10 10 10 10
Z(Nordtest) - Z(Nicolas)
Figure 3-1. The difference of the model impedance values for a snow covered field of the
thickness 5 cm and the flow resistivity 16 kPa s m-2. The two models are described in [2,
4].18
This modified one-parameter impedance model differs slightly from a more general two-
parameter impedance model [2, 3]. However, calculation shown in Figure 3-1 indicates
that the difference between two models’ outputs is negligible above 100 Hz and still very
small under 100 Hz. Therefore, it is considered proper to use the modified one-parameter
model to handle sound propagation above snow.
3.2 Effective flow resistivity of a snow covered field
According to the extensive investigation on sound propagation above a finite layer of
snow [2], it is concluded that the extended model in terms of a flow resistivity and a snow
thickness must be used.
The effective flow resistivity of a snow covered field varies with the snow condition. The
case study presented in [2] suggests the following:
1. For fresh or loose snow, the effective flow resistivity is often within the range of
about 10~20 kPa s m-2;
2. The hardening of snow by wind and/or by sunshine can increase the effective
flow resistivity up to 150 kPa s m-2;
3. Fresh/loose snow of a thickness over 20 cm is acoustically equivalent to
fresh/loose snow of infinite thickness.
4. For a layer of fresh/loose snow above a layer of hardened snow, the effective
flow resistivity and the effective snow thickness can in many cases be determined
by the layer of fresh/loose snow. However, there is an exception as stated in the
following.
5. More complicated, if a few cm of fresh snow fell above a few cm of slightly
hardened snow, the effective snow thickness will always be less than the total
thickness of the two snow layers. The effective flow resistivity is between that for
the fresh snow and that for the hardened snow.
For general applications, it is not reasonable to require the information of detailed snow
conditions over a large area. Therefore, the complicated situation discussed above, the
last point, will not be considered.
The relevant Harmonoise proposal [7] is: (1) the range of effective flow resistivity for
snow is between 1.3 and 50 kPa s m-2; (2) the average is 29 kPa s m-2.
The method to determine the effective flow resistivity of a snow covered field is
described in the following:
1) To use the modified one-parameter impedance model (sub-section 3.1).
2) Except the complicated case mentioned above, the snow depth is the real snow
depth if only one layer of snow is concerned, or the depth of the upper layer of
fresh/loose snow if there is also an under layer of hardened snow.
3) To adjust the effective flow resistivity to predict SPL best comparable to the
measured SPL at the receiving position(s).
4) For the complicated case mentioned above, following the method described in
[2], one should first determine the effective snow depth by positioning the first
minimum in spectrum (of the SPL at the receiver) at the right frequency, which
always gives the effective snow depth between the total one of the two snow
layers and the one of the fresh/loose snow layer. The next step is to adjust the
effective flow resistivity to predict the level at this minimum. Thus, the effective
snow depth and the effective snow flow resistivity are determined (while only
valid for this receiver position).19
3.3 Sound propagation of the point source at the
measurement site
The standard sound source, Brüel & Kjær HP 1001 type, was used
as the point sound source, see Figure 3-2. Its acoustical centre is
estimated to be located at its geometrical centre. Three source
heights, 0.1 m, 0.5 m and 1 m (above the snow covered ground),
have been used for the point source propagation measurement. The 4
microphone positions are (d/h, in meter): 7.5/1.2, 15/1.2, 25/1.2 and
25/3.5, as shown in Figure 3-3.
Figure 3-2. The sound source.
Figure 3-3. The setup for the sound propagation measurement using a point sound
source (Röbäcksdalen, Umeå, February 2012).
Figure 3-4. A crusty snow layer of about 6 cm (left) is under the loose snow of 7 cm.
During the measurement, the wind speed is about 3~5 m/s, roughly in 45 degrees from
the travel path downwards to the microphone positions. The temperature is 1 oC.20
Currently, there are two methods to determine the effective flow resistivity of a ground of
finite impedance: (1) the level difference method as described in [4]; (2) the data fitting
method as shown in [2], or described in sub-section 3.2 of this report. As the level
difference method described in [4] is based on the one-parameter impedance model which
has been shown not proper for a snow covered ground [2], the effective flow resistivity of
the measurement site will be determined by the data fitting method.
(Note: SP has tried several times using the Nordtest method [4], which does not work at
low frequencies, to determine the effective flow resistivity of a snow covered field.
However, none of the results has been shown to be valid, although these data all suggest
an effective flow resistivity about 10~16 kPa s m-2.)
point sound source
70
60
model-hr1
50
data-hr1
40 no excess
2 3 background 4
10 10 10
hr1: 7.5m/1.2m hs: 1 m sigma: 20000 Pa*s/m 2
70
60
50 model-hr2
40 data-hr2
no excess
30 background
2 3 4
10 10 10
2
hr2: 15m/1.2m hs: 1 m sigma: 20000 Pa*s/m
60
50
model-hr3
40
data-hr3
30 no excess
2 3 background 104
10 10
hr3: 25m/1.2m hs: 1 m sigma: 20000 Pa*s/m 2
60
50
model-hr4
40
data-hr4
30 no excess
2 3 background 104
10 10
hr4: 25m/3.5m hs: 1 m sigma: 20000 Pa*s/m 2
Figure 3-5a. Sound propagation above snow at the measurement site in Umeå, using the
point sound source (Figure 3-2). The nominal sound power is given within the octave
bands 125 ~8k Hz, which corresponds to the one-third octave bands of 100 ~ 10k Hz.
Therefore, below 100 Hz, the sound power drops quickly.21
The total snow depth at the microphone positions is 53 cm. Below the loose snow of
about 7 cm thick there is a layer of lightly-crusty snow of about 6 cm thick, as shown in
Figure 3-4.
Based on the data fitting, the effective flow resistivity was determined to be 20 kPa s m-2.
As shown in Figure 3-5, below 100 Hz the model predicted SPLs at the receivers differ
much from the respective measured SPLs, due the two reasons: (1) the nominal sound
power of the point source is given in octave bands of 125 – 8k Hz, which corresponds to
the one-third octave bands of 100 – 10k Hz; therefore, the sound power drops quickly
beyond 100 – 10k Hz; (2) below 100 Hz background noise (measured at a different time)
becomes important.
point sound source
70
60
model-hr1
50
data-hr1
40 no excess
2 3 background 4
10 10 10
hr1: 7.5m/1.2m hs: 0.5 m sigma: 20000 Pa*s/m 2
70
60
50
model-hr2
40 data-hr2
no excess
30
2 3 background 104
10 10
hr2: 15m/1.2m hs: 0.5 m sigma: 20000 Pa*s/m 2
60
50
40 model-hr3
data-hr3
30 no excess
2 3
10 10 background 104
hr3: 25m/1.2m hs: 0.5 m sigma: 20000 Pa*s/m 2
60
50
40 model-hr4
data-hr4
30
no excess
2 3
10 10 background 104
hr4: 25m/3.5m hs: 0.5 m sigma: 20000 Pa*s/m 2
Figure 3-5b. The caption is the same as that for Figure 3-5a. (Here hs = 0.5 m.)
Moreover, at the receiver positions of 25 m distance, some error around 200 Hz can be
found. This is in fact a typical problem of the ground impedance model for a snow field
with its porosity varying with depth. In such a case the position of the first minimum in22
frequency spectrum together with the level can be handled only empirically, because the
necessary information concerning the detailed properties of the snow is not available [2].
We decide not to care about this error, because (1) it is not important when considering
the total noise sound level and (2) when handling sound propagation over a large snow
covered field it is not practical to care this kind of local details which can vary a lot point
by point.
point sound source
70
60
model-hr1
50
data-hr1
40 no excess
2 3 background 4
10 10 10
hr1: 7.5m/1.2m hs: 0.1 m sigma: 20000 Pa*s/m 2
70
60
50 model-hr2
40 data-hr2
no excess
30 background
2 3 4
10 10 10
2
hr2: 15m/1.2m hs: 0.1 m sigma: 20000 Pa*s/m
60
50
model-hr3
40
data-hr3
30 no excess
2 3 background 4
10 10 10
hr3: 25m/1.2m hs: 0.1 m sigma: 20000 Pa*s/m 2
60
50
40 model-hr4
data-hr4
30 no excess
2 3 background 104
10 10
hr4: 25m/3.5m hs: 0.1 m sigma: 20000 Pa*s/m 2
Figure 3-5c. The caption is the same as that for Figure 3-5a. (Here hs = 0.1 m.)23 4 Analysis of the measurements In section 3 the effective flow resistivity of the snow field at the measurement site in Umeåhas been determined to be 20 kPa s m-2. This flow resistivity value has been used in determining the excess attenuation of sound propagation over the snow field. In sub-section 4.1, the measurement and the data analysis of snowmobile engine noise will be described. And, based on the analysis, the rpm dependence of the engine noise will be determined. Thereafter, in sub-section 4.2, the measurement of snowmobile pass- by noise at several constant speeds will be described and the total snowmobile noise will be analysed and compared with that of the engine noise. The noise emission data of pass- by at full throttle will be analysed in sub-section 4.3, which provide useful information for understanding the North-America noise indicator, L pAS max . Finally, in sub-section 4.4, non-engine noise will be studied. 4.1 The engine noise of the two snowmobiles By measuring snowmobile noise under a stationary condition the engine noise data was collected, which serves as the starting point in modelling snowmobile noise. 4.1.1 Measurement arrangement As described in sub-sub-section 2.3.2, four microphone positions were used (d/h): 7.5/1.2, 7.5/2 and 7.5/3.5 m (7.5 m is the distance between the microphone position and the snowmobile axis line) for the three microphones along the normal line passing through the centre of the snowmobile; the use of three microphone heights is of an advantage to determine the relative source strength ratio if there are two or three point sources contribute. The fourth microphone has a position similar to the first one (7.5/1.2 m) but one snowmobile length (3.3 m) shifted to the rear side from the normal line. This fourth position is for checking out if there is an important effect of horizontal directivity. Figure 4-1. The location of the exhaust outlet: left picture is for the Arctic Cat and right picture for the Yamaha. The engine noise of the two snowmobiles were measured with the right side facing to the microphones. The reason for this choice is (1) the total number of measurements has to be limited because of the small budget for the project; and (2) for the snowmobile Arctic Cat the exhaust outlet is located at the front-right side while for the Yamaha there are two exhausts with the outlets symmetrically located at the rear, see Figure 4-1.
24

4.1.2        The noise spectrum of snowmobile engine noise
The operating conditions are listed in Table 4.1. Part of the engine noise data are
presented in Figures 4-2 and 4-3.

The snowmobile Arctic Cat has an engine of two-stroke and two cylinders. The idling
rpm is 1800, which takes 1/30 s for each working cycle (of one cylinder) and it then
corresponds to 30 Hz. And, 60 Hz can be estimated when considering the two cylinders.

If we assume that, for the engine of the Arctic Cat, the fundamental is 60 Hz, then,
according to the data, the sixth and sixteenth harmonics are also important in the noise
emission, under stationary.

Table 4.1. The operating conditions for measuring the engine noise of the snowmobiles.
  Operating        Arctic Cat          Yamaha                       Note
  conditions
 constant rpm         1800              1400        Idling rpm
 constant rpm         3000              2000        Moderate rpm
 constant rpm         4000              2500        High rpm, which is under but close to
                                                    the engagement rpm
 Acceleration      Sweep from        Sweep from     Acceleration was gently made to avoid
                   rpm 1800 to       rpm 1400 to    the engagement
                   rpm 4000          rpm 2500

              80
                                                                  rpm   1800
              75                                                  rpm   3000
                                                                  rpm   4000
              70                                                  rpm   1800-up

              65

              60

              55

              50

              45

              40

              35
                                 2                       3                         4
                             10                        10                         10
                                       Arctic Cat stationary

Figure 4-2. The Leq values of the engine noise of the Arctic Cat, recorded at 7.5/1.2 m
position (on the normal line), where rpm 1800-up means that the rpm value is gently
raised up from rpm 1800 to rpm 4000 (repeated six times).
25
The snowmobile Yamaha has an engine of four-stroke and three cylinders. It has an idling
rpm 1400, which corresponds to 12 Hz if one cylinder is considered and about 35 Hz if
the three cylinders are considered.
If we take 35 Hz as the fundamental for the engine noise, we then see that the second
harmonics dominates at idling rpm while the fourth and twelfth harmonics become also
important at rpm 2500 where the fundamental becomes less predominant.
Approximately, in the total A-weighted level, this Yamaha engine of four-stroke and
three cylinders (88.4 kW) is about 3 dB quieter than the Arctic Cat engine of two-stroke
and two cylinders (113 kW).
80
rpm 1400
rpm 2000
70 rpm 2500
rpm 1400-up
60
50
40
30
20
2 3 4
10 10 10
Yamaha stationary
Figure 4-3. The Leq values of the engine noise of the Yamaha, recorded at 7.5/1.2 m
position (on the normal line), where rpm 1400-up means the rpm value is gently raised up
from rpm 1400 to rpm 2500 (repeated six times).
The acceleration can only be made gently because one should be careful to avoid the
engagement otherwise the snowmobile will move. Thus, by making a gentle acceleration,
it in fact becomes a sweep operating condition (repeated six times when recording). It is
found that, for the engine noise under this sweep operating condition, each frequency
component of the resulted engine noise is mainly determined by the one of the highest
level among the spectra of respective rpm values.
A common feature of the engine noise of the two snowmobiles is that, by increasing rpm
value, the spectrum levels at the fundamental and low number of harmonics will be
reduced while the spectrum levels at high frequencies will be raised; and, not only the
total sound power will raise but also the sound power at high frequencies will become
more and more important.
4.1.3 The rpm dependence of snowmobile engine noise
For engine noise it is extremely difficult, if not impossible, to properly handle the sound
power distribution among the fundamental and harmonics. While, it is possible to
describe the total sound power level of engine noise, at least in an empirical way.26
Based on the collected engine noise data, a rpm-dependence of 25 was proposed for the
two engine types. The examples of using this rpm-dependence are given in Figures 4-4
and 4-5. As can be seen, this rpm-dependence works well except around those harmonics
peak levels.
80
Leq(rpm 1800)
70
Leq(rpm 3000)+25*lg(1800/3000)
60
50
40
30
2 3 4
10 10 10
80
Leq(rpm 4000)
70 Leq(rpm 3000)+25*lg(4000/3000)
60
50
40
2 3 4
10 10 10
Figure 4-4. Examples of rpm-dependence of the engine noise at stationary, for the Arctic
Cat. A rpm-dependence of 25 is applied. As discussed in the text above, the spectrum
levels at the fundamental and low number of harmonics are difficult to model.
80
Leq(rpm 1400)
Leq(rpm 2000)+25*lg(1400/2000)
60
40
20
2 3 4
10 10 10
80
60
40
Leq(rpm 2500)
Leq(rpm 2000)+25*lg(2500/2000)
20
2 3 4
10 10 10
Figure 4-5. The caption is the same as that for Figure 4-4, except here is for the Yamaha.27
4.1.4 The source height of snowmobile engine noise
For the Arctic Cat, the exhaust pipe outlet is located at front-right side, 200 mm high.
And, for the Yamaha, there are two exhausts located each side at the rear, 500 mm high.
Moreover, for the two snowmobiles the height of engine centre is 400 mm.
As described in sub-sub-section 4.1.1, four microphone positions have been used when
measuring the snowmobile noise at stationary. Since the results shown in the following
figures are given in channel nr, it is necessary to describe the relationship between the
microphone positions and the channel numbers; this is given in Table 4.2.
Table 4.2. The microphone positions and the corresponding channel numbers.
Channel 1 Channel 2 Channel 3 Channel 4 Note
8.2 / 1.2 7.5 /1.2 7.5 / 2 7.5 / 3.5 d / h (m)
For checking out if there are more than one important point source, and for determining
the corresponding source heights, different possible source heights of 0.1:0.1:0.6 (m)
have been tested. Each time only one point source of a source height was considered. The
sound propagation attenuation from the point source to one of the four receiver positions
was calculated using the Nord2000 propagation model, the latest version compro18e
whilst has been revised for being able to handle sound propagation above snow (see
section 3). Thus, the sound power level can be determined according to
LW Leq 10 lg 4 r 2 Aexcess , (4-1)
where Aexcess is the excess attenuation, r the distance between the point source and the
receiver, Leq the equivalent SPL recorded at the receiver position.
For the Arctic Cat the results are shown in Figures 4-6 and 4-7, for a source height 0.2 m
or 0.4 m respectively. The results for other possible source heights (0.1 m, 0.3 m, 0.5 m)
are not presented because they do not provide constructive/extra information.
Based on the results shown in Figure 4-6, we can see that when using only one single
point source of 0.2 m high
it works well below 200 Hz;
compared with channel 2 result, channel 1 result suggests a light effect of horizontal
directivity;
channel 3 result is well close to channel 2 result, up to 2 kHz.
If also consider the results shown in Figure 4-7, it can be understood that (, based on a
general understanding of the excess attenuation of sound propagation,) with a higher
source position and a higher receiver position, the excess attenuation will contain more
ripples at high frequencies. As a few dB error in spectrum is not strange in handling
sound propagation above snow, such limited errors above 2 kHz are then considered
tolerable.
As the result of a single point source of 0.4 m high does not improve the case at high
frequencies, it is then concluded that a point source of a height between 0.2 m and 0.4 m
can equivalently describe the engine noise of the snowmobile Arctic Cat.28
The horizontal directivity will be neglected because (1) it does not show a strong effect;
and (2) to work out a directivity function requires an extensive investigation which is out
of the purpose of this project. Moreover, the sound power of the engine noise will be the
mean of the resulted sound powers determined based on respective recordings at the four
receiver positions.
Lw (linear)
105
cha 1
100 cha 2
cha 3
95 cha 4
mean
90
85
80
75
70
65
60
2 3 4
10 10 10
hs = 0.2 (m) Arctic Cat
Figure 4-6. The sound power levels of the engine noise of the snowmobile Arctic Cat at
the idling rpm, determined using respective recordings at the four receiver positions.
Assuming a single point source of 0.2 m high.
Lw (linear)
105
cha 1
100 cha 2
cha 3
cha 4
95
mean
90
85
80
75
70
65
2 3 4
10 10 10
hs = 0.4 (m) Arctic Cat
Figure 4-7. The caption is the same as that for Figure 4-6, while a different source height
of 0.4 m was used.29
Lw (linear)
110
cha 1
cha 2
100 cha 3
cha 4
mean
90
80
70
60
50
2 3 4
10 10 10
hs = 0.5 (m) Yamaha
Figure 4-8. The sound power levels of the engine noise of the snowmobile Yamaha at the
idling rpm, determined using respective recordings at the four receiver positions.
Assuming a single point source of 0.5 m high.
Lw (linear)
110
cha 1
cha 2
100 cha 3
cha 4
mean
90
80
70
60
50
2 3 4
10 10 10
hs = 0.4 (m) Yamaha
Figure 4-9. The caption is the same as that for Figure 4-8, while a different source height
of 0.4 m.
For the engine noise of the snowmobile Yamaha, discussions are similar to those for the
snowmobile Arctic Cat, while the source height is between 0.4 m and 0.5 m. Relevant
results are shown in Figures 4-8 and 4-9. (It seems there is no important horizontal
directivity.)30
4.2 Snowmobile pass-by noise: under a constant
speed
The purpose of the pass-by measurements is to collect the noise emission data of total
snowmobile noise. Thus, as expected, by comparing the spectrum characteristic of the
total pass-by snowmobile noise and that of the engine noise, it will be possible to justify
if non-engine noise should be considered or not.
4.2.1 Measurement arrangement
Four microphone positions were positioned along a line normal to the travel path, the
same as those used in the sound propagation of a point sound source (sub-section 3.3).
These four positions are (d/h, in meter): 7.5/1.2, 15/1.2, 25/1.2 and 25/3.5 (see Figure 3-
3). By this setup, it is sure how well the sound propagation has been handled.
The reason to choose these four receiver positions has been described in sub-sub-section
2.3.3. The measurement conditions were described in sub-section 3.3.
During a pass-by, a recording would start from 40 m before and would end 40 m past the
normal line. Relative to the nearest measurement distance 7.5 m where recordings will be
used to determine the sound power level of the noise emission, this travel section is about
5 times the measurement distance at each side then guarantees an accurate recording of
the pass-by SEL value. One pass-by example was shown in Figures 4-10.
Figure 4-10. The video clips of a recorded pass-by of the snowmobile Yamaha under a
pass-by at full throttle.31
For each snowmobile, at each direction of drive, and at each of three constant speeds of
25, 50 and 75 km/h, the pass-by noise has been recorded only once. (Note: The number of
pass-bys is controlled due to the small budget of this project, while measurement quality
is guaranteed by a proper design of the systematic measurements. Therefore for each
pass-by measurement, 1 or 2 dB variations in recording are considered tolerable.)
4.2.2 The noise spectrum of snowmobile pass-by noise
The recorded pass-by sound exposure level, SEL, can easily be transformed into the
corresponding equivalent sound pressure level, Leq ,
Leq SEL 10 lg T SEL 10 lg 80 / V , (4-2)
where the length of the travel-path is 80 m and the pass-by speed V is in m/s.
In Figures 4-11 (L2R) and 4-12 (R2L) the 25 km/h pass-by Leq was compared with those
of the engine noise, for the snowmobile Arctic Cat. (The recordings at the microphone
position 7.5/1.2 m were used.) “L2R” means that the snowmobile passes from the left to
the right, as exampled in Figure 4-10; and, “R2L” means from the right to the left.
80
rpm 1800
75 rpm 3000
rpm 4000
70 25 km/h
65
60
55
50
45
40
35
2 3 4
10 10 10
Arctic Cat stationary compared with cruise (L2R)
Figure 4-11. The comparison of the pass-by Leq under 25 km/h and those of the engine
noise at different rpm-values, for the snowmobile Arctic Cat. “L2R” means that the
snowmobile passes from the left to the right, as shown in Figure 4-10.32
80
rpm 1800
75 rpm 3000
rpm 4000
70 25 km/h
65
60
55
50
45
40
35
2 3 4
10 10 10
Arctic Cat stationary compared with cruise (R2L)
Figure 4-12. The caption is the same as that for Figure 4-11, while the pass-by data in
this plot is for the R2L pass-by.
By these results, one may conclude that, for the snowmobile Arctic Cat, its left side (R2L,
67.6 dBA) is a little bit more noisy than its right side (L2R, 65.7 dBA). However, it is not
proper to draw this conclusion considering only one pass-by has been recorded for each
direction and 1 or 2 dB variation in measurement is common. In fact, by checking the
spectrum, the first maximum for the pass-by R2L is located at a slightly higher frequency
than the one for the L2R pass-by, which may suggest a higher drive speed.
The more important issue is to compare the spectrum characteristic, at high frequencies
where the non-engine noise may contribute. However at high frequencies, obviously, the
25 km/h pass-by data and the engine noise data are, roughly, of the same characteristic.
Let us further check the pass-by data of higher speeds. (For reducing redundancy, the
noise emission data of the pass-by at full throttle has been put together, while it will be
discussed in next sub-section.)
All the pass-by data (the recordings at the microphone position 7.5/1.2 m) are presented
in Figures 4-13 (L2R) and 4-14 (R2L). One can see they are of the same characteristic, at
high frequencies in spectrum. This then suggests that the non-engine noise sources are not
important both in the total level and in frequency components. Thus, we conclude that it
is enough to consider the engine noise only, for the snowmobile Arctic Cat on a soft trail.
For the noise of this two stroke engine, it seems that the spectrum peak levels will slightly
“shift” to upper frequencies when the rpm value increases. However, as will be shown
next, this phenomenon has not been found for the four stroke engine. (And, opposite
situations are shown in Figures 4-2 and 4-3.)
The extra information released by these data is that for speed 25 km/h the corresponding
rpm is close to the engagement rpm.33
80
75
70
65
60
55
50
25 km/h
50 km/h
45
75 km/h
acceleration
40
2 3 4
10 10 10
Arctic Cat pass-by (L2R)
Figure 4-13. The pass-by Leq under a constant speed of 25, 50 or 75 km/h, or at full
throttle, for the snowmobile Arctic Cat.The pass-by direction is L2R.
85
80
75
70
65
60
55
50 25 km/h
50 km/h
45 75 km/h
acceleration
40
2 3 4
10 10 10
Arctic Cat pass-by (R2L)
Figure 4-14. The pass-by Leq under a constant speed of 25, 50 or 75 km/h, or at full
throttle, for the snowmobile Arctic Cat.The pass-by direction is R2L.34
80
rpm 1400
rpm 2000
70 rpm 2500
25 km/h
60
50
40
30
20
2 3 4
10 10 10
Yamaha stationary compared with cruise (L2R)
Figure 4-15. The comparison of the pass-by Leq under 25 km/h and those of the engine
noise at different rpm-values, for the snowmobile Yamaha.
80
rpm 1400
rpm 2000
70 rpm 2500
25 km/h
60
50
40
30
20
2 3 4
10 10 10
Yamaha stationary compared with cruise (R2L)
Figure 4-16. The caption is the same as that for Figure 4-15, while the pass-by data in
this plot is for the R2L pass-by.
For the Yamaha four-stroke engine (88.4 kW) its spectrum characteristic differs from that
of the Arctic Cat two-stroke engine (113 kW). As shown in Figure 4-15, the sound level35
of the Yamaha engine noise is, compared with that of the Arctic Cat engine noise, about 5
dB less below 100 Hz, comparable at medium frequencies and 5~10 dB less above 1 kHz.
For the Yamaha, the spectrum characteristic of 25 km/h pass-by noise is slightly different
from that of the engine noise, above 3 kHz (comparing the curve slopes). This may
suggest some contribution of non-engine noise at the high frequencies. However, because
of the low level, the non-engine noise is still not important in this situation.
85
80
75
70
65
60
55
50
45 25 km/h
50 km/h
40 75 km/h
acceleration
35
2 3 4
10 10 10
Yamaha pass-by (L2R)
Figure 4-17. The pass-by Leq under a constant speed of 25, 50 or 75 km/h, or at full
throttle, for the snowmobile Yamaha. The pass-by direction is L2R.
80
75
70
65
60
55
50
45 25 km/h
50 km/h
40 75 km/h
acceleration
35
2 3 4
10 10 10
Yamaha pass-by (R2L)
Figure 4-18. The pass-by Leq under a constant speed of 25, 50 or 75 km/h, or at full
throttle, for the snowmobile Yamaha. The pass-by direction is R2L.36
The Yamaha pass-by data were presented in Figures 4-17 (L2R) and 4-18 (R2L). As can
be see, the spectrum level of the pass-by noise develops with the rpm value in the same
rate, above 100 Hz. Therefore, if the non-engine noise sources are relatively not
important at 25 km/h, then they are still relatively not important at a higher speed.
Thus, it can be concluded that, for the tested two snowmobiles, only engine noise is
important if they drive on a soft trail.
4.2.3 The speed dependence of snowmobile pass-by noise
In sub-sub-section 4.1.3 a rpm-dependence of 25 has been proposed for the engine noise.
As the dominance of engine noise during the pass-bys has been proved, therefore, a speed
dependence of 25 was naturally also proposed for snowmobiles pass-by noise. The
example calculations were given in Figures 4-19 ~ 4-22. As can be seen, this speed
dependence works reasonably well. (No intension to handle those peak levels at
harmonics.)
80
Leq(25 km/h)
70 Leq(50 km/h)+25*lg(25/50)
60
50
40
2 3 4
10 10 10
75
70
65
60
Leq(75 km/h)
55
Leq(50 km/h)+25*lg(75/50)
50
2 3 4
10 10 10
Arctic cat (L2R)
Figure 4-19. Measured and calculated Leq for the pass-bys, for the Arctic Cat. A speed-
dependence of 25 is applied. No intension to handle those peak levels at harmonics.37
70
60
50
Leq(25 km/h)
Leq(50 km/h)+25*lg(25/50)
40
2 3 4
10 10 10
75
70
65
60
Leq(75 km/h)
55
Leq(50 km/h)+25*lg(75/50)
50
2 3 4
10 10 10
Arctic cat (R2L)
Figure 4-20. The caption is the same as that for Figure 4-19, while here are for the pass-
bys R2L.
70
60
50
40 Leq(25 km/h)
Leq(50 km/h)+25*lg(25/50)
30
2 3 4
10 10 10
80
70
60
50 Leq(75 km/h)
Leq(50 km/h)+25*lg(75/50)
40
2 3 4
10 10 10
Yamaha (L2R)
Figure 4-21. Measured and calculated Leq for the pass-bys, for the Yamaha. A speed-
dependence of 25 is applied. No intension to handle those peak levels at harmonics.38
70
60
50
40 Leq(25 km/h)
Leq(50 km/h)+25*lg(25/50)
30
2 3 4
10 10 10
80
70
60
50 Leq(75 km/h)
Leq(50 km/h)+25*lg(75/50)
40
2 3 4
10 10 10
Yamaha (R2L)
Figure 4-22. The caption is the same as that for Figure 4-21, while here are for the pass-
bys R2L.
4.3 Snowmobile pass-by noise: at full throttle
Aiming at understanding the North-America noise indicator, L pAS max , the noise emission
data of snowmobile pass-by at full throttle was also collected and analyzed, as described
in this sub-section.
4.3.1 The North-America method SAE J192
The North-America method J192 [5] is summarized in the following:
The measurement area starts from 75 feet (22.86 m) before the centre of the travel
lane (where the normal passes through the microphone stand) and ends 75 feet past
the centre;
The snowmobile approaches the starting point with an initial speed of 15 mph (24
km/h) and then maintain full throttle as it travels through the measurement area;
The microphone position is 50 feet (15.2 m) from the snowmobile path and 4 feet
(1.2 m) above the ground;
The noise indicator is the maximum instantaneous A-weighted SPL using time-
weighting S, L pAS max , during the pass by;
It is required a minimum of 2 inch (50.8 mm) packed snow under the travel path and
a maximum of 3 inch (76.2 mm) loose snow on top of the packed snow.
The result for each side is the average of three measurements differing less than 2 dB
rounded to the nearest integer. The final result is the highest between the ones of the
two sides.39
4.3.2 Measurement arrangement
The aim of this measurement is to find the relationship between the North-America noise
indicator, L pAS max , and a defined noise sound power level. As the measurement made in
this project is for modelling snowmobile noise, not for certificating a snowmobile, it is
not necessary to fulfil all the requirements set by SAE J192. For example, for each side of
a snowmobile only one pass by has been recorded in order to reduce the measurement
load – this is necessary because of the small budget.
The four microphone positions are the same as those described in sub-sub-section 4.2.1.
For the North-America noise indicator, L pAS max , the value of it is determined based on
the recordings of the second microphone which is located at 15/1.2 m.
The measurements of pass by at full throttle start at a speed of 25 km/h, 22.8 m before the
centre and end 22.8 m past the centre.
4.3.3 The noise spectrum
The results were presented in Figures 4-13 and 4-14 for the Arctic Cat and Figures 4-17
and 4-18 for the Yamaha.
As can be seen, for a pass by at full throttle, the spectrum characteristic of pass-by
equivalent SPL, Leq , is similar to that of the engine noise at a high rpm value, at medium
and high frequencies. This is probably due to that, by a powerful acceleration, the engine
rpm will quickly reach a high value then the engine noise of high-rpm characteristic
dominates during the pass-by.
80
70
60
50 Leq(acc, L2R)
Leq(75 km/h)+9
40
2 3 4
10 10 10
80
70
60
50 Leq(acc, R2L)
Leq(75 km/h)+9
40
2 3 4
10 10 10
Arctic Cat 15/1.2 m
Figure 4-23. The Leq of a pass-by at full throttle (with the average speed about 86 km/h)
compared with that under a cruise pass-by at 75 km/h, for the Arctic Cat.40
80
70
60
50 Leq(acc, L2R)
Leq(75 km/h)+6
40
2 3 4
10 10 10
80
70
60
50 Leq(acc, R2L)
Leq(75 km/h)+6
40
2 3 4
10 10 10
Yamaha 15/1.2 m
Figure 4-24. The Leq of a pass-by at full throttle (with the average speed about 86 km/h)
compared with that under a cruise pass-by at 75 km/h, for the Yamaha.
For the Arctic Cat, the measured pass-by data were shown in Figures 4-13 and 4-14.
Under the acceleration the pass-by time is slightly less than 4 seconds; accordingly,
estimated average pass-by speed is 86 km/h. However, the noise level is about 9 dB
raised up compared with that of the cruise pass-by at 75 km/h. The comparison of the two
noise emission levels was shown in Figure 4-23. (Note: considering the use of the A-
weighting will reduce the importance of low-frequency components, the overestimation at
low frequencies by this simple treatment is thought tolerable.)
For the Yamaha, the measured pass-by data were shown in Figures 4-17 and 4-18. The
pass-by time for the pass-by at full throttle is slightly less than 4 seconds; or, the average
pas-by speed is about 86 km/h. Moreover, the noise level is about 6 dB raised up
compared with that of the cruise pass-by at 75 km/h. The comparison of the two noise
emission levels was shown in Figure 4-24.
Table 4.3. The A-weighted noise emission data at the receiver position 15/1.2 m.
L pAS max acc LeqA acc LeqA 75 km / h
(dBA) (dBA) (dBA)
Arctic Cat L2R 83.8 80.4 71.3
R2L 85.0 81.7 72.4
Yamaha L2R 78.9 76.9 69.8
R2L 79.2 76.6 70.5
Note: The noise limit in North-America for snowmobiles is 78 dBA ( L pAS max acc ).
In Table 4.3 the values of the North-America noise indicator, L pAS max acc , and the
corresponding LeqA acc were compared with LeqA 75 km / h (at the receiver position
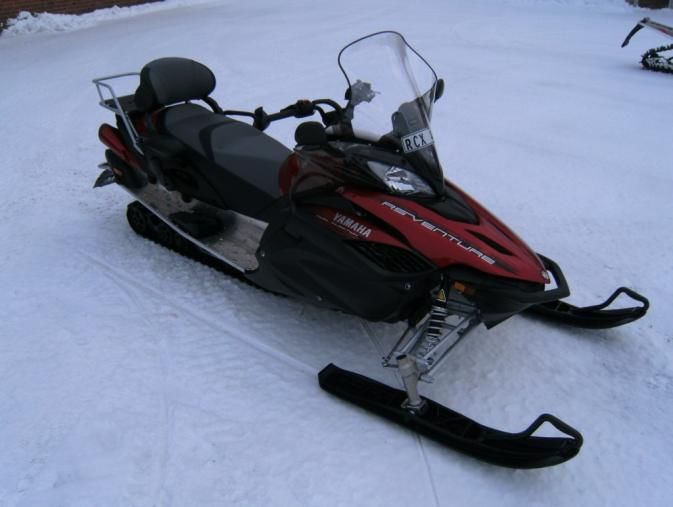
15/1.2 m). For the snowmobile Arctic Cat, L pAS max acc is about 12.5 dBA higher than41 LeqA 75 km / h . And, for the Yamaha, L pAS max acc is about 9 dBA higher than LeqA 75 km / h . The North-America noise limit is based on: (1) the result for each side is the average of three measurements differing less than 2 dB rounded to the nearest integer; (2) the final result is the highest between the ones of the two sides. This requirement is important for a certification test. In this project, the measurement load has to be reduced because of the small budget. It seems that, compared with having three qualified recordings for each situation, the data quality could be lowered if having only one recording for each situation. However, this is in fact not always true. As we have systematically measured the noise emission data of the two snowmobiles, when put all these data together, the measurement uncertainty has been reduced and the data quality has been raised up to the same good as that if having three qualified recordings for each situation (e.g. one will have the same confidence on the results). The only special factor is that, when working on the measurement data (e.g. when determining the rpm-dependence), possible 1 or 2 dB variation in the pass-by noise level should be taken into account. 4.4 Referring to some earlier measurements For snowmobiles, non-engine noise includes transmission noise, suspension noise and track noise. For modern snowmobiles, many advanced techniques have been applied for reducing noise from these driveline components. It is then interesting to find out how important the non-engine noise will be for modern snowmobiles. With this purpose, in 2009 and in Umeå, SP Acoustics arranged a special pass-by measurement by using one snowmobile to tow one other snowmobile [8]. The towed snowmobile, Lynx Adventure Grand Tourer 600 SDI (hereafter, the Lynx), was connected to the towing snowmobile, Arctic Cat TZI Turbo LXR (hereafter, the Arctic Cat 2009) by a 40 m long rope, as shown in Figure 4-25. During the pass-by, the gear of the Lynx was put neutral and the engine was shut off. The speed is 24 km/h. Figure 4-25. The towed snowmobile Lynx was connected to the towing snowmobile by a 40 m long rope [8].
You can also read


