Water Source Alternative Options Assessment for the Metropolitan Supply - EPA NZ
←
→
Page content transcription
If your browser does not render page correctly, please read the page content below

In association with

Water Source Alternative Options Assessment
for the Metropolitan Supply
Demand forecast - 2020 Update
Prepared for Watercare Services Ltd

Prepared by Beca Limited & Tonkin + Taylor Limited

8 December 2020

                 Creative people together transforming our world
| Demand forecast for the Metropolitan Supply |

     Revision History
      Revision                Prepared By                                  Description                                                        Date
      Nº
      1                       Charlotte Reed / Monique                     DRAFT for client review                                            18th Nov 2020
                              Van Wyk
      2                       Charlotte Reed / Monique                     FINAL DRAFT for review                                             1st Dec 2020
                              Van Wyk
      3                       Charlotte Reed / Monique                     Final                                                              8th Dec 2020
                              Van Wyk

     Document Acceptance
      Action                         Name                                     Signed                                                         Date
      Prepared by                    Charlotte Reed /                                                                                        8th Dec 2020
                                     Monique Van Wyk

      Reviewed by                    Jon Reed                                                                                                8th Dec 2020

      Approved by                    Clive Rundle                                                                                            8th Dec 2020

      on behalf of                   Beca Limited

© Beca 2020 (unless Beca has expressly agreed otherwise with the Client in writing).

This report has been prepared by Beca on the specific instructions of our Client. It is solely for our Client’s use for the purpose for which it is intended in accordance
with the agreed scope of work. Any use or reliance by any person contrary to the above, to which Beca has not given its prior written consent, is at that person's own
risk.

                                                                                                Waikato River Water Take and Discharge Proposal – Board of Inquiry | i
Contents

1   Introduction ................................................................................................ 1
    1.1      Background............................................................................................................................ 1
    1.2      Scope of this report ............................................................................................................... 2
    1.3      Structure of this report ........................................................................................................... 3

2   Population update ..................................................................................... 4
    2.1      Background............................................................................................................................ 4
    2.2      Population data ...................................................................................................................... 4
    2.3      Connected population estimates ........................................................................................... 6
    2.4      Papakura population .............................................................................................................. 8

3   Data review ................................................................................................. 9
    3.1      Production and consumption ................................................................................................. 9
    3.2      Domestic consumption ........................................................................................................ 13
    3.3      Commercial consumption .................................................................................................... 15
    3.4      Papakura bulk supply .......................................................................................................... 16
    3.5      Waikato District Council ....................................................................................................... 19
    3.6      Water efficiency ................................................................................................................... 20
    3.7      Non-revenue water .............................................................................................................. 20
    3.8      Climate ................................................................................................................................. 22
    3.9      Level of Service and rainfall analysis .................................................................................. 26
    3.10 Summer 2019 and summer 2020 ........................................................................................ 28
    3.11 Peak analysis....................................................................................................................... 30
    3.12 Production planning ............................................................................................................. 32

4   Approach to the demand forecast ......................................................... 33
    4.1      The forecasts developed ..................................................................................................... 33
    4.2      Base year analysis .............................................................................................................. 33
    4.3      Approach to the demand forecast ....................................................................................... 34

5   The demand forecast model and results ............................................... 37
    5.1      Modelling ............................................................................................................................. 37
    5.2      Annual average demand forecast ....................................................................................... 37
    5.3      Peak and dry year demand forecasts .................................................................................. 37
    5.4      Conclusion ........................................................................................................................... 38

6   Auckland Waters Strategy ...................................................................... 39

Appendices

Appendix A – Connected population calculation

                                                                                   Waikato River Water Take and Discharge Proposal – Board of Inquiry | ii
Figures
Figure 2-1 Comparison of population data sets ...................................................................................... 5

Figure 2-2 ART models i11v3 and i11v6 population projections ............................................................. 5

Figure 2-3: Schematic of population connected to Watercare’s metropolitan supply ............................. 6
Figure 2-4 Papakura population projections............................................................................................ 8

Figure 3-1: Average daily water produced, 2006 to 2020 (metropolitan areas only). Voluntary
restrictions were requested in March 2017. Source: Daily production data (A. Lester) ........................ 10
Figure 3-2: Average daily water produced and supplied, 2006 to 2020 (metropolitan areas only).
Source: Daily production data (A. Lester) and BSP volumes (L.Gan) ................................................. 10

Figure 3-3 Average daily winter production (May to August) against annual production, 2000 to 2019
(metropolitan areas only). Source: Daily demand proxy data (A. Lester) ............................................. 11

Figure 3-4: Disaggregation of Watercare’s demand, 2013 to 2019 Source: Annual consumption data
and water loss calculations (L. Gan) ..................................................................................................... 12

Figure 3-5: Metropolitan domestic consumption, 2010 to 2019. Source: Annual consumption data (A.
Powell) ................................................................................................................................................... 13

Figure 3-6: Domestic consumption and PCC, 2010 to 2019 ................................................................. 14

Figure 3-7: Metropolitan commercial consumption, 2011 to 2019. Source: Annual consumption data
(A. Powell) ............................................................................................................................................. 15

Figure 3-8: Papakura population growth against demand, 2010 to 2020 Source: Annual supply data (L.
Gan) and ARTi11v6 population forecast ............................................................................................... 17

Figure 3-9 Papakura Bulk Supply Data 2012 to 2020 to show anomaly at the start of the 2017 financial
year ........................................................................................................................................................ 17

Figure 3-10: Papakura PCC, 2010 to 2020 Source: Annual consumption data (L. Gan) and ARTi11v6
population forecast ................................................................................................................................ 18

Figure 3-11: Water supplied to Waikato District Council Source: L Gan .............................................. 19

Figure 3-12 Twelve month rolling non-revenue water and real loss volumes, January 2016 to January
2020 ....................................................................................................................................................... 21

Figure 3-13: Annual average maximum daily temperature and annual average rainfall recorded at
Auckland Airport from 2000 to 2020, with respect to the long-term averages. Source: NIWA ............. 22

Figure 3-14: Average annual total rainfall against daily water produced (demand proxy), 2000 to 2020
Sources: NIWA, A. Lester...................................................................................................................... 23

Figure 3-15: Annual average maximum temperature against daily water produced (demand proxy),
2000 to 2020. Sources: NIWA, A. Lester .............................................................................................. 23

Figure 3-16: Summer (January to March) average maximum daily temperature against summer
average rainfall recorded at Auckland Airport from 2000 to 2020, with respect to the long-term
average. Source: NIWA ......................................................................................................................... 24

Figure 3-17: Summer (January to March) average rainfall against water produced (demand proxy),
2000 to 2020. Sources: NIWA, A. Lester. ............................................................................................. 25

                                                                                        Waikato River Water Take and Discharge Proposal – Board of Inquiry | iii
Figure 3-18: Summer (January to March) average maximum daily temperature against water produced
(demand proxy), 2000 to 2020. Sources: NIWA, A. Lester ................................................................... 25

Figure 3-19: Frequency analysis of January to March rainfall data, Auckland airport gauge, Source:
NIWA ..................................................................................................................................................... 26

Figure 3-20: Frequency analysis of January to February rainfall data, Auckland airport gauge. Source:
NIWA ..................................................................................................................................................... 27

Figure 3-21: 7 day rolling average of demand proxy over the last 5 financial years ............................. 29

Figure 3-22: Historic peak demand proxy and summer rainfall Source: NIWA and A Lester ............... 31

Figure 3-23: Difference between production and demand proxy (positive if production is higher than
demand proxy). Source: A Lester .......................................................................................................... 33

Figure 4-1: Structure of the component based demand forecast model ............................................... 34

Figure 5-1: Baseline annual average demand forecast 2018 to 2055 .................................................. 37
Figure 5-2: Total forecast average dry year and peak day production ................................................. 38

Figure 6-1: Concept Diagram: the scope of opportunity for long term water efficiency ........................ 39

Figure B-1: North Waikato communities within the ART i11 (v3) population forecast. The maroon line
indicates the boundary between the Auckland and Waikato regions. The pale blue line indicates the
outline of Unit 556 .................................................................................................................................. 42

Figure B-2: Flow chart showing metropolitan connected population estimate process . ..................... 44

Figure B-3: Allocation of growth near the WSB and in semi-rural areas (Huapai / Riverhead /
Whenuapai). .......................................................................................................................................... 46

Tables
Table 2-1 Derivation of connected population, 2013 to 2018 (excluding Papakura and Waikato District
populations) (reported to 3 significant figures) ........................................................................................ 7

Table 3-1: Domestic PCC 2013 to 2019 ................................................................................................ 13

Table 3-2: Annual supply volumes to Waikato District Council 2017 to 2020 Source: L Gan .............. 19

Table 3-3: Driest five summers (Auckland airport 1963 to 2020) Source: NIWA .................................. 28
Table 3-4: Driest five January-February rainfall totals (Auckland Airport 1963 to 2020) Source: NIWA
............................................................................................................................................................... 28

Table 3-5: Peak day, 3 day and peak week demand ............................................................................ 30
Table 3-6: Dry year factor estimates ..................................................................................................... 32

Table 5-1: 2020 and 2055 forecast demands........................................................................................ 38

                                                                                         Waikato River Water Take and Discharge Proposal – Board of Inquiry | iv
Abbreviations and Definitions

Abbreviations         Definitions
ARFM                  Superceded Auckland Council population model
ARI                   Annual recurrence interval
ART i11v3, v6         Auckland Council population model
AUPOiP                Auckland Unitary Plan Operational in Part
BSP                   Bulk supply point
Commercial demand     Commercial, industrial, institutional etc. demand
Demand proxy          Production adjusted for reservoir storage, to estimate demand
FY                    Financial Year, 1 July to 30 June
Gross PCC             Total production divided by total connected population
IWA                   International Water Association
JF                    January, February
JFM                   January, February, March
LoS                   Level of Service
m3/day                cubic metres of water per day
MBIE                  Ministry of Business, Innovation and Enterprise
ML                    Maximum Likelihood, a statistical method
ML/d                  Megalitres per day. One megalitre is one million litres
NRW                   Non-revenue water
PCC                   Per capita consumption
PWM                   Probability Weighted Moments statistical method
RMA                   Resource Management Act (1991)
WDC                   Waikato District Council
WRC                   Waikato Regional Council
WSB                   Water supply boundary
WSZ                   Water supply zone
WTP                   Water treatment plant
WWTW                  Wastewater treatment works

                                          Waikato River Water Take and Discharge Proposal – Board of Inquiry | v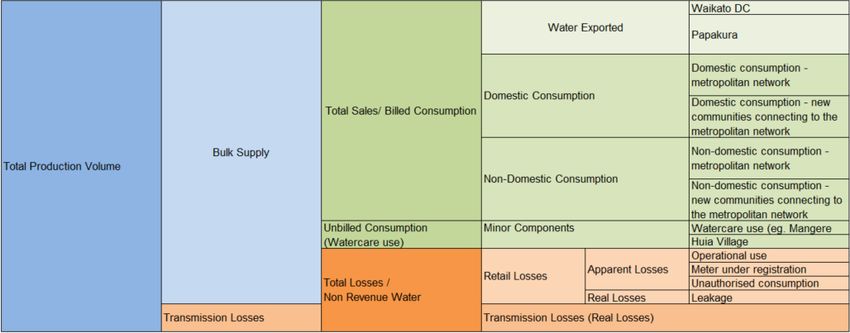
| Executive Summary |

Executive Summary
This report presents Watercare’s water demand forecast for the metropolitan Auckland supply. The
purpose of the forecast is in support of Watercare’s resource consent application to abstract water
from the Waikato River.
The first part of this report focuses on analysis of the different components of demand, to understand
the demand drivers and how they may need to be forecast into the future. The main components of
demand are:
● Domestic consumption;
● Commercial consumption (also including industrial and institutional consumption);
● Bulk supplies;
● Non-revenue water; and
● Other minor components.

A significant driver of water demand is climate. During the 2019 and 2020 summers Watercare
experienced the highest daily demands on record, within the highest prolonged period of high
demand. This evidence assists with confirming how peak demands could grow in the future.
Two baseline forecasts have been developed which align with Watercare’s relevant Levels of Service.
These are:

● Annual average demand in a dry year; and
● Peak day demand.

Over the coming 35 years Watercare can expect that its metropolitan supply will be required to provide
water to more than 700,000 new residents of the greater Auckland region and around 8,000 more
residents in the Waikato District. This is an increase equivalent to nearly half (49%) of the 1.48 million
people across Auckland and the Waikato that are currently supplied from the metropolitan system.

The forecast suggests that annual average demand in a dry year will increase from 446 ML/d in 2020
to approximately 654 ML/d by 2055. Peak demand is expected to increase from the 568 ML/d
recorded in 2020 to around 833 ML/d by 2055. These outputs can be used in Watercare’s supply /
demand balance to understand the timing and nature of new schemes required to either reduce
demand or increase supply.

There are a number of significant assumptions that underlie these forecasts. In line with international
best practice, Watercare adopts an allowance for headroom within the supply / demand balance. This
enables a level of risk to be adopted to that accounts for the uncertainties inherent in the demand
forecast. The demand forecast including headroom is presented in the accompanying report, Outage,
Headroom and the Supply / Demand Balance (Beca / Tonkin + Taylor, 2020).

                                                          Waikato River Water Take and Discharge Proposal – Board of Inquiry | vi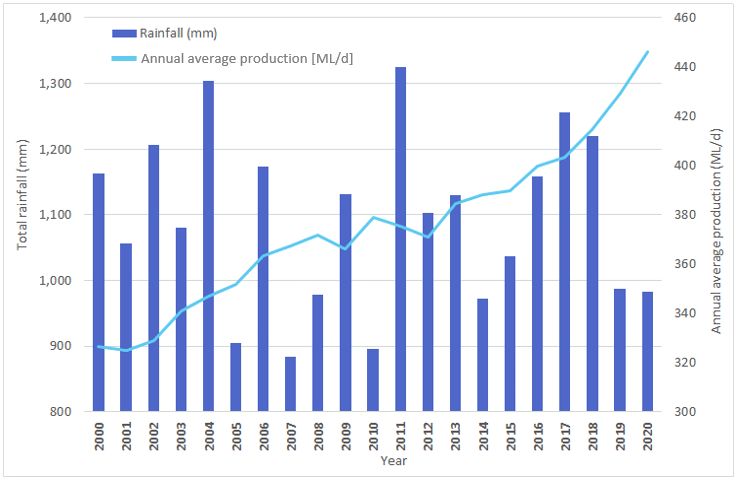
| Introduction |

1 Introduction

1.1 Background
Watercare Services Limited (“Watercare”) is a lifeline utility providing water and wastewater services to
a population of 1.7 million people in Auckland. Its services are vital for life, keep people safe and help
communities to flourish. More specifically, Watercare is the council-controlled organisation of Auckland
Council responsible for municipal water supply within Auckland, and the provider of bulk water supply
services to Pokeno and Tuakau in the Waikato District 1.
Watercare supplies approximately 440,000 cubic metres of water per day (“m3/day”) on average across
the year, derived from a range of sources and treated to the Ministry of Health Drinking Water Standards
for New Zealand 2005 (revised 2018).

Watercare’s three main water supply sources are: 2
● Water storage lakes in the Hūnua and Waitākere ranges;
● A groundwater aquifer in Onehunga; and
● The Waikato River.

The exact proportion supplied from each source varies daily, depending on a range of factors including
the levels in the storage lakes, forecast rainfall, treatment plant capacity, and maintenance
requirements.

In December 2013, Watercare applied to the Waikato Regional Council (“WRC”) for resource consents
to authorise abstracting an additional 200,000 m3/day (net) of water from the Waikato River, a new water
intake structure and discharges from a new water treatment plant. Since that time, Watercare’s water
take application (and the associated applications) have been on hold while the WRC processes and
determines other applications to take water from the Waikato River Catchment that were lodged before
Watercare’s application.

During the period from late 2019 through to mid-2020, the Auckland region experienced one of the most
extreme drought events in modern times with rainfall for the period between January and May 2020
being approximately 30% of what would normally be expected for that period. At Watercare’s
recommendation, in May 2020 Auckland Council imposed water use restrictions in Auckland for the first
time since the early 1990s. Watercare also took additional steps to improve security of supply during
the drought by exercising emergency powers under section 330 of the Resource Management Act 1991
(RMA),3 and by re-establishing supply from previously decommissioned sources. 4

While the above steps have been taken to make sure Auckland’s short term water supply
requirements are met, the focus has now turned to the future. Watercare are now considering how
demand can be met over the long term by securing sustainably sourced water to achieve:

1
    Under a bulk supply agreement with Waikato District.
2
    Watercare also operates individual water supplies from various sources including groundwater and
    surface water for several other communities such as Muriwai, Algies Bay, Snells Beach, Bombay,
    Waiuku, Warkworth, Helensville and Wellsford.
3
    Reduced environmental flows from the Waitakere, Wairoa and Cosseys Storage Lakes, and a short
    term take from the Waikato River.
4
    Groundwater bores at Pukekohe and the Hays Creek Storage Lake in Papakura.

                                                           Waikato River Water Take and Discharge Proposal – Board of Inquiry | 1
| Introduction |

●    Certainty of supply in up to a 1:100-year drought with 15% residual dam storage; and
●    Certainty of supply to meet the peak demand.

On 30 June 2020, after considering advice provided by the Environmental Protection Authority, the
Minister for Environment issued a direction under section 142(2) of the RMA to call in Watercare’s 2013
application and refer the matter to a Board of Inquiry to determine the application. The Minister’s
direction recognised Watercare’s application as a proposal of national significance.

Given the passage of time since the 2013 application was lodged, Watercare has updated the
application to address a range of matters including updates to population and demand assessments,
changes to the policy framework within which the application is to be considered, consultation that has
taken place, reassessment of potential water supply sources and intake options, and updated
assessments of environmental effects including the effect that granting Watercare’s application would
have on the allocation available to other users. The updated application will be heard by the Board of
Inquiry.
The most significant revision to the 2013 application, resulting directly from Watercare’s ongoing
engagement with Waikato-Tainui is a reduction in the volume of the proposed water take from 200,000
m3/day (net) to 150,000 m3/day (net). This reduction reflects Waikato-Tainui’s special relationship with
the Waikato River as outlined in the Waikato-Tainui Raupatu Claims (Waikato River) Settlement Act
2010. It recognises Waikato-Tainui’s relationship with the Waikato River and its respect for the River
lies at the heart of Waikato-Tainui’s spiritual and physical wellbeing, tribal identity and culture.

Watercare currently holds three resource consents authorising the abstraction of water from the Waikato
River adjacent to the Waikato Water Treatment Plant (“Waikato WTP”) near Tuakau as follows:

a)       Resource consent 960089.01.04 authorising a net take rate of up to 150,000 m3/day at any time
         of the year.

b)       Resource consent 141825.01.01 (referred to as the “Seasonal Water Take” consent)
         authorising a net take rate of up to:

         i)      100,000 m3/day during the period 1 May to 30 September (inclusive); and

         ii)     100,000 m3/day during the period 1 October to 30 April (inclusive) when the 7-day rolling
                 average flow of the Waikato River at Rangiriri exceeds 330.03 m3/second.

c)       Resource consent 142090.01.01 (referred to as the “Hamilton City Council Water Allocation”
         consent), authorising a net take rate of up to 25,000 m 3/day (or such lesser volume as
         determined by Hamilton City Council as being available for any given day) during the period 1
         October to 30 April (inclusive). This is a short-term consent till 1 May 2023.

In the event that the consent sought through the Board of Inquiry process is granted for the volume
sought, Watercare proposes that its Seasonal Water Take consent and Hamilton City Council Water
Allocation consent would be surrendered. Watercare’s combined take from the Waikato River under its
existing resource consent 960089.01.04, and the new water take consent sought through the Board of
Inquiry would not exceed a year round net take volume of 300,000 m3/day.

This report provides an assessment of the forecast of water demand prepared to support the application
to be considered by the Board of Inquiry.

1.2 Scope of this report
This report sets out Watercare’s water demand forecast for the metropolitan Auckland supply, based
on information available on 1 October 2020. Beca Ltd (Beca) and Tonkin & Taylor Ltd (T+T) were
commissioned by Watercare in August 2020 to complete this update to the forecast. This built on

                                                           Waikato River Water Take and Discharge Proposal – Board of Inquiry | 2
| Introduction |

work carried out in 2019. The forecast is based on the most recent detailed analyses of demand data,
which were first analysed in detail in 2014.

1.3 Structure of this report
The structure of this report is as follows:

●   Section 2 – an overview of the update to the estimate of connected population;
●   Section 3 – the data review including the analyses of consumption, non-revenue water and climate
    data;
●   Section 4 – a summary of the approach taken to forecast demand for the metropolitan area;
●   Section 5 – the forecast results;
●   Section 6 – the draft Auckland Waters Strategy
●   Section 7 – recommendations for continuous improvement.

                                                        Waikato River Water Take and Discharge Proposal – Board of Inquiry | 3
| Population update |
2 Population update
2.1 Background
The estimate of connected population now and in the future is the most significant driver of demand
and also one of the most difficult to determine and forecast. The Auckland population estimates used
by Watercare to create this forecast align with Auckland Council’s “i11v6” forecast model, dated 24
August 2020.
There has been considerable change to the population forecasts since the 2013 application, as
follows:
● A change in the base models from the “ARFM model” to the “ART i11 model” (this occurred in
2015);
● Ongoing Statistics New Zealand updates that are incorporated into the ART model;
● Changes to the geospatial analyses and methods used to estimate the current connected
population;
● New communities connecting to the metropolitan supply or where Watercare is signalling an
intention to connect new communities to the supply;
● The Auckland Unitary Plan (Operative in Part) (AUPOiP), which prioritises urban intensification.
This impacts the methodology for estimating the future connected population; and
● A change from the ART i11v3 population forecast to the ART i11v6 forecast in August 2020.
The last NZ census was held in 2018. Statistics NZ has determined that response rates from some
population sub-groups was particularly low, leading to uncertainties in the accuracy of the census
results. At the time of completing these analyses Statistic NZ stated that the Census usually resident
population count was accurate to within 0.6%.
The AUPOiP is Auckland’s cornerstone planning document. The document sets out what can be built
and where and how to create a higher quality and more compact Auckland. These two factors
influence how population will be distributed within the Auckland region and the type of dwellings
Aucklanders will live in. This in turn impacts the demand on the metropolitan supply.
2.2 Population data
Auckland Council uses the Statistics NZ data as the basis for its planning (ART) models. The i11v6
population scenario does not include population prior to 2018. It is based on the Census 2018
population data current at that time and suggests nearly 80,000 fewer people reside in Auckland in
2018 than was assumed in the i11v3 forecast, as shown in Figure 2-1. This has a significant impact
on the assumptions about the underlying characteristics of per capita consumption. However, forecast
demand is less sensitive to the base year assumptions and more sensitive to the gradient of future
population change, which is similar between the i11v3 and i11v6 projections, presented in Figure 2-2.
Waikato River Water Take and Discharge Proposal – Board of Inquiry | 4| Population update |
Figure 2-1 Comparison of population data sets
Figure 2-2 ART models i11v3 and i11v6 population projections
Watercare’s metropolitan water supply network provides water to Aucklanders who are directly
supplied by them via this network, Aucklanders resident in Papakura, who are supplied from the
network by Veolia Water, and Waikato District Council residents in the Tuakau and Pokeno areas that
are connected to this supply. Aucklanders who are not connected to the metropolitan supply are
either connected to one of Watercare’s non-metropolitan supplies (in towns like Warkworth,
Helensville and Wellsford) or use rainwater or groundwater as their supply.
Figure 2-3 provides a schematic representation of this.
Waikato River Water Take and Discharge Proposal – Board of Inquiry | 5| Population update |
Figure 2-3: Schematic of population connected to Watercare’s metropolitan supply
During dry periods customers with rainwater tanks may use tanker trucks filled from Watercare’s
metropolitan supply to refill their tanks. This includes properties outside of the greater Auckland region
in North Waikato and the Kaipara District.
2.3 Connected population estimates
The change from the ARFM to the ART i11 model, the AUPOiP assumptions and the provision of
supply to Tuakau and Pokeno in the north of the Waikato District Council supply area triggered a
review of the connected population estimate in 2019.
Appendix A sets out the detail of the approach used to estimate the base year (2018) and future
connected population based on ART i11 v3. This connected population percentage has been applied
to the i11v6 forecast.
2.3.1 2018 base year population
The base year for the 2020 demand forecast is 2018. The connected population in 2018 was
calculated using the percentage connected based on i11v3 (90.71%), applied to the i11v6 population.
To ascertain whether this assumption is reasonable, an analysis of the change in per census area unit
over the growth horizon was carried out. The difference is accounted for as uncertainty in headroom.
The population for the parts of the Waikato District supplied from Watercare’s metropolitan supply and
for Papakura are accounted for separately, as the demand for these bulk supplies is disaggregated
from the main metropolitan Auckland forecast
The population between 2013 and 2018 is of interest to calculate historic per capita water
consumption. The approach to calculating this was to interpolate the regional population between the
Waikato River Water Take and Discharge Proposal – Board of Inquiry | 6| Population update |
i11v3 2013 figure and the i11v6 2018 figure. In 2019 a detailed bottom up assessment of connected
population and connecting communities (such as Pukekohe in 2014) was completed. The resultant
connected population as a total proportion of the regional population was calculated from this detailed
bottom up review. These proportion connected percentages have been applied to the interpolated
population to estimate the connected population between 2013 and 2018 as shown in Table 2-1.
Table 2-1 Derivation of connected population, 2013 to 2018 (excluding Papakura and Waikato District
populations) (reported to 3 significant figures)
2013 2014 2015 2016 2017 2018
i11v3 1.46m
regional
total
i11v6 1.58m
regional
total
Interpolated 1.49m 1.51m 1.53m 1.56m
population
% 88.94% 90.41% 90.49% 90.57% 90.64% 90.71%
connected
Connected 1.30m 1.33m 1.35m 1.38m 1.41m 1.43m
population
For clarity we note that the population in Table 2-1 does not include the population of Papakura or
Waikato District Council, which are forecast separately.
2.3.2 2046 population
The distribution of the future population is likely to change from 2018 given the scale and nature of the
population increase. Some areas that are currently outside of the Metropolitan supply boundary will be
supplied in the future. The approach taken to estimate this in 2019 was as follows:
● All of the ART i11v3 units were mapped;
● This was used to identify the growth expected within each zone;
● The existing water supply zones were identified, to understand where growth is expected within or
outside of the existing boundary;
● Estimate the future connected population within the current water supply zones by summing all
of the forecast changes in population (both increases and reductions);
● Where growth is expected to be partially or fully outside of the water supply zones each unit
was inspected and a standard approach followed to assess whether the population growth would
be expected to be serviced by the Metropolitan supply in the future; and
● Lastly, cross-checks were made against the Auckland Unitary Plan Operational in Part to verify
whether growth areas outside of the existing water supply zones may be connected in the future.
The calculated connected population for 2046 was calculated as 91.85 % of the total regional
Auckland population, or a total of 1.96 million people (excluding Papakura and Waikato District
Council populations).
2.3.3 2055 population
The percentage connected for 2046, 91.85%, was applied to the i11v6 Auckland population projection
to 2055, with an estimated connected population of 2.1 million people (excluding Papakura and
Waikato District Council populations).
Waikato River Water Take and Discharge Proposal – Board of Inquiry | 7| Population update |
2.4 Papakura population
The i11v6 population projection that has been used for Papakura is shown in Figure 2-4, along with
the i11v3 projection. The two projections for these communities diverge beyond approximately 2030,
at which point there is a significant inflection in the i11v6 projection. The forecast assumes that all of
the Papakura population is connected to the metropolitan supply via the Papakura BSP. The data
suggests that beyond 2030 the i11v6 projection suggests very little growth in the Papakura area. This
has an impact on the demand forecast as the Papakura demand is based on this lower population
projection.
Figure 2-4 Papakura population projections
The Papakura population supplied in 2046 is forecast to be around 80,000 people, increasing to
around 81,000 people by 2055. The major Drury-Opaheke growth area lies adjacent but outside of
this Local Board area.
Waikato River Water Take and Discharge Proposal – Board of Inquiry | 8| Data Review |
3 Data review
This section of the report updates the available data for the metropolitan supply area from 2014 to
2019 and where possible to 2020. It starts by considering the overall volume of water supplied and is
followed by analysis of the different components of demand. The effects of climate on consumption
are also considered.
3.1 Production and consumption
3.1.1 Water production
The annual water production data, adjusted for daily reservoir fluctuations (a so-called demand proxy
dataset), are presented in Figure 3.1. This shows how water produced has varied over the last 13
years, with the lowest annual average demand in 2006 of 363 ML/d and the highest of 446 ML/d in
2020.
Demand is driven by a number of factors, including population and climate, which are analysed later in
this report. Production volume is compared to water supplied through the bulk supply points (BSP
volume) in Figure 3.2. The BSPs mark the end of the transmission mains and the start of the retail or
general reticulation network. Growth in demand has been on average 8.8 ML/d per annum (annual
average demand) between 2013 and 2020. Note that the BSP volumes are higher than the water
production volumes between 2006 and 2008. This is due to meter reading errors across the two
datasets. The disparity in these datasets explains why Watercare takes a different approach to
determining production for non-revenue water calculation purposes, as discussed in section 3.7. Over
the period of the dataset specific bulk supply meter errors have been identified and in some places
corrected. These are detailed where relevant.
Demand in 2020 has been highly atypical, due to:
● A very hot dry summer period, resulting in an extended period of high demand;
● COVID-19 lockdown level 4, which changed where, how and why water was used in Auckland; and
● Water restrictions from May 2020 onwards.
It has also had a large impact on the average growth in demand. For the period 2013 to 2019 average
annual growth in demand was 7.5 ML/d/annum, which increased to 8.8 ML/d/annum over the period
2013 to 2020.
Waikato River Water Take and Discharge Proposal – Board of Inquiry | 9| Data Review |
Figure 3-1: Average daily water produced, 2006 to 2020 (metropolitan areas only). Voluntary restrictions were
requested in March 2017. Source: Daily production data (A. Lester)
Figure 3-2: Average daily water produced and supplied, 2006 to 2020 (metropolitan areas only). Source: Daily
production data (A. Lester) and BSP volumes (L.Gan)
Waikato River Water Take and Discharge Proposal – Board of Inquiry | 10| Data Review |
Production in winter is a useful indicator of year-on-year demand growth as it is independent of
climate. Figure 3-3 compares the winter (calendar year, May to August) average production (financial
year (FY) end) over the period 1999 to 2020 with annual average production. Average annual growth
in winter production was 9.3 ML/d per annum between 2013 and 2019.
There is a reversal in the trend of winter demand growth in 2020. Demand restrictions were imposed
in May 2020 and this, combined with the COVID 19 lockdowns over the April/May and August periods,
and the economic impact of COVID 19 (reduced visitor numbers, reduced commercial activity) has
resulted in winter demand similar to 2018 levels.
Figure 3-3 Average daily winter production (May to August) against annual production, 2000 to 2019 (metropolitan
areas only). Source: Daily demand proxy data (A. Lester)
3.1.2 March 2017 data
The production and consumption data for 2017 are affected by the aftermath of the Tasman Tempest,
which occurred over the period of 7th to 8th March 2017. Following this event there were landslips
and consequently elevated silt content in the Hunua dams. These dams normally supply around 60%
of Auckland’s water through the Ardmore water treatment plant (WTP). During this period the WTP
was unable to adequately treat the raw water at its normal production rate.
As a result, Watercare requested voluntary water savings of 20 L/person/day from Aucklanders. It
aimed to limit the maximum daily demand volume to around 400 ML/d. Water demand reduced, which
avoided the need to issue a ‘boil water’ notice. The production volumes during this period do not
reflect ‘normal’ demand values, that is the demand that would have occurred had restrictions not been
requested. The 2017 data must be interpreted with this in mind and have been excluded from the
analyses where appropriate.
3.1.3 Breakdown of consumption
Watercare’s consumption data (average daily demand, based on customer meter records) was
provided to us in the disaggregated components of demand. The understanding of these components
Waikato River Water Take and Discharge Proposal – Board of Inquiry | 11| Data Review |
of demand has been used as the basis of the demand forecast. The disaggregation of demand is
shown in Figure 3-4 and comprises the following components:
● Domestic demand;
● Commercial demand;
● The Papakura and Waikato bulk supplies; and
● Non-revenue water.
These components of demand form the total bulk supply (BSP) volume, the volume of water that is
delivered from the transmission system to the retail or wider reticulated network. The difference
between water produced and the BSP volume is the losses in the transmission network. Each
component of demand is discussed in detail in sections 3.2 to 3.7.
Consumption data were analysed for the period 2013 to 2019 (noting the 2020 data were not yet
available) These data were sourced from Watercare’s consumption database. The reliability of the
categorisation of these datasets between consumption of end-user types continues to improve with
time.
Figure 3-4: Disaggregation of Watercare’s demand, 2013 to 2019 Source: Annual consumption data and water
loss calculations (L. Gan)
Waikato River Water Take and Discharge Proposal – Board of Inquiry | 12| Data Review |
3.2 Domestic consumption
Total annual domestic consumption is shown in Figure 3-5. This shows that there has been an
increasing trend in total domestic consumption since 2010, rising from 200 ML/D in 2010 to 228 ML/d
in 2019. Growth in domestic consumption has been steady at approximately 3.7 ML/d per year
between 2013 and 2019. The full 2020 consumption dataset was not available at the time of this
assessment.
Figure 3-5: Metropolitan domestic consumption, 2010 to 2019. Source: Annual consumption data (A. Powell)
A hidden complication is that the consumption from blocks of flats, apartments and Housing New
Zealand properties are not billed directly to domestic customers but are instead billed to an
organisation (such as a Body Corporate). These customers are usually categorised as commercial
(non-domestic) users and consumption from these properties is included within the commercial
consumption. The most significant impact of the allocation of domestic consumption into the
commercial category is that the domestic per capita consumption is understated.
Domestic per capita consumption (PCC) is shown in Figure 3-6 and Table 3-1. This is calculated as
the total domestic consumption, divided by the metropolitan connected population (less customers
supplied from the Papakura and Waikato District bulk supplies). This shows that although domestic
consumption has been increasing, domestic PCC is relatively consistent over the period 2013 to 2019.
Table 3-1: Domestic PCC 2013 to 2019
2013 2014 2015 2016 2017 2018 2019
PCC 164.6 163.7 162.4 162.4 160.1 162.8 163.5
The average figure over this period is 162.8 l/person/d, which corresponds to the 2018 (baseline)
figure and which has been used for forecasting purposes.
Waikato River Water Take and Discharge Proposal – Board of Inquiry | 13| Data Review |
Note that the effects of the voluntary restrictions requested during the Tasman Tempest mean that the
2017 are considered less reliable for assessing PCC trends, as discussed in section 3.1.2 . A
combination of the 2006 Stats NZ population data, ARTi11v3 and ARTi11v6 data were used to
estimate the PCC, as summarised below and discussed in more detail in Section 2.
● 2010 – 2012: Population interpolated between the 2006 Stats NZ population and the 2013
ARTi11v3 data;
● 2013 – 2017: Population interpolated between the 2013 ARTi11v3 and 2018 ARTi11v6 data; and
● 2018 – 2019: ARTi11v6 population data.
Figure 3-6: Domestic consumption and PCC, 2010 to 2019
Waikato River Water Take and Discharge Proposal – Board of Inquiry | 14| Data Review |
3.3 Commercial consumption
3.3.1 Historical consumption
Commercial consumption data are available for the period 2011 to 2019. As noted in the 2014 report,
there is low confidence in the 2010 dataset and that year has been excluded from this analysis of
commercial demand. The average increase in demand between 2013 and 2019 has been 1.05 ML/d
per annum.
Figure 3-7 shows the commercial metropolitan consumption from 2011 to 2019. The full 2020
commercial consumption dataset was not available at the time of this assessment and was therefore
excluded from this report.
Figure 3-7: Metropolitan commercial consumption, 2011 to 2019. Source: Annual consumption data (A. Powell)
3.3.2 Forecasting
A range of factors have been explored for forecasting commercial consumption. In 2014, projections
of Auckland Regional employment and floor space were available, which were obtained from the
Auckland Council’s 2011 Auckland Growth Model. As noted above, the 2014 commercial
consumption forecast was based on allocated floor space projections. However, no data reporting
actual allocated floor space has been published and no new projections are available. As in 2014, for
the update of this work in 2019 other projections were sought from Statistics NZ, Auckland Council
(Economic Development Strategy and Auckland Plan) and Ministry of Business Innovation and
Employment (MBIE) data. To be relevant for forecasting purposes a dataset has to be:
● Available as actual values from ~2011 onwards;
● Projected into the future over the 35 year period of the forecast; and
Waikato River Water Take and Discharge Proposal – Board of Inquiry | 15| Data Review |
● A significant driver of commercial consumption.
The 2019 analysis concluded that the only projection that covers the 30-year future period is
population. As such, an analysis of the link between commercial consumption and population was
carried out. Both regional and connected population were considered, as commercial consumption
(broadly comprising commercial, industrial and government service users) may be linked to overall
population in the Auckland region, not just those inhabitants connected to the water supply network.
The results of these analyses showed that there is around a 20ML/d difference between the different
models by 2055, with consumption modelled to lie between 124-142ML/d. Uncertainty relating to this
component of demand is reasonably included in headroom.
It is recommended that the following equation is used for forecasting commercial demand at this time:
Commercial consumption = 0.00004542 * regional population + 28.16
This relationship should be periodically reviewed, and in particular revisited if there are significant
changes to consumption, or if domestic and commercial consumption is re-classified.
3.4 Papakura bulk supply
Veolia Water is the retail water provider for the Papakura area, an arrangement that was in place prior
to the integration of the Auckland Councils in 2010. Watercare provides a bulk supply to Veolia Water.
Figure 3-8 shows Papakura’s estimated population growth from 2013 to 2020 against growth in
demand. The rate of growth in demand has been higher than estimated population growth for most of
this period.
Note that the 2017 demand for this supply area was also subject to voluntary restrictions following the
Tasman Tempest and it is further suspected that there are additional errors in the 2017 dataset in the
period July to August 2016 (the start of the 2017 financial year), as shown in Figure 3-9.
Waikato River Water Take and Discharge Proposal – Board of Inquiry | 16| Data Review |
Figure 3-8: Papakura population growth against demand, 2010 to 2020 Source: Annual supply data (L. Gan) and
ARTi11v6 population forecast
Figure 3-9 Papakura Bulk Supply Data 2012 to 2020 to show anomaly at the start of the 2017 financial year
Figure 3-10 shows the gross PCC5 (total supply divided by population) calculated for the Papakura
supply over this time. The population i11v6 population has been used for the calculation, assuming all
people in the Papakura Local Board area are connected to the metropolitan supply.
5
Gross per capita consumption is calculated as the water supplied for all uses (domestic and
commercial consumption and non-revenue water) divided by the population. This differs to domestic
per capita consumption reported in Section 3.2.
Waikato River Water Take and Discharge Proposal – Board of Inquiry | 17| Data Review |
The gross PCC increased from just over 300 L/person/day in 2010 to around 350 L/person/day in
2016 and 2018. Gross PCC in 2019 was 359 L/person/day and 357 L/person/day in 2020. These
figures are very sensitive to the estimated population.
The bulk supply to Papakura is included in the baseline forecast on the basis of a gross PCC of 350
L/person/day in line with the 2018 PCC. When a dry year factor of 2.5% is added to this, the PCC of
358 L/person/day aligns with the reported 2019 and 2020 figures.
Figure 3-10: Papakura PCC, 2010 to 2020 Source: Annual consumption data (L. Gan) and ARTi11v6 population
forecast
Waikato River Water Take and Discharge Proposal – Board of Inquiry | 18| Data Review |
3.5 Waikato District Council
Watercare has an agreement with Waikato District Council to provide a bulk supply of water to support
its operations. This comprises a supply to the communities of Tuakau and Pokeno. The supply was
established in the 2017 financial year and has grown steadily since that time as shown in Table 3-2.
Figure 3-11 shows monthly demand over the supply period. The summer peak period shows an
increase greater than the Auckland metropolitan area, characteristic of a smaller supply.
Table 3-2: Annual supply volumes to Waikato District Council 2017 to 2020 Source: L Gan
Financial year Annual average supply (ML/d)
2017 1.86
2018 2.04
2019 2.20
2020 2.34
Figure 3-11: Water supplied to Waikato District Council Source: L Gan
Waikato River Water Take and Discharge Proposal – Board of Inquiry | 19| Data Review |
3.6 Water efficiency
Watercare published a Water Efficiency Strategy outlining the water and network efficiency strategies
planned between 2017 and 2020 (Watercare, 2017). At the time of writing Watercare was in the
process of updating this plan to cover the period 2021 to 2025.
Two programmes of work that will reduce customer consumption and customer-side losses have been
approved and are moving to an implementation phase. These comprise:
● Installing smart meters at all schools across Auckland, to enable improved understanding of water
use and rapid on-site leak detection and repair. This is expected to save 0.29 ML/d and Watercare
plans to install the meters by the end of June 2021.
● Installing smart meters for its one thousand largest commercial customer accounts. This will also
provide information to enable customers to use less water and find and repair leaks more rapidly.
Savings of 0.97 ML/d are expected from 2022 onwards.
These savings are included in the baseline demand forecast presented in this report.
The report “Water Source Alternative Options Assessment for the Metropolitan
Supply” (Beca, 2020) includes two additional water efficiency and network efficiency
schemes (portfolios of interventions) to compare against future supply options.
3.7 Non-revenue water
Non-revenue water (NRW) is the water that Watercare abstracts from the environment, treats at its
water treatment plants and puts into the distribution system, but does not get income for.
NRW is not solely water that is lost from the supply network. The International Water Association
(IWA) defines that NRW comprises a combination of:
● Real water losses;
● Apparent water losses, comprising unauthorised consumption (theft) and uncertainties arising from
meter under-recording; and
● Unbilled authorised consumption, such as water used for firefighting or operational purposes.
The IWA standard water balance and guidance to minimise water losses was adapted for use in New
Zealand by Water NZ’s ‘Water Loss Guidelines’ and this forecast refers to its component parts.
Watercare’s internal reporting of real losses is as a percentage value of average daily demand
calculated on a rolling 12-month average basis. Real losses in the retail network are calculated as
total NRW (bulk supply volumes minus consumption) less:
● An allowance for customer meter under-recording of 5.26% of sales, reflective of its aging meter
fleet;
● An allowance for unauthorised usage of 0.45%, based on internationally recommended values; and
● An allowance for operational use of 0.5%, also based on internationally recommended values. On
top of this Watercare also measure operational use in the transmission system and regular network
flushing activities.
Meter under-recording occurs in customers’ mechanical meters. At low flows there is insufficient
energy for the water passing to move the meter vane or other mechanical measuring device. This
means the meter does not record the volume of water that is consumed. Meter under-recording tends
to increase with meter age.
Waikato River Water Take and Discharge Proposal – Board of Inquiry | 20| Data Review |
Losses in the transmission network are calculated as 2% of total sales. Operational use on the
transmission network, for example due to flushing and repairs, are recorded and subtracted from this
figure.
Watercare’s total metropolitan real losses (water lost from the pipe system) and apparent losses
(water not billed for, including unauthorised use, operational use and meter under-recording) are
presented in Figure 3-12.
Figure 3-12 Twelve month rolling non-revenue water and real loss volumes, January 2016 to January 2020
Watercare’s Statement of Intent (2019-22) sets out the current Service Level Statement for NRW,
which is a target to maintain the ‘real losses’ component of NRW below 13% (12-month rolling
average) of the water supplied until 2022. This applies to the combined metropolitan and non-
metropolitan supply systems. In its 2020 Annual Report, Watercare reports that real losses to January
2020 were 13.2%, compared to its target of 13%.
NRW has been forecast assuming:
● Real losses per connection are held at the current level;
● Transmission losses are 2% of the BSP volume;
● Customer meter under-recording remains at 5%; and
● Unauthorised consumption remains at 0.45% and operational use remains at 0.5%.
Waikato River Water Take and Discharge Proposal – Board of Inquiry | 21| Data Review |
3.8 Climate
The demand for water is affected by climate, specifically rainfall and temperature. The purpose of this
section is to examine how historical demand has been affected by climate and to determine whether
there are factors that can be applied to forecast demand.
The annual and summer (peak) period average rainfall and temperature have been analysed using the
Auckland Airport climate station data, sourced from NIWA.
3.8.1 Annual average demand
Annual (July to June financial year) rainfall and temperature from 2000 to 2020 were analysed to
enable the comparison of climate between years. Each year was classified with respect to the long-
term average annual maximum temperature (19.3°C) and rainfall (1109 mm), based on data from
1962 to 2020 (rainfall) and 1966 to 2020 (temperature). This information is plotted on Figure 3-13.
Whilst occurrences of average annual rainfall being above or below the long-term average were
approximately equal between 2000 and 2020, average maximum temperature was higher than the
long-term average for 15 of the last 21 years. 2003 (label hidden near axes) had the rainfall and
temperature closest to the long term averages out of the past two decades.
Figure 3-13: Annual average maximum daily temperature and annual average rainfall recorded at Auckland
Airport from 2000 to 2020, with respect to the long-term averages. Source: NIWA
The comparison between water produced and annual rainfall (Figure 3-14) and average daily
maximum temperature (Figure 3-15) shows higher demand in 2010 when rainfall was lower and
temperature was higher. Demand rose in the hottest year (2018), but not as much as in the dry years
of 2019 and 2020.
Waikato River Water Take and Discharge Proposal – Board of Inquiry | 22| Data Review |
Figure 3-14: Average annual total rainfall against daily water produced (demand proxy), 2000 to 2020 Sources:
NIWA, A. Lester
Figure 3-15: Annual average maximum temperature against daily water produced (demand proxy), 2000 to 2020.
Sources: NIWA, A. Lester
Waikato River Water Take and Discharge Proposal – Board of Inquiry | 23| Data Review |
3.8.2 Summer period
Rainfall and temperature data for the January to March period for the years 2000 to 2020 were
analysed in the same way as the annual datasets. Each year was classified with respect to the long-
term average maximum temperature (23.4°C) and average rainfall (214.9 mm) for these months.
This analysis showed that nine of the last twenty one summers were categorised as “warm and dry”
compared to the long term average (Figure 3-16). The driest summers at the Auckland Airport gauge
were 2010 and 2013, followed by 2020. The hottest summer was 2018, followed by 2016 and 2015.
Figure 3-16: Summer (January to March) average maximum daily temperature against summer average rainfall
recorded at Auckland Airport from 2000 to 2020, with respect to the long-term average. Source: NIWA
Rainfall and production for the summer period have been compared in Figure 3-17. There is an overall
trend of increasing demand, which is expected due to the increase in population over time. The link
between demand and “all of summer” rainfall indicate that low rainfall increases summer demand
(2008, 2010, 2013, 2019 and 2020 for example), whilst wetter summers suppress demand (2011-12
and 2016-18).
Figure 3-18 whilst some cooler summers show a lower demand (2012, 2014, 2017), not all of the
hottest summers show increasing demand.
Waikato River Water Take and Discharge Proposal – Board of Inquiry | 24You can also read