Analysis of the Factors Affecting the Competitiveness of ASEAN-5 Countries
←
→
Page content transcription
If your browser does not render page correctly, please read the page content below
Asian Journal of Social Science Studies; Vol. 6, No. 1; 2021
                                                                               ISSN 2424-8517        E-ISSN 2424-9041
                                                                                                Published by July Press

    Analysis of the Factors Affecting the Competitiveness of ASEAN-5
                                 Countries
                                       Tarwo Kusnarno1 & Eddy Suratman2
1
    Doctoral Program of Faculty of Economics and Business, Universitas Tanjungpura, Pontianak, Indonesia
2
    Faculty of Economics and Business, Universitas Tanjungpura, Pontianak, Indonesia
Correspondence: Tarwo Kusnarno, Doctoral Program of Faculty of Economics and Business, Universitas
Tanjungpura, Pontianak, Indonesia. E-mail: desertasitarwo@gmail.com

Received: February 17, 2021            Accepted: March 10, 2021                 Online Published: March 31, 2021
doi:10.20849/ajsss.v6i1.884                              URL: https://doi.org/10.20849/ajsss.v6i1.884

Abstract
This study analyzes the factors that affect the competitiveness of ASEAN-5 countries in terms of Labor
Productivity, Net Exports, Investment, Inflation and Exchange Rates in two periods, namely the ASEAN internal
crisis and the global crisis using the times series data from 1997-2017, then analyzed with the regression analysis
model. The results showed that the labor productivity of the 1997-2008 period had a positive and significant effect
on the competitiveness of ASEAN-5, as well as the period of 2008-2019, labor productivity had a positive and
significant effect on the competitiveness of ASEAN-5. The net export period of 1997-2008 had a negative and not
significant effect on the competitiveness of ASEAN-5, as well as the period of 2008-2017, the net export had a
negative and not significant effect on the competitiveness of ASEAN-5. The investment period of 1997-2008 has a
negative and not significant effect on the competitiveness of ASEAN-5, while the period 2008-2017 has a positive
and not significant effect on the competitiveness of ASEAN-5. Inflation in the 1997-2017 period had a negative
and insignificant effect on the competitiveness of ASEAN-5, as well as the 2008-2017 inflation period had a
negative and not significant effect on the competitiveness of ASEAN-5. Exchange rates for the period 1997-2008
have a negative and insignificant influence on the competitiveness of ASEAN-5, as well as the 2008-2017 period,
which has a negative and insignificant effect on the competitiveness of ASEAN-5.
Keywords: competitiveness, labor productivity, investment, inflation and exchange rates
1. Introduction
In the era of globalization when the flow of goods and services can move freely, a country must have strong
competitiveness to be able to attract foreign investment to increase the country's income and economy. Many
factors affect the competitiveness of a country, including the problem of innovation, human resources, natural
resources, education, infrastructure and qualified technology. With the existence of the ASEAN community or
ASEAN community, this is one of the advantages and advantages for ASEAN members in trading goods and
services for the commodity among ASEAN countries. However, on the other hand it can also be a disaster if the
competitiveness of an ASEAN country is weak so that its goods are not in demand by other countries in the region,
if goods from other countries in ASEAN actually instead flood a country so that the country only used as a market
for trading, making it difficult for local entrepreneurs in the country to market their products and products.
Inequality between ASEAN member countries due to different infrastructure factors, only Singapore from
ASEAN 5 member countries are able to have infrastructure competitiveness ranked fifth in the world, other
member countries are still below, Indonesia, Thailand, Malaysia and the Philippines have decreased
competitiveness ranked in the 30-70 world range (International Monetery Fund, 2018). But ASEAN is one of the
Asian organizations that is considered the most stable economy compared to other walayah. Where other countries
are improving their economies from the crisis, ASEAN economic growth has even improved and is dynamic.
There are several reasons why ASEAN can become a giant of the world economy, namely most of the countries
that are members of ASEAN-5 have a large enough population and this if managed properly, will be a quite
profitable market for the ASEAN 5 economy with the development of resources human power. According to the
ASEAN Secretariat (2016), the total population of ASEAN has reached 628.9 million or around 8.7% of the
world's population (The ASEAN Secretariat, 2016).

                                                        1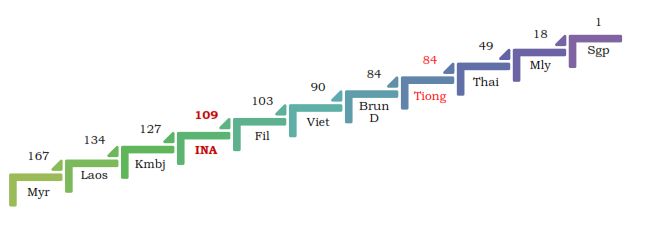
http://ajsss.julypress.com              Asian Journal of Social Science Studies                     Vol. 6, No. 1; 2021

According to Nababan (2017), during the period 2008/2009 to 2016/2017, the ranking and index of GCI from each
ASEAN-7 country continued to increase. The pillars of the basic needs sub-index still dominate the largest
contribution to increasing the competitiveness index for Indonesia, the Philippines, Thailand, Cambodia, and
Vietnam. As for Malaysia and Singapore, the efficiency index and innovation sophistication sub-index has been
able to provide the largest contribution to improving GCI. The GDP of ASEAN-7 countries has a positive and
significant impact on increasing the global competitiveness index, except for Thailand. The most problematic
factors in increasing the competitiveness index are corruption, insufficiently educated workforce, access to finance,
tax regulations, and inefficient government bureaucracy.
Most of the problems hampering the ASEAN-5 member countries' businesses are corruption, which in its report
the global competitiveness report in 2005 and 2017 shows that business obstacles in Indonesia in 2017 are,
corruption 13.8, inefficient government bureaucracy 11.1, access to financing 9.2, inventory supply of
infrastructure 8.8, policy instability 8.6. whereas in 2005 the problems in Indonesia were inadequate supply of
infrastructure 20.15, inefficient government bureaucracy 14.07, policy instability 14.02 and tax regualtions 10.45
Malaysia in 2017 were, access to financing 12.5, foriegn currency regulations 9.2, inefficient government
bureaucracy 8.9, inflation 8.5, tax rates 7.9 and corruption 7.4. Whereas in 2005 the problems were inefficient
government bureaucracy 15.44, restrictive labor regulations 8.32, tax regulations 8.32, foreign currency
regulations 8.11 and corruption 8.00. The Philippines in 2017 are, inefficient government bureaucracy 19.7,
inadequate supply of infrastructure 17.9 corruption 13.7, tax tegulations 13.7, tax rates 8.9 and policy instability
7.6. Whereas in 2005 the problems were corruption 21.47, policy instability 15.31, infallible supply of
infrastructure 15.18 and government isntability / coups 13.61. Singapore in 2017 is restrictive labor regulations
26.3, inefficient government bureaucracy 22.4, inflation 14.1, inadequately educated workforce 9.2 and poor work
ethic in national labol force 5.8. Whereas in 2005, inadequately educated workforce 15.87, restrictive labor
regulations 15.71 and tax regulations 11.86, while corruption, commitment instability / coups and crime and thaft
were the lowest business impediments in Singapore. Thailand in 2017 is, government instability / coups 13.6,
inefficient government bureaucracy 12.1, instability policy 12.0, insufficient capacity on innovate 10.5 and
corruption 10.1. In 2005 inefficient government bureaucracy 17.77, corruption 14.68, policy stability 13.91, while
the smallest obstacles were crime and theft and foreign currency regulation and tax rates.
Some studies suggest that exports, imports, currency values, tourism, business innovation, and business
sophistication, privatization of SMEs, productivity, is one of the efforts of a country in increasing their
competitiveness against other countries. Because the increase in exports will increase government capital both
abroad and in the country. One of the things that makes Indonesia's competitiveness rank is due to success in
sustaining efficiency and innovation and business sophistication, and inhibiting Indonesia's business
competitiveness is corruption (Raimanu, 2016). Unlike the case in Egypt, Lebanon and Yemen in his research
Nazmfar et al, (2019) although from year to year it has improved but is still inferior to other Middle Eastern
countries, the weakness is due to several Middle Eastern countries superior to tourism competitiveness. Fry &
Honnold (2010), found that a barrier to competitiveness in several ASEAN countries was that the ease of
importing and exporting varied greatly among ASEAN members. Countries that facilitate imports and exports tend
to rank above competitiveness proved that for trade is relatively easy to resolve in Singapore, Thailand and
Malaysia, but it is very difficult in Laos and Cambodia.
This research provides an overview of the competitiveness between countries involved in a regional trade
integration, where the existence of this integration creates opportunities and obstacles for the actors. Commodities
from countries that are involved in a trade integration must have competitiveness both in intra trade and inter trade.
2. Literature Review
International trade today cannot be avoided by any country, because every country needs other countries to meet
the needs of its people and almost all countries benefit from international trade. Factors influencing international
trade include the diversity of production conditions among these countries, the decline in production costs and
differences in tastes (Paul & William, 2004). National competitiveness is a result of the ability of a country to
innovate so as to achieve or maintain a favorable position for the country compared to other countries in several
sectors (Poter, 2008).
The Global Competitiveness Report in determining the competitiveness of countries using 12 pillars as a quality
assesses the score and ranking of the competitiveness of world countries, including Institutions (Infrastructure),
Infrastructure, Macroeconomic Environment, Health and Primary Education Primary Education), Higher
Education and Skills Training (Higher Education and Training), Goods Market Efficiency (Goods Market
Efficiency), Labor Market Efficiency (Labor Market Efficiency), Financial Market Development (Technological

                                                          2
http://ajsss.julypress.com Asian Journal of Social Science Studies Vol. 6, No. 1; 2021
Market Readiness), , Market Size (Business Size), Business Satisfaction (Business Sophistication) and Innovation
(World Economic Forum, 2018).
The competitiveness of a country or region includes the following main elements, increasing the standard of living
of the community, being able to compete with other regions and regions, being able to fulfill its obligations both
domestically and internationally, being able to provide employment, and sustainable development and not
burdening the generation that will came (Bank Indonesia, 2008). Porter's theory of competitiveness departs from
his belief that classical economic theory that explains comparative advantage is inadequate, or even incorrect.
According to Porter, a country gains a competitive advantage if the company (which is in the country) is
competitive. A country's competitiveness is determined by the ability of industries to innovate and improve their
capabilities. Porter offers the Diamond Model as a tool of analysis as well as a framework for building recipes to
strengthen competitiveness.
In the course of time, Porter's diamond models have not been able to draw criticism from various circles. In fact,
there are several aspects that are not included in this Porter equation, one of which is that the diamond model was
built from case studies in ten developed countries, so it is not very appropriate if used to analyze developing
countries. In addition, the increasing complexity due to globalization, as well as changes in the economic system
following changes in the political regime, makes the Porter diamond model only worthy of being a pioneer and the
first reference in the field of study to build the country's competitiveness.
Dung Cho explained that the Berlian Porter model is less biased in explaining several industries in South Korea.
Dung Cho explained that we need a model that can explain to all of us, not how many resources a country has but
who can create resources and when each resource should be created.
According to Keser (2015), in his research found that productivity with regard to the national economy means
"generating added value". Earning and increasing productivity are obtained from trained workers. Someone who
has received better education tends to adapt in learning new things, new conditions of production, and in
accordance with increased productivity. Because of the direct proportion between education, learning capacity,
and increased productivity, education is very important in developed countries, namely vocational higher
education and skills-oriented general education. Likewise, according to Todaro & Smith (2015), education is one
of the important pillars to encourage increased productivity.
Advantages in comparative advantage theory say that productivity is not the only factor a country can increase
competition with other countries, but factors, reduce average production costs, low input factors, low labor costs,
ownership of natural resources, ownership of p financial condition that makes the country at a competitive
advantage. Absolute advantage in Adam Smith's theory had become a major concern and theme in international
trade after porters updated Smith's ideas with the theory of competitive advantage, where the factor of competitive
advantage was productivity being a major factor in international business competition (Ministry of Finance, 2014).
The theory of international trade suggests that there are two main reasons that each country conducts international
trade. First, countries conduct international trade because they are different from each other. The nations of this
world, like individuals, always have the opportunity to benefit from the differences between them through an
arrangement such that each party can do something relatively better. Second, countries trade with each other with
the aim of achieving what is commonly referred to as economics of scale in production, for example between
Volvo cars and BMWs.
If each country can limit its production activities to produce a certain number of goods, then they have the
opportunity to focus attention and all kinds of resources, so they can produce these goods on a larger scale and
more efficient than if the country tried to produce various types of goods at once. In the real world, patterns of
international trade reflect the ongoing interaction of the two basic motives above. In the era of globalization that
engages the WTO, it is intended to have competitiveness between countries and globally, so that international
trade is realized so that the use of open markets to increase its exchange value, with an expectation that export
values are higher than the value of imports (Goetjahjanti, 2016).
A country has a comparative advantage in producing an item if the cost of its sacrifice in producing that item (in
units of other goods) is lower than other countries. There is an inseparable link between the concept of comparative
advantage with international trade, that is, trade between two countries will benefit both parties if each country
produces and exports a product whose comparative advantage it possesses. This voluntary aspect is important
because it has fundamental implications, this is done if each party benefits and no party feels disadvantaged. The
motive for exchange is the benefits of trading (gains from trade). Krugman & Obsfeld (2010), assume an
economies of scale model with the utility function Constant Elasticity of Substitution (CES). The conclusion is that
if there are economies of scale in a production, then the country will be locked in a pattern of trade that is quite
3http://ajsss.julypress.com Asian Journal of Social Science Studies Vol. 6, No. 1; 2021
detrimental. But, trade remains profitable in general because it is possible for companies to make substantial cost
savings and be more efficient, so that there will be an increase in the various brands available and will sharpen
competition between companies.
In 1998 until 2009 investment had no influence on the economic growth of the South Korean country, whereas for
the human model, employment and exports had a positive effect. The interaction effect of FDI human capital and
export FDI shows that the transfer of high technology and knowledge has a negative impact on South Korea's
economic growth. The relationship between Foreign Direct Investment (FDI) and economic growth has been a
matter of interest for decades. In the new growth theory, FDI is an important factor that contributes to economic
growth through technology to improve transfer efficiency (Koojaroenprasit, 2012).
FDI is an investment made by one country to another, both in the short term or long term. Technological progress
is one of the impacts of FDI in both developing and developed countries, so that it will increase goods and services
produced by a country, which will then improve the country's economy (Fredirica & Juwita, 2013). Factors that
influence the entry of FDI into a country are, economic growth, political risk and macroeconomic variables
(Kurniati, et al, 2007).
FDI is an international capital flow where companies from one country establishes or expands their companies in
other countries (Krugman & Obsteld, 2000). Foreign direct investment (FDI) is seen as a fundamental part of an
open and successful international economic system and the main mechanism for development. In this regard,
Kurtishi & Kastrati, examines the benefits of FDI as a key component for successful and sustainable economic
growth and also as part of methods for social improvement. Through FDI it makes a significant and extraordinary
impact on the economic development of the host countries. At the same time. For example, it is important to
recognize that, like all things, FDI is not all good or bad. A separate discussion is devoted to the negative impact of
FDI flows in the host country (Kurtishi & Kastrati, 2013).
FDI is seen as a competitive resource through its characteristics as a flow of capital that also provides technology
and knowledge transfer from country to other countries. Through the same channel, foreign investment has a
positive impact on economic growth. For this reason, efforts to attract FDI must be quite large (Popovinci & Calin,
2015). But some literature also shows that competitiveness is a determining factor for foreign investors. Because
competitiveness is associated with high standards of living, value added, cost reduction, quality standards,
improvement, efficiency and immediate. Competitiveness is seen as the superiority of a country's location, as
explained by the OLI paradigm.
Inflation occurs because a society wants to live beyond the limits of its economic capacity, this is based on
macroeconomic theory (Manulang, 1993). This condition is marked by the people's demand for goods exceeding
the amount of goods available, giving rise to an "inflationary gap". As long as the inflationary gap persists, the
inflation process will continue (Deliarnov, 2007). This book was written as a reaction to the great depression that
occurred in the 30s that could not be solved by classical and neo-classical methods. Keynes disagreed with the
view of the quantity theory that an increase in the amount of money in circulation would lead to an increase in the
price level, and that changes in the amount of money in circulation would not lead to an increase in national income.
Furthermore Keynes argues that the increase in price is not only determined by an increase in the amount of money
in circulation, but is also determined by an increase in production costs. Inflation will occur because people want to
live beyond the means of their income (economic activity). The occurrence of inflation through the process, there
is a group of people who want to compete for national income that is greater than the ability of this group to obtain
national income (monopolistic power, demands for increased wages by workers).
Economic growth of ASEA-6 countries, suggests that on the other hand, inflation can be categorized as one of the
factors that can hamper a country's economic growth. Inflation itself is one of the macroeconomic indicators used
to measure the stability of a country's economy. In an economic perspective, inflation is a monetary phenomenon
in a country where ups and downs of inflation tend to cause economic turmoil (Aprilia & Hariyanti, 2014).
High or low inflation will have an impact on a country's exports and imports, especially on the country's
competitiveness. Some factors that hamper the competitiveness of the Indonesian state are, for example, inflation,
corruption, inefficient government bureaucracy, inadequate infrastructure and access to finance (Raimanu, 2016).
In addition to inflation having an impact on competitiveness, inflation also has an impact on FDI or a country's
investment. Competitiveness has a positive and significant effect on investment in Kenya. However, inflation was
found to have a non-significant effect on FDI. Unique Contribution to Policy. There is a need for favorable interest
rates, desirable exchange rates and economic liberalization by carrying out a comprehensive program for trade
reform, designed to open the economy and increase its competitiveness. The Kenyan government to compete with
4http://ajsss.julypress.com Asian Journal of Social Science Studies Vol. 6, No. 1; 2021 other countries must encourage freedom of capital transactions with foreigners and competition in the domestic market (Musyoka & Ocharo, 2018). Trade between countries where each country has its own exchange means requires a comparison of the value of a currency with other currencies, called a foreign exchange rate or exchange rate. Foreign exchange rates will change according to changes in foreign exchange demand and supply. A currency is said to be "strong" if an autonomous credit transaction is greater than an autonomous debit transaction (surplus of the balance of payments), on the contrary it is said to be weak if the balance of payments has a deficit, or it can be said if the demand for foreign currencies exceeds the supply of foreign currencies. Foreign exchange rates or foreign exchange are prices of foreign currencies in domestic currency units. Currency exchange rates will encourage investors not to invest their funds in the capital market but on transactions in the foreign exchange market. Exchange rate is the amount or price of the domestic currency from foreign (foreign) currencies (Solvatore, 2008). There are several factors causing the ups and downs of the value of money according to, namely; the amount of money is also called the supply of money, the rapid circulation of money demanded also the number of requests for money and the amount of goods traded (Manulang, 1993). The exchange rate that rises drastically out of control will cause difficulties in the business world in planning its business, especially for those who bring in raw materials from horror or sell their goods to the export market, therefore managing a relatively stable currency value is one of the monetary factors that support the macro economy (Samuelson & Nordhaus, 2014). 3. Research Methodology The type of data used in this study is secondary data in the form of panel data (pooled data) with a combination of cross section data and time series data, namely ASEAN-5 data, namely Indonesia, Malaysia, Singapore, Thailand and the Philippines with time series series) 21 years from 1997 - 2017. Because of the limited competitiveness score data in 1998-1999, this study uses interpolation. In the case of time series data used are ASEAN 5 competitiveness score data obtained from the Global Competitiveness Report, labor productivity per Person (US $ Productivity Converted to 2016 Price Level With Updated 2011 PPPs) 2016 data, data FDI (Foreign Direct Investments) Inflows Into ASEAN by Host Country (dollar) ASEAN 5, Inflation data (%) ASEAN 5 obtained from the ASEAN Statistical Yearbook, exchange rate data per dollar of ASEAN 5 countries in the form of a country's currency obtained from ASEAN Statistical Yearbook and intra net exports in the form of dollars (Intra ASEAN Exports by Country - Intra net Imports by Country = Intra net Exports) ASEAN 5, data obtained from the Asean Statistical Yearbook. This research was conducted in ASEAN-5 (Indonesia, Malaysia, Singapore, Thailand and the Philippines), because by the five countries ASEAN was formed and several agreements were agreed, particularly in the economic field, researchers' assumptions that the five countries had had an impact, both positive and negative. While the time used by researchers is two periods, namely the ASEAN internal crisis period in 1997-2008 and the ASEAN external crisis period in 2008-2017, with the first assumption that it is easy to get data on ASEAN-5 in that period. Secondly, during the internal crisis of ASEAN, particularly ASEAN-5, it tends that several ASEAN-5 countries have not been able and not ready for the crisis both fundamentally and economically as well as institutional readiness, so that it is easy to experience a crisis and easily impact on other ASEAN-5 members. Thirdly, during the ASEAN external crisis, ASEAN-5 member countries are better prepared and easier to deal with the impact of the global crisis, because from the institutional and economic fundamentals of the ASEAN 5 member countries the economy is better than during the internal crisis. That is why the researchers assume that the ASEAN crisis period and the aftermath of the ASEAN internal crisis had a different impact on the economies of ASEAN-5 members. 4. Results and Discussion 4.1 Labor Productivity and ASEAN-5 Competitiveness 4.1.1 Labor Productivity and ASEAN-5 Competitiveness Period 1997-2008 From the test results above show that the t-workforce productivity results labor productivity amounted to 6.353660> 2.305625 ttable, with a probability value of 0.0000
http://ajsss.julypress.com                              Asian Journal of Social Science Studies                                                   Vol. 6, No. 1; 2021

there is a weak relationship between increased productivity and economic growth in the pre-crisis period and the
first phase of the post-crisis period. However, increased productivity during the crisis is a significant driver of
economic competitiveness after a certain period of time. Referring to the analysis of the latest industrial
developments in terms of employment, wages, productivity, and work time, this note states that promoting better
working conditions can help countries boost competitiveness by attracting higher quality labor and by increasing
workforce productivity (International Labor Organizatiaon, 2010).
The strong economic performance in the ASEAN-5 region in 2007 had a positive impact on the labor market. The
labor market in ASEAN countries increased from 260.6 million in 2006 to 268.5 million in 2007, an increase of 3
percent, or 7.9 million jobs. The largest employment growth in Singapore (6.6 percent) and Indonesia (4.7 percent).
The Philippines also experienced high employment growth of 2.4 percent. 72 percent of employment growth in the
region in ASEAN-5 in 2007 occurred in industry and services. This played a role in raising regional productivity
levels by 3 percent because labor productivity was higher in both industry and services than in agriculture.
However, agriculture still accounts for 44.5 percent of ASEAN's total employment (International Labor
Organization Regional Office for Asia and the Pacific, 2008).

                        300,000

                        250,000

                        200,000
             US$

                        150,000

                        100,000

                         50,000

                              0
                                   1997      1998      1999      2000      2001          2002      2003      2004      2005      2006      2007       2008
                   Indonesia      16,442    14,123    13,988    14,449    14,817        15,346    15,885    16,533    17,459    18,154    18,471     19,376
                   Malaysia       47,313    43,646    45,056    46,640    46,327        47,797    48,677    51,216    53,433    55,234    57,341     59,522
                   Philippines    12,143    11,955    11,833    12,480    12,101        12,184    12,573    13,007    13,331    13,877    14,362     14,654
                   Singapore      102,255   97,266    103,654   108,470   103,775       109,698   115,963   124,950   128,658   131,383   131,923    122,383
                   Thailand       18,102    17,266    18,112    18,451    18,901        19,794    21,162    22,044    22,901    24,065    24,853     24,795
                   ASEAN-5        196,256   184,256   192,643   200,490   195,922       204,819   214,261   227,749   235,783   242,714   246,950    240,731

 Figure 1. Labor Productivity Per Person, 1997-2008 US$ (Converted To 2017 Price Level With Updated 2011
                                                    Ppps)
Source: The Conference Board, Data Economy Database, 2019

From the picture above it is clear that the labor productivity of ASEAN-5 countries, Singapore always excites, and
ranked second are Malaysia, Thailand, Indonesia and the Philippines or labor productivity contribution in that
period Singapore at 53.4%, Malaysia at 23.32%, Thailand 9.7%, Indonesia 7.5% and the Philippines 5.8%.
Unemployment in Indonesia fell sharply from 10.3 percent in 2006 to 9.1 percent in 2007. In the Philippines it
dropped from 7.3 percent to 6.3 percent. In 2007, the number of unemployed young people fell 5.4 percent, or
around 530,000 people, representing 97 percent of the decline in the total unemployment rate in ASEAN. As a
result, the youth unemployment rate that is very high in the region decreased from 17.2 percent in 2006 to 16
percent in 2007. But unemployment for youth is highest in Malaysia, the Philippines and especially in Indonesia.
Productivity growth is one of the main determinants of the country's overall competitiveness. It is also important to
create quality jobs and reduce poverty. Increased labor productivity can lead to higher wages, better working
conditions, and more investment in human resources.
The countries experiencing the fastest labor force growth include the Philippines, Indonesia. Employment in
ASEAN Member Countries increased from 260.6 million in 2006 to 268.5 million in 2007 - an increase of 3
percent, or 7.9 million additional jobs. Employment growth was very strong in Indonesia (4.7 percent), Malaysia
(2.6 percent), Singapore (2.5 percent among the population, with a much higher rate of 6.6 percent when
non-residents were included) and Philippines (2.4 percent) (International Labor Organization Regional Office for
Asia and the Pacific, 2008).
Strong employment growth in ASEAN Member States is a welcome development, the performance of the labor
market in this region cannot be judged solely on the basis of job creation. The shifting composition of job growth
shows movement towards more productive employment in the region, reflected in increased productivity and

                                                                                    6
http://ajsss.julypress.com Asian Journal of Social Science Studies Vol. 6, No. 1; 2021 increased competitiveness. In 2007, employment in industry and services increased by 5.1 percent and 3.3 percent respectively, while employment growth in agriculture was only 1.9 percent. As a result, 72 percent of employment growth in the region occurred in industry and services and played a role in raising regional productivity levels by 3 percent (labor productivity was higher both in industry and services than in agriculture). However, agriculture still accounts for 44.5 percent of ASEAN's total employment, despite considerable variations in various countries, ranging from less than 1 percent in Singapore to more than 80 percent in the Lao People's Democratic Republic (International Labor Organization Regional Office for Asia and the Pacific, 2008). 4.1.2 Labor Productivity and ASEAN-5 Competitiveness Period 2008-2017 From the test results above show that the t-workforce productivity results are 17.44247> 2.320711 t-table, with a probability value of 0.0000
http://ajsss.julypress.com                       Asian Journal of Social Science Studies            Vol. 6, No. 1; 2021

                             250000.0
                                                                                                 INDONESIA
                             200000.0

             (US$ Million)
                                                                                                 MALAYSIA
                             150000.0
                                                                                                 PHILIPINA
                             100000.0
                              50000.0                                                            SINGAPURA

                                    -                                                            THAILAND
                                                                                                 ASEAN-5

                                        Figure 2. Inter-ASEAN-5 Exports by Country 1997-2008
Source: ASEAN Trade Statistics Database, 2010

Intra-ASEAN-5 exports during the 1997-2008 internal crisis experienced a significant increase where in 2008
intra-ASEAN-5 exports amounted to US $ 225,618.2 billion from US $ 84,855.3 billion in 1997, meaning that an
increase in ASEAN exports -5 very large contribution to the overall economic growth of ASEAN. The biggest
contribution of ASEAN-5 countries to intra-exports is Singapore, although in the whole year ASEAN-5 member
countries experienced a decrease in intra-ASEAN exports, namely in 1997 - 1999. Indonesia during the last 10
years experienced the highest economic growth of ASEAN-5 member countries, but intra ASEAN-5 export value
is still less than Singapore, the high economic growth of Indonesia from several other countries is caused by
domestic factors that can support Indonesia's economic growth, besides that (Roberth, 2017).
During the ASEAN internal crisis, namely in 1997-2008 Singapore was an ASEAN-5 member country with the
highest contribution of Intra ASEAN-5 exports, where in that period Singapore's contribution was 44%, followed
by Malaysia by 24%, Thailand by 16%, Indonesia by 11% and the lowest contribution was the Philippines, namely
by 5%. Judging from the level of growth, in general the annual growth of exports of countries in the ASEAN
region to the world in question reached 8.59 percent per year. Nevertheless, this achievement was passed with
fluctuations that occurred in line with global economic conditions throughout the period. The economic crisis
experienced in 1998 and 2009 had caused a contraction and slowdown, but there was also a commodity boom that
had an impact on double digit growth which occurred in 2004-2008, (Asean Economic Community Impact Report
on the Industrial and Service Sectors, and Labor in Indonesia, 2014).
During the internal crisis period, Singapore not only dominated intra-ASEAN-5 exports but also Intra-ASEAN-5
Import, where Singapore's intra-ASEAN-5 import contribution in 1997-2008 was 42%, followed by large
Malaysia 22%, Thailand by 15%, Indonesia was 13% and the lowest was the Philippines, which was 8%.
4.2.2 Net Exports and ASEAN-5 Competitiveness Period 2008-2017
From the test results above show that the Net Export t-test results are equal to -1.358523  0.05 so that it can be concluded that the net export variable has a negative and not
significant effect on ranking of competitiveness in ASEAN-5 countries.
The value of Intra-ASEAN exports only has a significant positive effect on the GDP value of ASEAN-5 countries
(Roberth et al, 2017). With the existence of export activities in a country, the country can gain profits by exporting
and also gain profits by importing (Aprilia & Hariyanti, 2014). Exports that have competitiveness in ASEAN-5
countries in particular are the coffee trade export sector having more daytime power to Vietnam than Indonesia to
ASEAN-5 member countries (Zuhdi & Suharno, 2015).
Widodo et al (2017) research found that the comparative advantage comparison (some Asian countries) is as
follows: primary products (Indonesia, Thailand and China); SDA solid products (China, Thailand and Indonesia);
capital-intensive products of HR (China, Japan and Thailand); solid products of unskilled labor (China, Indonesia
and Thailand); and technology-intensive products (Japan, Korea, Singapore and China). When compared with
China, Indonesia, Malaysia, Singapore and Thailand are behind in manufacturing products. ASEAN countries are
only superior in agricultural products and primary products. The findings of Voon & Yue (2013), confirm that the
superiority of China's industrial structure and export growth are caused by the sub-regional production synergy,
namely the entry of Hong Kong investment in China, so that ASEAN and China no longer compete with each other
in the same product.

                                                                   8
http://ajsss.julypress.com Asian Journal of Social Science Studies Vol. 6, No. 1; 2021
As the findings of Rani et al (2014), between Indonesia, Malaysia and Singapore. For example Johor (Malaysia)
has land and moderate wage labor, Singapore has a well-developed infrastructure and a high skilled workforce,
while Riau (Indonesia) excels in land and low-wage labor. ASEAN-4 is not so high in level of competition because
each has a different source of comparative advantage, so each country specializes in certain product groups. The
flying-geese pattern is seen between ASEAN-4 countries where Singapore is the leader in technology-intensive
products. Indonesia is a leader for primary products, natural resource-intensive products and unskilled
TK-intensive products, while Thailand is leading in capital-intensive human capital products, (Jayadi & Azis,
2016). This finding supports Kwan's research (2012) that Singapore has almost the same degree as Korea, Hong
Kong, and Taiwan.
4.3 ASEAN-5 Inflation and Competitiveness
4.3.1 Inflation and Competitiveness of ASEAN-5 Period 1997-2008
From the test results above show that the inflation t-test results are 0.216269 0.05 so it can be concluded that the inflation variable has a positive and not significant effect on
competitiveness in ASEAN-5 countries.
High inflation rate is often associated with a country's economic conditions that are hot (overhead), meaning that if
the economic conditions of a country experiencing demand for products that exceed the benchmark or capacity
provided or product supply capacity, then prices tend to rise. High inflation will result in a decrease in the
purchasing power of public money (purchasing power of money). In addition, high inflation will reduce the
income earned by investors or entrepreneurs, (Kewal, 2012).
The economic crisis experienced by ASEAN in 1997 as a result of the contagion effect of the financial crisis in
Thailand has caused sharp exchange rate volatility, increased inflation and decreased economic growth. This is the
reason for the formation of financial sector cooperation in ASEAN.
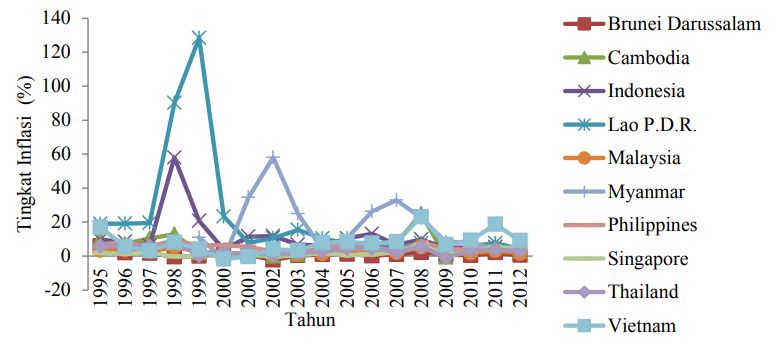
Figure 3. ASEAN Member Country Inflation Rates 1995-2012 (%)
Source: IMF Economic Outlook, 2019
In 2008, most ASEAN-5 member countries experienced an increase in the rate of inflation, except for the country
of Myanmar which experienced an increase in the rate of inflation the previous year. Some of the factors why the
increase occurred in ASEAN-5 member countries, namely in 2008 there was a world financial crisis or the
so-called global crisis 2008. The crisis that occurred in 1997 was different from the 2008 global crisis, because
ASEAN's internal crisis only affected members ASEAN alone, but this global crisis has quite a broad impact, even
to Europe and parts of Asia, especially impacting on developing countries such as Malaysia, Thailand, Indonesia,
China, even developed countries experiencing inflation increases such as Japan and Singapore which are famous
for their competitiveness , the global crisis in 2008 and pushed most of the developing and developed countries to
occur inflation due to rising global commodity prices, especially crude oil and food that is quite high, (Sari, 2010).
The picture above shows that the fluctuations in inflation rates were high in ASEAN in 1998 to 1999 due to the
crisis. Based on European experience, macroeconomic fundamentals become an important foundation in the
formation of an economic and monetary integration. Strong economic fundamentals are high economic growth,
controlled inflation, relatively low unemployment rates, the overall balance of payments is still a surplus even
though the current account deficit tends to grow but the amount is still under control, foreign exchange reserves are
still quite large, the realization of the government budget still shows a small surplus.
9http://ajsss.julypress.com Asian Journal of Social Science Studies Vol. 6, No. 1; 2021
Economic conditions in the ASEAN region tend to be uneven, there are still imbalances in Gross Domestic
Product (GDP) growth and inflation fluctuations that are still sensitive to world economic conditions. Disparity of
income levels in ASEAN that will be diverse will make the step of more intensive integration is not easy. Of the
Southeast Asian countries affected by the crisis, almost all experienced a surge in inflation that was quite high.
Indonesia ranks third in Southeast Asia in terms of high inflation. In 1998, Indonesia's inflation rate reached 77.6
percent, rising sharply from 11.03 percent in 1997. Indonesia's inflation began to stabilize in 2000 with an inflation
rate of 9.4 percent and 2001 with a rate of 12.6 percent. Singapore is an ASEAN-5 member country that is most
able to withstand inflationary turmoil. In 1997, the inflation rate in Singapore was recorded at 2.02 percent,
increasing from 1.38 percent in 1996, (https://tirto.id/csSK).
4.3.2 Inflation and Competitiveness of ASEAN-5 Period 2008-2017
From the test results above show that the inflation t-test is -0.193670 0.05 so it can be concluded that the inflation variable has a negative effect and is not significant to the
power rating competitiveness in ASEAN-5 countries.ASEAN-China free market since its entry into force in 2010,
is expected to reduce the country's inflation rate in a relatively long period of time, some determining factors
include relatively cheap imported goods and absorbed in large enough quantities so that the price value drops and
suppresses inflation, so other structural disturbances such as changes in the prices of goods and services that have
a war in achieving the Consumer Price Index (CPI), (Sari, 2010).
Inflation and the exchange rate on exports and other results indicate that the inflation variable is partially only
significantly positive in the Philippines and has no effect on Indonesia, Singapore, Malaysia and Thailand,
(Anshari, 2017). In 2010 the inflation rate in Indonesia was above 5%, while the inflation rates in Malaysia,
Thailand and the Philippines were between 2-3%, where the prices of domestic goods in Indonesia were so
expensive and inefficient in producing goods and services, (Zulkarnaen et al , 2015).
Inflation has a big influence on a country's economic growth and is an obstacle to economic growth and causes a
decline in the country's GDP growth, because it can reduce the country's production of goods and services due to
the GDP (Aprilian & Hariyanti, 2014).
4.4 ASEAN-5 Investment and Competitiveness
4.4.1 Investment and Competitiveness of ASEAN-5 Period 1997-2008
From the test results above indicate that the t-investment results are equal to -1.009997 0.05 so that it can be concluded that the investment variable has a negative effect and
is not significant on competitiveness in ASEAN-5 countries.
Based on UNCTAD data in Nicita (2013), it was recorded to have increased more than 10 times compared to 1992,
from 12.7 billion USD (1992) to 132.8 billion USD. When viewed from its share, FDI flows to ASEAN reached
10.8 percent of total global FDI flows, higher than 1970's 3.5 percent. The increase in FDI flows to ASEAN was
partly due to ASEAN being one of the regions offering the highest return on investment (ROI) (Soekro & Widodo,
2015).
160,000.00
140,000.00
120,000.00
US$ million)
100,000.00
80,000.00
60,000.00
40,000.00
20,000.00
0.00 1997 1998 1999 2000 2001 2002 2003 2004 2005 2006 2007 2008
BCLMV/SELISIS 4423.20 3244.80 2819.60 2228.40 2192.0 2597.30 4967.80 2221.50 2954.20 3931.90 8904.80 11836.70
ASEAN 34,082.2 22959.80 27,374.8 23,541.3 20,672.4 18,022.6 24,234.7 35,341.9 40,713.6 56,354.9 74,395.3 49,499.8
ASEAN-5 29,659.0 19715.0 24,555.2 21,312.9 18,480.4 15,425.3 19,266.9 33,120.4 37,759.4 52,423.0 65,490.5 37,663.1
Figure 4. Foreign Direct Investments Inflows into ASEAN by Host Country, 1997-2008
Source : ASEAN Statistical Yearbook 2010
10http://ajsss.julypress.com Asian Journal of Social Science Studies Vol. 6, No. 1; 2021
It is clear that the difference between FDI inflow into ASEAN-5 and ASEAN is not very significant, meaning that
in 1997-2008 most of the FDI inflow into ASEAN entered ASEAN-5 member countries. The lowest FDI Inflow of
ASEAN-5 in 2002 was 15,425.3 US $ Milli and the largest FDI inflow of ASEAN-5 in 2007 was 65,490.5 US
$ Million from 74,395.3 US $ Million in all ASEAN countries. Most of the FDI Inflow is entered into ASEAN-5
members, the largest is Singapore, Thailand, Indonesia, Malaysia and Philpina, or from 1997 to 2008 FDI Inflow
entered ASEAN-5 member countries by 87% of ASEAN FDI inflow. Some of the factors why investment is
coming into ASEAN member countries, one of which is the ease of investment. ASEAN experienced ups and
downs in terms of being the main goal of world FDI. In the period 1987 to before the Asian crisis, ASEAN had a
fairly large share, but after the crisis, ASEAN collapsed. After 2008 ASEAN again became the belle of foreign
investment (Soekro & Widodo, 2015).
Previous economic downturns such as the Asian financial crisis in 1997-1998 and the global economic crisis in
2007-2008 have revealed that there has been a large decline in the total FDI inflows to most ASEAN-5 countries,
(Ridzuan, et al, 2018). During the first year of the Asian financial crisis in 1997, Malaysia recorded a large amount
of FDI inflows of US $ 5,136.51 million. Unfortunately, it dropped to US $ 2,163.40 million during the height of
the Asian crisis in 1998. This shows a 58% decline from 1997 to 1998. In the case of Thailand and the Philippines,
both recorded a 46% decrease between 1997 and 1998, respectively . Indonesia recorded a more serious fall in FDI
flows. In 1996, the amount of FDI inflows was reported to be worth US $ 6194 million.
However, in 1997, the amount of foreign investment decreased to US $ 4677 million, which was a decrease of
almost 24% from the amount collected in 1996. In 1998, the amount of FDI inflows was reported to be negative at
-US $ 240 million. Singapore experienced the worst implications of the Asian financial crisis in terms of foreign
investment. Total FDI inflows have declined by almost half from US $ 13,752 million in 1997 to only US
$ 7,323.86 million in 1998. Again, during the global recession in 2007-2009, Singapore lost the highest amount of
foreign investment from US $ 47733 , 20 million in 2007 to US $ 12200.70 million in 2008. A moderate decline in
total FDI inflows was detected for other ASEAN-5 countries except for Indonesia, where total FDI flows only
began to decrease in 2009 ( Ridzuan, et al, 2018).
Most ASEAN-5 countries are vulnerable to global economic conditions such as the financial crisis, and this will be
a problem because maintaining FDI inflows is an important criterion for SD (Sustainable Development) goals as
stated by UNCTAD. As such, there is a need to investigate macroeconomic determinants for FDI inflows in
ASEAN-5 countries to ensure the sustainability of FDI inflows to these countries. Determinants were established
(Ridzuan, et al, 2018).
4.4.2 Investment and ASEAN-5 Competitiveness Period 2008-2017
From the test results above show that the t-investment result is 0.207156 0.05 so it can be concluded that the investment variable has a positive and not significant effect
on competitiveness in ASEAN-5 countries.
The stimulus for economic growth is investment, the higher the amount of incoming investment will open up
opportunities for higher economic growth and will improve the welfare of the people, FDI infow in ASEAN is
quite high and this shows that the Southeast Asian region as one of the centers of world economic growth, only the
spread of FDI in ASEAN it is not evenly dominated by only a few countries, such as Singapore, Indonesia,
Thailand and Malaysia (Farhan, 2016). The level of competitiveness in general will encourage FDI in and out. In
addition, a country has a stronger positive effect on FDI. Further investigation shows that the investment effect is
very strong in countries at a later stage of development. The findings of this paper show that the future work
orientation is productivity is a determining factor for national competitiveness and FDI (Dunning & Zhang, 2017).
Figure 5. Ease of Doing Business Ranking in ASEAN Member Countries and China
Source:World Bank, 2019 diolah
11http://ajsss.julypress.com Asian Journal of Social Science Studies Vol. 6, No. 1; 2021
Based on the 2015 Ease of Doing Business compiled by the World Bank, a survey to see the ease of doing business
in each country shows that Indonesia is in a position below Singapore, Malaysia, Thailand, Brunei Darussalam,
Vietnam, and the Philippines. In aggregate, Indonesia is ranked 109 out of 189 countries surveyed. Three
ASEAN-5 countries ranked in the top 30, namely Singapore (ranked 1), Malaysia (ranked 18), and Thailand
(ranked 49). In fact, Vietnam which is not ASEAN-5 ranks 90th, far above Indonesia (Soekro & Widodo, 2015).
4.5 ASEAN-5 Exchange Rate and Competitiveness
4.5.1 ASEAN-5 Exchange Rates and Competitiveness Period 1997-2008
From the test results above shows that the results of the t-exchange rate is equal to -1,143411 0.05 so it can be concluded that the exchange rate variable has a negative effect
and is not significant on competitiveness in ASEAN-5 countries.The strengthening value of the country's currency
due to one of the factors is the increase in confidence in the country's trade balance. Changes in exchange rates can
change the relative price of products to be more expensive or cheaper relative to products of other countries, so that
the exchange rate is sometimes used as a tool to increase competitiveness (encourage exports) (Zuhro & Kaluge,
2017). In addition, in the long run, depreciation in the value of a currency will have an impact on improving the
balance of trade transactions through increased international competitiveness resulting in an increase in the value
of exports. In addition, depreciation will have an impact on the value of imports of a country, because the diversion
of population expenditure and increase aggregate demand by foreign residents of the domestic population will
increase exports (Zuhro & Kaluge, 2017).
The domino effect is one of the causes of the crisis that struck in several Asian countries, especially in the
ASEAN-5 member countries from 1997 to 2008. The depreciation of the Bath Thailand exchange rate resulted in
Indonesia, Singapore, Malaysia and the Philippines feeling the impact, namely the decline in economic growth
simultaneously. In 1998, Indonesia experienced the lowest economic growth decline of -13.1%, while Thailand as
the cause of the crisis was only -10.5%, followed by Malaysia -7.4%, Singapore -2.2%, and the Philippines -0, 6%.
Similar to the 1997 crisis, the 2008 crisis also had a negative impact on economic growth in five ASEAN countries
but not as large as before. Although only 3 of the 5 countries experienced economic growth of less than zero, but 2
other countries also experienced a decline in economic growth. The three countries are Thailand -2.3%, Malaysia
-1.5%, and Singapore -0.6%, while Indonesia and the Philippines are 4.7% and 1.1% respectively (Sulaeman &
Lisna, 2017). For more details, the exchange rates of ASEAN-5 member countries can be seen in the figure below:
12000
10000 10014 10261 9830
9311 9705 9159
9141
8000 8422 8577 8939
7855
6000
4000
2909
2000
0
1997 1998 1999 2000 2001 2002 2003 2004 2005 2006 2007 2008
Figure 6. Rupiah Exchange Rate Against US Dollar
Source: ASEAN Statistical Yearbook, 2019
Depreciation of the value of the rupiah against the dollar began in 1997, which was during the crisis of some
ASEAN countries, where the Indonesian currency, the rupiah experienced a depreciation of Rp. 10,014 per US
dollar from Rp. 2,909 per US dollar, repairs occurred again in 1999 which is Rp. 7,855, and in the following year
until 2008 the value of the rupiha currency relative to the dollar depreciated relatively much and in 2001 the value
of Indonesia's currency was the highest in 2001 which was Rp. 10,261 per US dollar.
Differences in conditions during the 1997-2008 crisis indicate differences in the characteristics of the 1997 crisis
and the 2008 crisis. The impact of the crisis that occurred in several ASEAN-5 member countries, although it
affected only a few ASEAN countries, the depreciation did not really affect Singapore. The depreciation of the
12http://ajsss.julypress.com Asian Journal of Social Science Studies Vol. 6, No. 1; 2021
value of the Singapore currency against the US dollar in 1998 was 2.2%. But in the same year due to the impact of
the crisis Singapore's economic growth amounted to -0.6%. According to Alamsyah (2012), in the 1997 crisis the
movement of Indonesian stocks and exchange rates was influenced by Thailand and the movement of sahama and
exchange rates during the 2008 crisis was influenced by Singapore.
The financial crisis that occurred in the ASEAN region in 1997/1998 reduced the credibility of the unilateral fixed
exchange rate system in ASEAN countries and opened up greater opportunities for monetary integration with the
aim of increasing regional exchange rate stability (Kusuma et al, 2013).
4.5.2 ASEAN-5 Exchange Rate and Competitiveness Period 2008-2017
From the test results above show that the results of the t-exchange rate is -0.681493 0.05 so it can be concluded that the exchange rate variable has a negative effect and is
not significant to the power rating competitiveness in ASEAN-5 countries.
The exchange rate position of several countries such as the Philippine Peso, Colombian Peso, Brazilian Real,
Malaysian Ringgit and Indonesian Rupiah weakened in the second quarter of 2017 against the USD mainly due to
the increase in US interest rates in June 2017. Geopolitical turmoil in the United States and fears of Chinese
economic stability also pushed the strengthening of the USD against the currencies of several countries, while the
Singapore Dollar and the Thai Baht strengthened against the USD in the second quarter of 2017. The Singapore
Dollar also strengthened against the USD in mid-June 2017 due to market reaction to the announcement of the
statement The Fed against overnight reverse repurchase operations (ON RRPs) in June 2017 (Bapennas, 2017).
A stable exchange rate is important for investors to be able to calculate precisely the production costs that may
occur during the production process, as well as the hope of recovering the investment that has been spent along
with the profit generated. This is important especially for investors who aim to export products produced (Roberth
et al, 2017). Increased investment will reduce the supply of domestic exchange rates, which are invested abroad, so
that the exchange rate balance will increase and the exchange rate will be appreciated, and there will be an increase
in the prices of domestic goods against foreign goods and net exports going down so that trade balance will be
negative (Zulkarnaen et al, 2012).
The exchange rate that rises drastically out of control will cause difficulties in the business world in planning its
business, especially for those who bring in raw materials from horror or sell their goods to the export market,
therefore managing a relatively stable currency value is one of the monetary factors that support the macro
economy (Samuelson & Nordhaus, 2014).
Exchange rate rigidity is often cited as one of the main causes of the Asian crisis. However, measured by real
effective exchange rates (exchange rates adjusted for trade and trade weighted) using consumer prices or
wholesale prices, no over-valuation was detected in the countries hardest hit during the pre-crisis period. Most
developing economies in Asia allow their currencies to deviate from the strict benchmark of the dollar in the
medium to long term to offset the inflation gap and major currency movements. Counterfactual simulations during
the pre-crisis period show that, to stabilize competitiveness, the correct inflation adjustment by each economy is
more important than the choice of currency weights. The adoption of a common currency basket in this region does
not add much stability. Pragmatic exchange rate policy rules that distinguish normal periods and crises are
suggested. To stabilize competitiveness during normal periods, there is no need for radical reform of existing
systems in developing Asian countries (Ohno, 2012).
5. Conclusion
Labor productivity in the period 1997-2008 had a positive and significant effect on the competitiveness of
ASEAN-5, meaning that an increase in labor productivity increased ASEAN-5's competitiveness. Likewise in the
period 2008-2019 where labor productivity had a positive and significant effect, meaning that an increase in labor
productivity in that period increased the competitiveness of ASEAN-5.
Net exports in the period 1997-2008 had a negative and insignificant influence on the competitiveness of
ASEAN-5, meaning that an increase in net exports in that period decreased the competitiveness of ASEAN-5.
Whereas in the period 2008-2017 net exports had a negative and not significant effect on the competitiveness of
ASEAN-5, meaning that an increase in net exports decreased the competitiveness of ASEAN-5.
Investment (FDI) in the 1997-2008 period has a negative and insignificant influence on the competitiveness of
ASEAN-5, meaning that an increase in investment in that period decreases the competitiveness of ASEAN-5.
Whereas for the period 2008-2017 investment had a positive and not significant effect on the daytime power of
ASEAN-5, meaning that an increase in investment in that period increased the competitiveness of ASEAN-5.
13http://ajsss.julypress.com Asian Journal of Social Science Studies Vol. 6, No. 1; 2021
Inflation in the 1997-2017 period had a positive and insignificant influence on the competitiveness of ASEAN-5,
meaning that an increase in inflation in that period increased the competitiveness of ASEAN-5. While inflation in
the 2008-2017 period had a negative and not significant effect on the competitiveness of ASEAN-5, meaning that
an increase in inflation in that period reduced the competitiveness of ASEAN-5.
Exchange rates in the 1997-2008 period had a negative and insignificant influence on the competitiveness of
ASEAN-5, meaning that in this period an increase in the exchange rate would reduce the competitiveness of
ASEAN-5. Likewise in the 2008-2017 period the effect was negative and insignificant on the competitiveness of
ASEAN-5, meaning that an increase in the exchange rate in that period decreased the competitiveness of
ASEAN-5.
References
Alamsyah. (2012). Analisis Pergerakan Bersama dan Contagion Effect Pasar Saham dan Pasar Valuta Asing:
Studi Kasus ASEAN-4 Khususnya Indonesia. Depok: Fakultas Ekonomi Universitas Indonesia.
Anshari, M. F., El Khilla, A., & Permata, I. R. (2017). Analisis Pengaruh Inflasi Dan Kurs Terhadap Ekspor Di
Negara Asean 5 Periode Tahun 2012-2016. Jurnal Info Artha, 1(2).
Aprilia, & Hariyanti, D. (2014). Determinasi Pertumbuhan Ekonomi di Negara ASEAN-6. Jurnal Ekonomi, 22(3).
Ark, B. V., Stuivenwold, E., & Ypma, G. (2005). Unit Labour Costs, Productivity and International
Competitiveness. Retrieved from https://www.researchgate.net/publication/4786932
ASEAN Statistical Yearbook. (2010).
ASEAN Statistical Yearbook. (2019).
ASEAN Trade Statistics Database. (2010).
Asian Productivity Organization. (2018). APO Productivity Databook.
Bank Indonesia. (2008). Bank Indonesia Bank Sentral Republik Indonesia: Sebuah Pengantar. Jakarta, Pusat
Pendidikan dan Kebansentralan (PPSK) BI.
Bapennas. (2017). Perkembangan Ekonomi Dunia, Perkembangan Perekonomian Indonesia dan Dunia Triwulan
II Tahun 2017.
Deliarnov. (2007). The General Theory of Employment, Interest, and Money. Perkembangan Pemikiran Ekonomi,
Jakarta: PT Raja Grafindo.
Deloitte. (2016). Global Manufacturing Competitiveness Index.
Dunning, J., & Zhang, F. (2017). Foreign Direct Investment and the Locational Competitiveness of Countries.
Retrieved from https://www.researchgate.net
Farhan, A. (2016). Perbandingan Daya Saing Indonesia Di antara Negara-Negara ASEAN. Retrieved from
https://www.researchange.net/publication295073980
Frederica, & Juwita, R. (2014). Pengaruh UMP, Ekspor, dan Kurs Dollar Terhadap Investasi Asing Langsung di
Indonesia Periode 2007-2012. STIE MDP, Jurusan Manajemen.
Fry, J., & Honnold, V. (2010). ASEAN: Regional Trends in Economic Integration, Export Competitiveness, and
Inbound Investment for Selected Industries. USITC Publication.
Goestjahjanti, F. S. (2016). Pengaruh Faktor Inti Nilai Tukar Dan Daya Saing Terhadap Term of Trade Serta
Dampaknya Kepada Daya Beli Masyarakat Indonesia. Jurnal Bisnis & Manajemen, 16(2).
International labor Organizatiaon. (2010). Wages and productivity in the garment sector in Asia and the Pacific
and the Arab States.
International Labour Organization Regional Office for Asia and the Pacific. (2008). Labour and Social Trends in
ASEAN 2008 Driving Competitiveness and Prosperity with Decent Work.
International Monetary Fund. (2018). ASEAN Progress Towards Sustainable Development Goals and the Role of
the IMF. ASEAN Leaders Gathering.
International Monetary Fund. (2019). The ASEAN Way Sustaining Growth and Stability.
Jayadi, A., & Azis, H. A. (2016). Peta Persaingan Produk Ekspor Indonesia, Malaysia, Singapura Dan Thailand.
Jurnal Ilmu Ekonomi Terapan, 1.
14You can also read