ANNEXURES: DRAFT NATIONAL SPATIAL DEVELOPMENT FRAMEWORK - SEPTEMBER 2018 7
←
→
Page content transcription
If your browser does not render page correctly, please read the page content below
ANNEXURES: DRAFT NATIONAL SPATIAL
        DEVELOPMENT FRAMEWORK
               SEPTEMBER 2018

7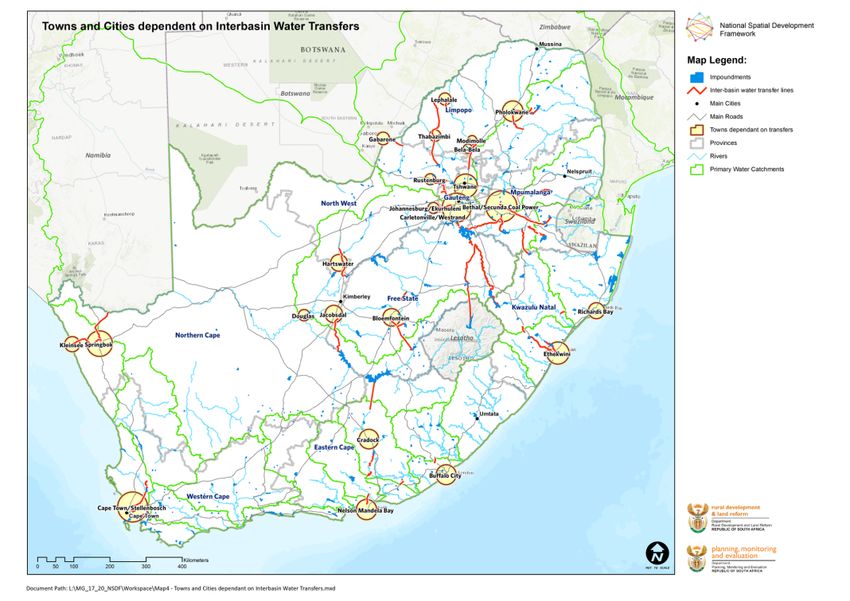
Spatial Description of National Environmental Management Areas .................. 25
Contents                                                                                                                 Spatial Illustration of Significant Inter-Basin Water Transfer Lines .................... 26

                                                                                                                       Additional Spatial Description of National Resource Risk Areas ............... 28
Annexure A: Supportive Information on Spatial Models ..................... 3
                                                                                                                       Significant plans, studies and sources that informed the spatial specific
  Regional Spatial Frame, Indicators and Settlement Pattern Model ........... 3                                        selection of frame elements ..................................................................... 29
                                                                                                                         National Urban and Settlement Network ......................................................... 29
  Population Projections and Spatial Location Modelling ............................. 5
                                                                                                                         National Movement and Connectivity Infrastructure........................................ 30
  Climate Change Projections ..................................................................... 13                    National Resource Regions and Ecological Infrastructure ................................. 31
     Overview of methodology ................................................................................ 13         Provincial Plans and Strategies......................................................................... 32
     Results and Implications ................................................................................... 13     Inter-regional , national and long term farmeworks ......................................... 33

Annexure B: Spatial Descriptions in Support of National Spatial
Development Framework .................................................................. 16
  Purpose and role of Spatial Frame Annexure ........................................... 16
  Spatial Descriptions of Settlements Type................................................. 16
     Significant Urban Regions and Cities ................................................................. 16
     National Network of Regional Development Anchors........................................ 16
     Regional networks of consolidated and well-connected rural service centres.... 20

  Spatial Description of Agricultural Heartland, Agri-Enterprise Regions and
  Eco-Resource Production Regions ............................................................ 20
     Agricultural Heartland Areas ............................................................................ 20
     Agri-Enterprise Resource Regions ..................................................................... 21
     Spatial Description of Eco-Resource Production and Livelihood Regions............ 23

  Spatial illustration of national significant energy infrastructure as part of
  national connectivity network ................................................................. 23
  Additional Spatial Descriptions of National Ecological Infrastructure
  Network ................................................................................................... 24
     Spatial Description of National Protect Areas.................................................... 24

                                                                                                                                                                                                                                  2
The GVA data for the different economic sectors are produced on
                                                                                   local municipal level by Quantec. The municipal level data is then
Annexure A: Supportive Information on                                              assigned to the mesozones using the principles of dasymetric
                                                                                   mapping where secondary data representing the potential points
Spatial Models                                                                     where production is occurring are used to re-assign the economic
                                                                                   production data to the mesozones. he total employment index per
This Annexure is not exhaustive and only provides limited information in           mesozone is derived from the GVA index discussed above.The way in
support of the NSDF 2018 report.                                                   which this was calculated was by firstly calculating the ratio of the of
                                                                                   GVA production per sector to the employment figure per sector for
Regional Spatial Frame, Indicators and Settlement                                  each local municipality. The employment and GVA data for the
                                                                                   different economic sectors are produced on a local municipal level
Pattern Model                                                                      by Quantec. This factor is then multiplied with the economic
                                                                                   production values per mesozone.
The Mesozone set is a demarcation of South Africa into a complete grid
of 25 000 spatial units. These mesozones are not uniform in shape but aims      Over the last couple of years, the CSIR, together with a number of other
to be approximately the same size (~50km2). These mesozones were                role players, has invested in building capability to provide spatial
created in such a way that they fit completely within the current               planning, analysis, modelling and platform support to government, with
municipalities and other significant geo-economic and historic area             a focus on strengthening strategic regional, inter-regional and
demarcations. The zone boundaries correspond with major travel barriers         intergovernmental planning, resource allocation and monitoring and
(such as rivers) as well as ‘break lines’ between sparsely populated areas      evaluation in South Africa.
(such as mountains) and areas with medium to high levels of human
activity (such as fertile valleys or built up areas).The various datasets are   In 2015 the updated CSIR/ SACN functional settlement typology was
assigned to mesozones based on an algorithm developed by the CSIR               published that provided a mechanism to identify, calculate and analyse
and which is based on the principles of dasymetric mapping. An                  a set of development information and trends pertaining to the range of
approach based on dasymetric mapping principles is used to calculate            towns and cities, as well as high density rural settlements across South
population distribution. The 1996 (EAs), 2001 (SPs), 2011 (SPs) and 2016        Africa. It enabled an understanding and analyses of the network of
(SPs) population figures are the input data for the respective years which      settlements, towns and cities and the hierarchical and functional
are then re-aligned to the mesozones to create a comparable time series         relationships between them, especially related to government and
data set. The Spot Building Count (SBC), ESKOM being the data                   economic service provision and migration. Given the fact that spatially
custodian, is used as the secondary dataset to predict the underlying           comparable administrative information covers wall-to-wall municipal
statistical service of the origin data.                                         jurisdiction areas, the functional town area demarcation and town
                                                                                profiling was used extensively as basis to describe and compare cities

                                                                                                                                                         3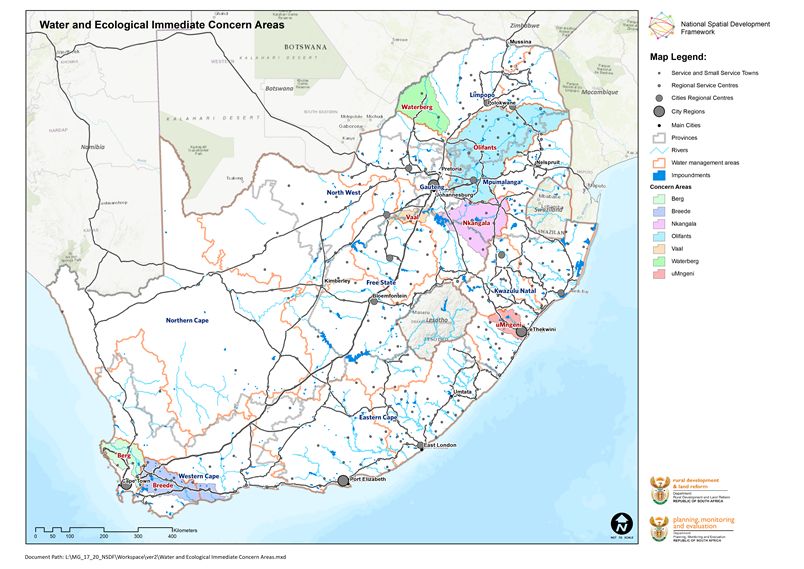
and towns across South Africa, as well as town growth trends in support          temporal and spatial comparison regardless of boundary area at
of government policy. This inter alia includes use within the Chapter 8 in       regional scale. For access to spatial frame, and socio-economic
the NDP, 2012; the IUDF, 2015, the SACN SOCR, 2016 and DRDLR Social              indicators, see http://stepsa.org/socio_econ.html#Indicator . For access to
Facility Toolkit, 2016.                                                          CSIR South Africa Functional Town Typology, see van Huyssteen, E. Green,
                                                                                 C. Sogoni, Z., Maritz, J. and McKelly, D. South African Functional Town Typology
In February 2018 CSIR made available an update and rework of the
                                                                                 (CSIR 2018 v2). Available at http://stepsa.org/socio_econ.html#Indicator
settlement typology, that included:

    •   updated socio-economic indicators on the CSIR Meso-Frame to
        2016;
    •   an indication of potential roles of towns within their regional
        contexts, based on an analyses of national and regional
        gateways and anchors conducted with Economic Development
        Department in 2014;
    •   a finer description and identification of small towns and growing
        rural settlements, considering their service role in local hinterlands
        not merely their population size. This was informed by the CSIR
        Social Facility Settlement Prioritisation, 2016; DRDLR Social Facility
        Toolkit, 2016 and SALGA Small Town Regeneration Programme,
        2017-2018;
    •   The typology were also updated to include new and growing
        settlement areas by using the unique CSIR Settlement Footprint
        created in support of the CSIR Green Book, 2018. In this process,
        the built up area of each settlement had been demarcated
        using a combination of satellite imagery, housing point data and
        fine grained statsSA population data sets, clearly demarcating
        built up areas that enable more accurate calculation of
        population and profiling of settlement dynamics.

The typology enables calculating the population and the economy of
functional town areas, comparing town areas relative to non –town
areas and exploring regional and spatial inter-relations. It also enables

                                                                                                                                                               4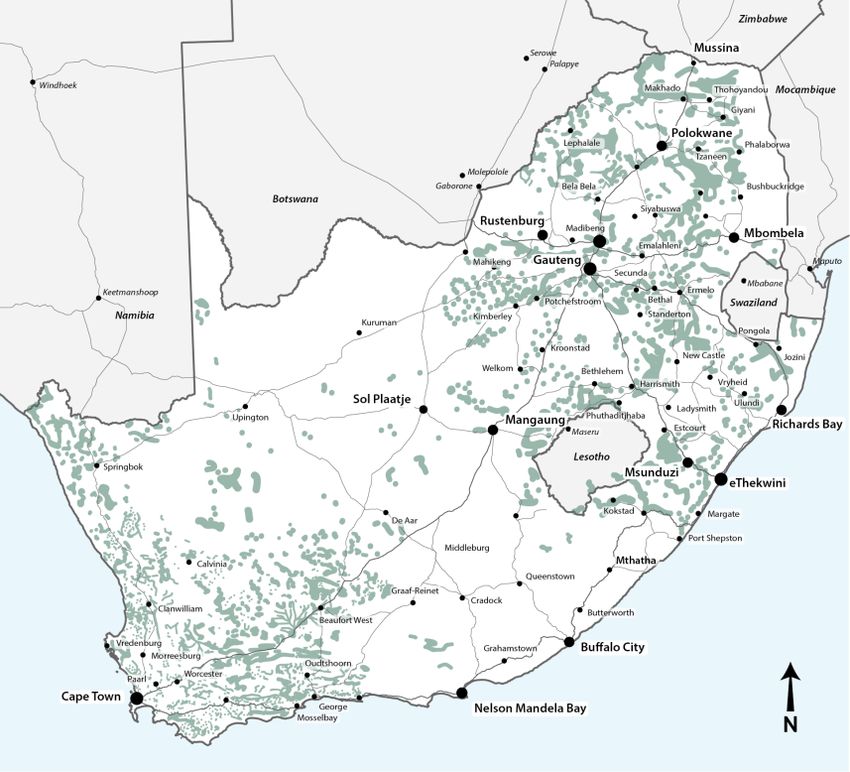
Population Projections and Spatial Location                                          making use of the spatial attraction of existing agglomeration
                                                                                     economies and concentrations, using the CSIR Functional Town
Modelling                                                                            Typology, 2018 and CSIR Open Settlement Footprint, 2017 as basis.
                                                                                 (4) The results of the Population Projections and CSIR Town Growth
Population projections and location specific scenario modelling for South            Model was used in the NSDF 2018 as a “Without Intervention
Africa has been undertaken by the CSIR which has been made available                 National Settlement Scenario” to determine most likely growth
to the NSDF (CSIR/IRDC Green Book on Climate Change Adaptation                       pressures for settlements in South Africa.
2018) and used to explore the most likely spatial implication of population      (5) The “Without Intervention National Settlement Scenario” and
projection scenarios for low and high in-migration scenarios. This                   model results were used to construct an alternative “NSDF
considers population growth as well as migration patterns and spatial                Settlement Scenario” and envisaged sustainable national
locational attraction.                                                               settlement growth outcome. This alternative NSDF Settlement
                                                                                     Scenario was informed by significant the national development
Utilising the CSIR Green Book Project Population Growth Projections
                                                                                     objectives, the national spatial vision, the national spatial
(2018) for the NSDF enabled:
                                                                                     development concepts, outcomes as attractors and global and
                                                                                     national risks as push factors.
   (1) Utilising South African context specific and scientifically verified
       national population growth projections at country level up to 2050
                                                                              The CSIR Green Book modelling approach, inputs and high level results
       for two growth scenarios (a medium and high growth scenario –
                                                                              are set out in Figure 1.
       both verified with expert reference groups).
   (2) It also enabled utilising the downscaled medium and high               The model uses the CSIR Green Book Population Projection. Prof L. van
       population growth scenarios at provincial and district scales,         Tonder, the lead expert for the CSIR, 2018 Projections has been proven to
       developed through the CSIR Green Book Project to understand            be consistently accurate over time if compared to World Bank and
       most probable regional growth pressures for 2035 and 2050.
                                                                              United Nations Projections. The modelled national population projection
   (3) Utilising the novel and innovative settlement growth model –           is indicated in Figure 2. High and medium scenarios refer to international
       developed by the CSIR to derive settlement level population            in-migration scenarios. National population projections clearly illustrate
       projections. This model has been developed to utilise provincial       the need to plan for at least a 30% increase in population by 2050, with
       and district scale population growth projections to model              the medium scenario indicating a population of 75 million by 2050 and a
       settlement growth. The model utilises a highly innovative gravity
                                                                              higher in-migration scenario, a population of 80 million by 2050. This can
       model, based on “population potential”. The latter is a measure        have significant spatial implications, with population projected to grow
       of the “attractive force” of a particular grid cell for further        primarily in urban core and secondary cities and large towns.
       population growth. The expectation of different rates of change
       for the different settlement types was accounted for in the model

                                                                                                                                                      5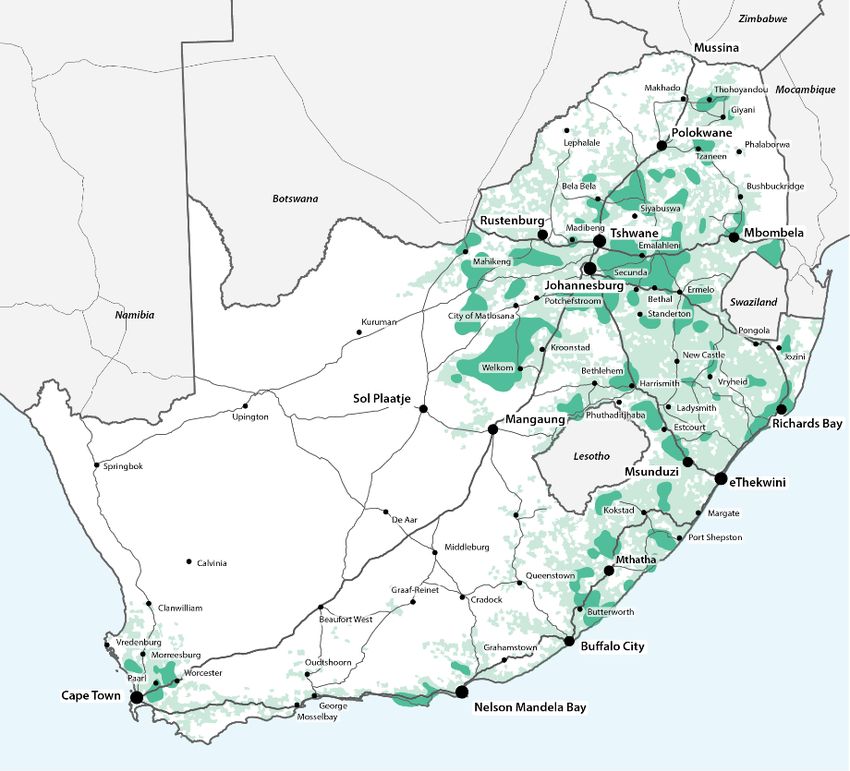
Figure 1: CSIR - National level projections and multi-scape modelling approach to enable South Africa's first national scale town/city level projections

                                                                                                                                                           6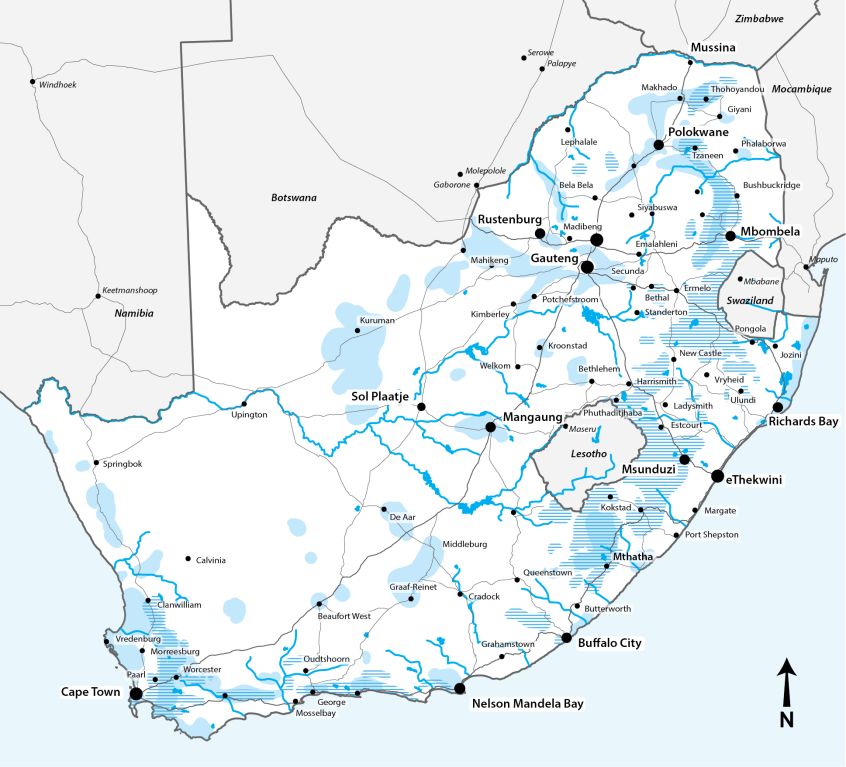
The provincial and district results (Figure 3 and 4) were used as inputs for
the location specific modelled results at settlement level. In addition to
demographic trends the gravity model developed by the CSIR currently
enables consideration of:
    • past settlement growth patterns,
    • an economic attraction pull factor depending on the role of a
       settlement/town or city (using the CSIR, Town Area Typology, 2018
       town demarcations and profiles); and
    • location specific exclusion areas.

 The projections have been downscaled and methodology tested with
 a simulation of 2001-2011 population data that provided very high
 levels of accuracy (98% for district level and 95% for settlement level).
 See diagrams below.

 The results of the “Without Intervention National Settlement Scenario”
 (Population Projections and CSIR Green Book Town Growth Model
 Results) as used in the NSDF 2018 are set out in Figure 5.

 The results of the alternative “NSDF Settlement Scenario” and
 envisaged NSDF sustainable national settlement growth outcome is
 juxtaposed with the “Without Intervention National Settlement
 Scenario” model results in Figure 6.

                                                                               7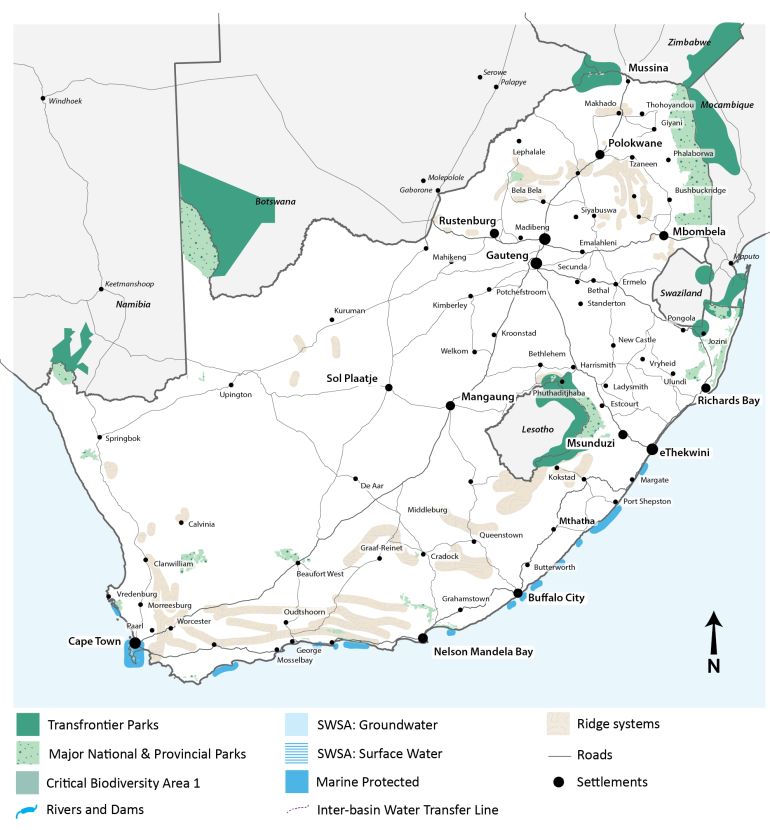
Figure 2: National level projections

SOURCE: CSIR, 2018. Green Book, Population Projections.

                                                          8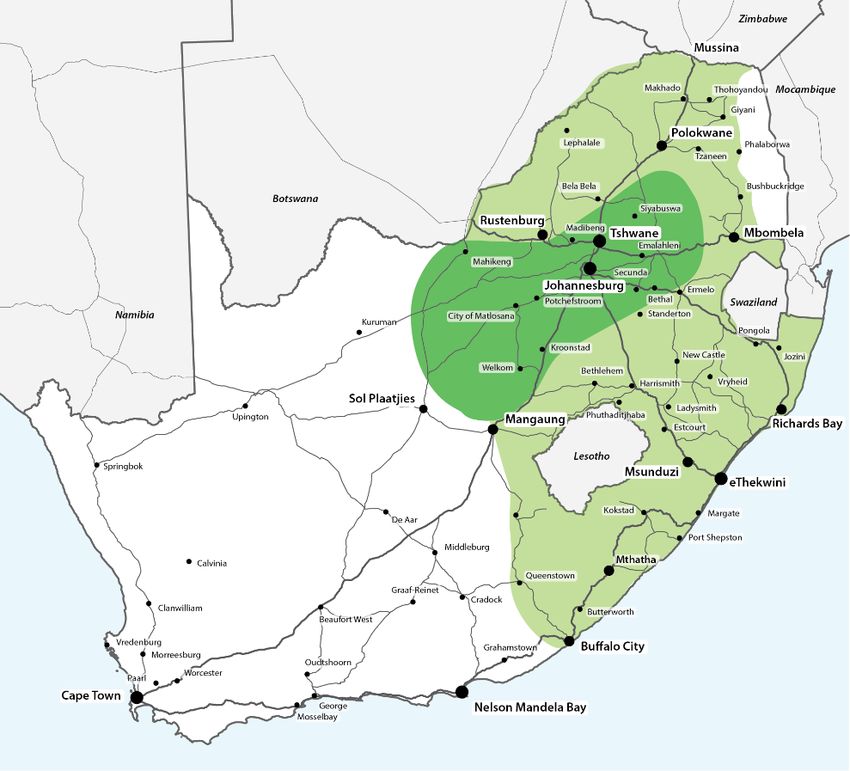
Figure 3: Provincial level projections in millions of people

SOURCE: CSIR, 2018. Green Book, Population Projections.

                                                               9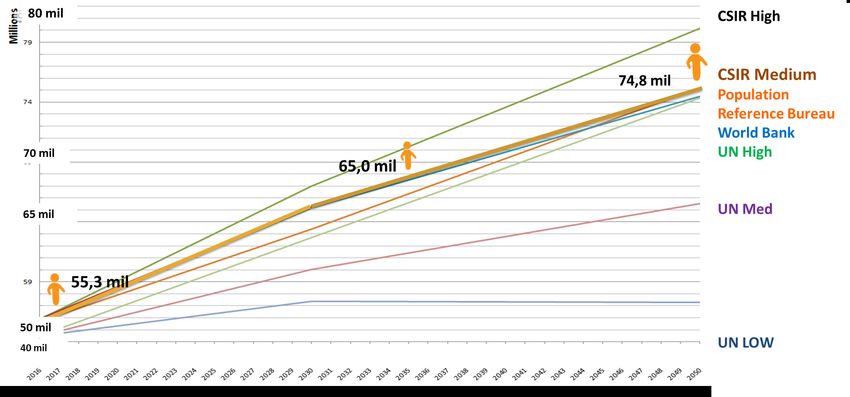
Figure 4: District level projections

SOURCE: CSIR, 2018. Green Book, Population Projections.

                                                          10
Figure 5: CSIR, Green Book Settlement level projections for 2030 and 2050
SOURCE: CSIR, 2018. Green Book, Settlement Population Growth Projections.
11Figure 6: National Settlement Patterns and 2050 Growth Scenarios - without Intervention and NSDF Spatial Vision
SOURCE: CSIR, 2018. Functional Town Area Typology, 2018; CSIR, 2018. Green Book, Settlement Population Growth Projections; CSIR, 2018. NSDF Vision Settlement
Population Growth Scenario
12projections is still to be described within the context of the much larger,
Climate Change Projections but lower resolution ensemble of AR5 GCM projections.
Climate change is a term that generally refers to a shift in weather Results and Implications
phenomena associated with an increase in global average
temperatures that would have occurred normally over long time periods. In order to sufficiently identify the spatial implications of climate change
Human intervention, however, is rapidly affecting the average surface for South Africa, several fine scaled climate change projections were
recently undertaken as part of a project entitled: “Settlement design
temperatures, which in turn are resulting in changes to climate patterns.
guidelines for climate change adaptation in South Africa” (Council for
Scientific and Industrial Research, 2016)1. The resulting projections
Overview of methodology generally predict severe temperature increases for Southern Africa. It is
especially the northern and the western parts of South Africa that can
Down Scale Climate Modelling were conducted by Prof Francois
expect significantly hotter average temperatures and more very hot
Engelbrecht, CSIR. The 8 km resolution projections were obtained by days per year by 2050. By the end of the century, temperature increases
further downscaling of the CSIR’s existing set of 50 km resolution CORDEX of between 4 and 7°C can be expected over the interior of the country.
(Coordinated Regional Downscaling Experiment) projections of future
climate change. These CORDEX projections are for two emission level Furthermore, generally drier conditions and the more frequent
mitigation scenarios, namely Regional Concentration Pathway 8.5 occurrence of dry spells are plausible over parts of the interior as
indicated in Figure 7. Areas most affected by decreases in rainfall are the
(RCP8.5; low mitigation) and RCP4.5 (high mitigation). For each of these
Western Cape (winter rainfall region), parts of the Northern Cape, central
emission pathways, six global circulation models (GCMs) that contributed
part of the Eastern Cape and areas in Mpumalanga along the eastern
to Assessment Report Five (AR5) of the Intergovernmental Panel on escarpment as well as parts of the Limpopo Province.
Climate Change (IPCC) were downscaled to 50 km resolution over the
globe, as part of the CSIR’s contribution to CORDEX. Increase in annual-average near-surface temperatures are projected to
occur over large parts of South Africa, including the western interior and
In the Greenbook project, all these simulations (twelve ensemble northern parts of South Africa. This is critical as the central and northern
members in total) were downscaled further to 8 km resolution over South parts of the interior are important agriculture production areas currently.
Aligned with the increase in temperatures is the likely increase in high fire-
Africa. The projections are analysed statistically in the Green Book of
danger days, heat-wave days and very hot days and drier conditions
South Africa Climate Change Projection report and the implications for referred to above.
South Africa are discussed. The uncertainty range described by these
1
13For the period 2021-2050 relative to the period 1971-2000, (under low Climate change also has serious long-term implications for human
mitigation), rainfall is projected to increase over the central interior and habitation and the productivity of agriculture. These projections suggest
east coast. This is most likely to go hand in hand with extreme rainfall an increasingly important role for the central and south-eastern part parts
events which have significant implications for infrastructure, flooding and of the country for (1) human settlement and (2) food production. To
water availability. Severe climate events are likely to endanger lives and accommodate both, a concerted ‘national spatial compaction,
cause damage to the built environment, which would have knock-on shrinking, and sharing-drive’ will be required. Changing climate could
effects on economic development and negatively impact service also benefit areas allowing different crops to be cultivated in areas not
delivery and sustainable development in the areas of greatest need. The previously possible. See consolidated summary map based on the
negative impacts are not likely to be limited to the agricultural sector. The projections done through the CSIR Greenbook (2018) below.
shift in rainfall patterns, together with rising temperatures and
atmospheric carbon dioxide is likely to enhance vegetation growth in Bibliography:
some regions, which could result in bush encroachment in Savannah
regions – the Kruger National Park is one area at risk. This could change • CSIR, 2018 Green Book Climate Change Projections, CSIR (2018)
ecosystem and population dynamics, leading to a change in plant and
animal communities (Griffin, 2012). • Griffin, J. (2012, April 3). The Impact of Climate Change on South Africa .
Retrieved June 13, 2018, from Climate System Emergency Institute:;
Climate change does pose a significant threat to South Africa’s current ttps://www.climateemergencyinstitute.com/cc_s_africa_griffin.html
water resources, food security, health, established infrastructure, as well
• Ziervogel, G., New, M., Archer van Garderen, E., Midgley, G., Taylor, A.,
as its ecosystem services and biodiversity. Considering South Africa’s high
Hamann, R., et al. (2014). Climate change impacts and adaptation in
levels of poverty and inequality, these impacts also pose critical South africa. WIREs Climate Change, 605-620.
challenges for national development (Ziervogel, et al., 2014).
14Figure 6. CSIR, 2018 Green Book Climate Change Projections, CSIR (2018
)
• SOURCE: Green Book Climate Change Projections, CSIR (2018)
15National Network of Regional Development Anchors
Annexure B: Spatial Descriptions in Support of Regional and rural typography, road distance and access analysis under
National Spatial Development Framework conditions of improved rural connectivity and distance analyses assisted
in identifying growth centres that can play the role of strategically
located regional and rural development anchors.
Purpose and role of Spatial Frame Annexure
Selection of regional development anchors (Table 2) envisioned broad
The Annexure provides some of the spatial specific information and base regions to facilitate national urbanisation (central, eastern and coastal
considerations in support of the National Spatial Frame and sub-frames. regions), and identified growth and development corridors. Provincial
The Frame Annexure does not provide an extensive diagnostic and plans and strategic focus areas, as well as existing national investments:
synthesis overview. The Frame Annexure is aimed at providing more detail Including Industrial Development Zones, Spatial Economic Development
and clarity on conceptual spatial frame elements, and where relevant, Zones, Agri-Hubs, Aqua focus areas were also taken into consideration.
an indication of spatial specific extent and location.
Rural development anchors were also informed by the network of towns
that play strategic regional roles as identified on the basis of nationally
Spatial Descriptions of Settlements Type comparative town profiles developed as part of the CSIR, 2018 Town
Area Typology. The location of regional development anchors also look
Significant Urban Regions and Cities into consideration of key national transport routes and the relation to
networks of Regional Service Centres and Service Towns, as outlined in
The frame identifies the urban-regions and cities that are foreseen to play
the town area typology. The latter are strategically located to act as
a critical role in (1) housing the South African population and (2) in the
national economy and that require focussed intervention (Table 1) government and economic service centres within the surrounding
service hinterland areas, as attractors of urban consolidation and form
• Key Regions are based on projected future population growth and the bulk of the identified rural service centres.
climatic conditions: The Gauteng Urban Region (and surrounding
cities in the urban-innovation belt) with a population agglomeration
in an urban region likely to be home to about 22 million people.
• Cape Town Urban Region (stretching towards surrounding urban
clusters), with more than 6 million inhabitants.
• The ‘urban region and big cities along the South African East Coast,
eThekwini Urban Region, Nelson Mandela Bay, Buffalo-City and
Richards Bay Urban Regions, would need to play a critical role for
consolidated urban livelihoods for more than 8 million South Africans.
16Table 1: Description of current and growing cities and big towns as a basis for envisaged NSDF settlement vision.
NATIONAL URBAN REGIONS AND NODES
NSDF national urban regions and nodes have been identified on the basis of existing and projected high growth 1. City regions, 2. Cities and large regional centres and a
select few 3. Regional service centres, as defined in the CSIR, South Africa Functional Town Typology – 2018. These areas will be home to the majority of the population in
future. Excepted to house 61% of the country’s 2050 population (CSIR, 2018. NSDF Vision Settlement Population Growth Projection).
URBAN REGIONS NATIONAL URBAN CORES SMALLER URBAN CORES
Population:> 3 million people AND Economic output > Cities: Population: >500 000 and Economic output >R7 Very Large Regional Centers: Population: >300 000
R40 816 mill/yr (2013 - Metros/International 900mill/yr (2013), and Economic output >R4 000mill/yr (2013)
Gateways with continuing significant population Large Regional Centers: Population: >100 000 and
and economic share. Economic output >R1400mill/yr (2013)
Greater Ekurhuleni Metro; Nelson Mandela Bay Metropolitan region Newcastle Large Regional Centre
Gauteng
Urban City of Johannesburg Bloemfontein/ Botshabelo City Area Tzaneen Large Regional Centre
Region
City of Tshwane Metro and Nelspruit City Area Witbank Large Regional Centre
Functionally linked areas in West Rustenburg City Area Klerksdorp/Stilfontein Large Regional Centre
Rand, Sedibeng; Bojanala, Fezile Dabi
and Nkangala DM East London City Area
Greater Cape City of Cape Town and Functionally Polokwane City Area Regional Service Centres: Population: >100 000 and
Town Urban linked areas in Stellenbosch Cape Economic output >R1100mill/yr (2013)
Region Winelands DM and West Coast DM Richards Bay Large Regional Centre
Pietermaritzburg City Area
Greater eThekwini Metro and Kimberley
eThekwini Hazyview Regional Centre
Urban Functionally linked areas in iLembe, King Williams Town Regional Centre
Region Ugu, Umgungundlovu DMs
Mthatha Regional Centre
Middelburg Regional Centre
17Table 2: Description of current settlement network as a basis for envisaged NSDF national network of Regional Development Anchors.
Regional Development Anchors
NSDF national network of regional development anchors have been identified on the basis of exiService Towning and projected high growth towns, Service Townrategic location
etc. as set out in Annexure. The basis has been the network of Regional Growth Centres and significant Service Towns within the CSIR, South Africa Functional Town Typology
– 2018.
Regional Growth Centres are made up of Regional Service Centres and a selection of regionally significant Service Towns. Selection of the service towns
considered formal economy and population growth.
Population variation between 15 000 to juService Town over 100 000 people and economic output >R270mill (2013)
Excepted to house 14% of the country’s 2050 population (CSIR, 2018. NSDF Vision Settlement Population Growth Projection).
Aliwal North Service Town De Aar Service Town Kokservice Townad Service Town Musina Service Town Queenservice Townown
Barberton Service Town Dennilton/Siyabuswa Regional Kroonservice Townad Regional Service Oudtshoorn Regional Service Regional Service Centre/Town
Beaufort Weservice Town Service Centre/Town Centre/Town Centre/Town Secunda Regional Service
Service Town Ermelo Regional Service Kuruman Service Town Paarl/Wellington Regional Centre/Town
Bela Bela Regional Centre/Town Ladysmith Regional Service Centre/Town Service Centre/Town Springbok Service Town
Service Centre/Town Eservice Towncourt Regional Lephalale Service Town Pennington/Scottburgh Regional Service Townanderton
Bethal Regional Service Service Centre/Town Lichtenburg Regional Service Service Centre/Town Regional Service Centre/Town
Centre/Town George Regional Service Centre/Town Phalaborwa/Namakgale Swellendam Service Town
Bethlehem Regional Centre/Town Lusikisiki Service Town Regional Service Centre/Town Thohoyandou Regional
Service Centre/Town Giyani Service Town Lydenburg Service Town Phuthaditjhaba Regional Service Service Centre/Town
Brits Regional Service Graaf-Reinet Service Town Makhado Service Town Centre/Town Ulundi Service Town
Centre/Town Grahamservice Townown Makopane Regional Service Piet Retief Service Town Upington Regional Service
Burgersfort Regional Service Centre/Town Centre/Town Plettenberg Bay Service Town Centre/Town
Bushbuckridge Regional Groblersdal Regional Service Manguzi Pongola Service Town Vredenburg Regional Service
Service Centre/Town Centre/Town Matatiele Service Town Port Shepservice Centre/Town
Butterworth Regional Harrismith Service Town Mmabatho Regional Service Townone/Margate Regional Vryburg Service Town
Service Centre/Town Jozini Centre/Town Service Centre/Town Vryheid Regional Service
Calvinia Moorreesburg Service Town Potchefservice Townroom Centre/Town
Clanwilliam Mossel Bay Regional Service Regional Service Centre/Town Worceservice Towner
Cradock Service Town Centre/Town Regional Service Centre/Town
18Table 3: Description of current settlement network as a basis for envisaged regional networks of Rural Service Centres.
Rural Service Centres
This group consists of service towns, small service towns and settlements
Population: Varies in nodal settlement, large population in direct hinterland
Excepted to house 5% of the country’s 2050 population. (CSIR, 2018. NSDF Vision Settlement Population Growth Projection).
E.G. Middelburg EC, Mtubatuba, Barkley East, Bizana etc.
See stepSA.co.za for a separate list for a full list of 271 towns.
Other Settlements This category includes the rest of the towns and settlements which were not included in the above
categories. This includes: small towns, dense rural and spare settlements.
Population: Less than 20 000 people in town itself. Population even less in the dense/sparse rural
hinterland.
Excepted to house 20% of the country’s 2050 population
E.G. Hogsback, St Helena Bay, Tabankulu, See stepSA.co.za separate list for a full list of 346 towns and settlements.
Thornhill, Hofmeyer etc.
19Regional networks of consolidated and well-connected rural The area is identified on the following inputs, a) crop fields from the
National Department of Agriculture as well as b) land capability 2016
service centres from the National Department of Agriculture.
Rural service centres (Table 3)across South Africa were identified based
Figure 7: Agricultural Heartland and Agri-Enterprise Regions
on network of towns that play strategic regional roles as identified on the
basis of the CSIR, 2018 Town Area Typology and recently developed
priority towns for social investment within the DRDLR Rural Social Facility
Toolkit project.
The town area typology is also used for the identification of potential
regional roles for medium and small towns in support of SALGA’s Small
Town Regeneration Strategy. The role of towns informs the Integrated
Urban Development framework Implementation: SALGA Small Town
Strategy. Identified points of growth and or existing development act as
points of settlement consolidation in rural areas especially in areas of high
value agricultural and ecological infrastructure.
Spatial Description of Agricultural Heartland, Agri-
Enterprise Regions and Eco-Resource Production
Regions
Agricultural Heartland Areas
The frame firstly refers to the “Central Agricultural Heartland” – which
includes all identified high value production and high potential
agricultural land in the central part of the country (See Figures 7 and 8).
20Figure 8: High Value Agriculture Areas in Central Heartland and Agri- Agri-Enterprise Resource Regions
Enterprise Regions
Identified areas of high and moderate land capability, dense settlement
areas with high potential for agri-resource enterprise development and
water availability (See Figures 7 and 8).
It once again considers a) crop fields from the National Department of
Agriculture as well as b) land capability 2016 from the National
Department of Agriculture. Crop fields with a land capability index value
of 8 and more were selected to represent intermediate to high value
agriculture land in the country. NOTE: The National Department of
Agriculture is currently in the process of an update of this data layer and
will form the basis of this sub-frame.
In addition, it documents current productive land, (currently cultivated),
as well as market access to densely settled and new growth areas, were
considered as one of the indicators to set up potential sites for small scale
farming schemes.
The selection of suitable sites for small scale farming were influenced by
the following criteria and considerations:
• High potential agricultural land based on land capability.
• Agriculture infrastructure in existence or planned. High priority was
given to planned Agri-hubs and agro-processing, proximity to fresh
produce markets and other processing facilities.
• Proximity to cities and identified growth regions were of utmost
importance for the sustainability of small scale farming. This includes
proximity of social facilities like schools, health and social support.
• Availability of sources of water, e.g. located downstream from
existing dams to ensure good gravity feed. Areas where Land Reform
Crop fields with a land capability index value of 8 and more were and Agriculture Development (LRAD) programs cluster in proximity.
selected to represent intermediate to high value agriculture land in the Only areas with slopes of less than 6% were selected.
country. NOTE: The National Department of Agriculture is currently in the
process of an update of this data layer and will form the basis of this sub- Cognizance should be taken of the broad spectrum of agricultural
frame. activity in South Africa, and the need for differentiated responses at each
level. Levels of agricultural activity in this regard are represented in the
21pyramid on the following pages. This spectrum of agricultural activity is region and place (Figure 9). Viable small scale farming and
categorised according to scale and intensity of production, ranging from transformation from below was thus a key input in shaping significant
large commercial producers at the peak to smaller scale producers “agri-enterprise resource regions”
towards the base.
Central to the spatial logic on this frame are the following:
Figure 9: Viable small scale farming and transformation from below as key • Maintenance of national agricultural heartlands in the interests of
input in shaping significant “agri-enterprise resource regions” national food security
• The prioritisation of lower order agricultural development areas that
exhibit greater cumulative levels of spatial advantage in terms of:
o Agricultural productivity, crop suitability and viability
o Proximity to existing consumption and production chains
o Accessibility to higher order settlement typologies
o Accessibility to supporting agricultural infrastructure
o High population densities
o Effective agricultural development through agrarian and
land reform will require recognition of and concerted efforts
around the following:
o The need to realign and combine models of agrarian and
land reform at a policy level:
o Define the role of land reform as an instrument to facilitate
land access and security of tenure for agricultural
development.
o Optimise the role of stakeholder-based land reform.
o Steer land reform policy towards boosting productive land
use among the rural poor.
o Renew emphasis on ‘transformation-from-below’ for
widespread grassroots impact on poverty and
unemployment:
o Facilitate the conversion of underutilized land in communal
areas into small scale and/or commercial production.
o Incorporate indigenous knowledge systems for agriculture in
Key to the approach is a small-scale farming model, indicative of a traditional areas in a way that factors traditional spatial
‘transformation-from-below’ approach; one that is espoused by a variety relationships between settlement and agricultural practice.
of specialists and academics on the topic of agrarian reform in South o Spatial targeting approach that factors the contextual and
Africa. A potentially renewed emphasis on transformation-from-below for comparative advantages of region and place:
agrarian reform will require a spatially differentiated and targeted
approach that factors both contextual and comparative advantages of
22o Pick and support commercial agriculture sectors and regions uses that reduce stream flow or affect water quality (e.g. mining,
that have the highest potential for growth and employment. sprawling settlements, plantations, overgrazing) should be avoided in
• Focus on strategic agricultural development areas where expanded SWSAs; wetlands should be kept in good condition or rehabilitated, and
irrigation is possible through improved water management and new invasive alien plants should be cleared.
water schemes.
• Focus support on agricultural development areas that have The areas provide unique opportunities for agri-enterprises, eco-
comparative advantage in terms of proximity and access to enterprises, and activities including small scale arming, wildlife ranching,
production and consumption chain networks, e.g. Regional marine economies, tourism and restoration related job creation
Development Anchors, Rural Service Centres.
opportunities.
• Provide strategic developmental support for potential new
production and consumption chains in dense rural hinterlands.
Spatial illustration of national significant energy
Spatial Description of Eco-Resource Production and
infrastructure as part of national connectivity
Livelihood Regions
network
There are areas that need to play a key role in resource economies as
well as management of national ecological infrastructure – with specific
Infrastructure network to support national energy flows from existing gas
land-development and management implications.
fields and coal resource areas, as well as an increased energy mix and
These are areas that are nationally significant for ecological as well as existing national and regional networks, as well as current and future
“resource critical regions” for other purposes such as mining, agriculture, settlement patterns. The network infrastructure (see ‘Figure 9) primarily
settlements, heritage and tourism areas. consists of:
The areas are typically under stress from an ecological perspective. They • Power generation and stations
are are under pressure in terms of their resilience, but also in terms of the • Coal fired power stations
impact of development and risk to critical biodiversity areas (CBA1) and
• Hydroelectricity power-stations
associated ecological service areas such as Strategic Water Source
Areas. • Gas turbines
• Nuclear power stations
The Eco-Resource Production and Livelihood Regions are characterised • Bio-mass power
by the prominence of Strategic Water Service Areas (SWAs), which • Landfill gas power
contribute significantly to the overall water supply of the country – not • Transmission networks:
merely to the region itself. • Existing pipeline for crude oil and gas;
• Future pipeline for gas;
These areas are our water factories, supporting growth and development
needs that are often a long distance from the SWSAs themselves. Land • Main transmission lines.
23Figure 9: National Energy Infrastructure Network • Transfrontier Parks;
• Biosphere reserves;
• National Fresh Water Protected Areas (Water bodies)
Figure 10: National Protected Areas
•
Additional Spatial Descriptions of National
Ecological Infrastructure Network
Spatial Description of National Protect Areas
National Protected Areas as base for the ecological infrastructure
includes:
• Official National and major Provincial Protected areas – Terrestrial
and Marine protected areas;
24Spatial Description of National Environmental Management Figure 12: Strategic Water Source Areas, National Fresh Water Bodies
Areas
Management and productive use of Critical Biodiversity Areas (CBAs)
(Figure 10) and Strategic Water Source (SWS) areas (Figure 11) and
National Fresh Water Bodies (Figure 11) have been identified as Priority
National Ecological Infrastructure Regions that are of national
importance and development.
Figure 11: Critical Biodiversity Areas
The Strategic Water Source Areas (SWSAs) contribute significantly to the
overall water supply of the country. They are identified in Atlas of
Freshwater Ecosystem Priority Areas in South Africa (Nel et al, 2011). The
World Wild Life Fund’s 2015 report on SWSAs provide detail descriptions of
individual SWSAs.
• In the Southern and West Coast region and the Central heartland
areas, these areas largely coincide with high productive
25agricultural, urban growth, mining activities and critical bio-
diversity areas.
• Along the eastern coast and inland areas and in the north of the
country, strategic water source areas have to be managed
within productive agriculture, densely settled and also traditional
settlement areas.
Mountainous areas, largely natural due to slopes and typography
Management needs to consider restoration, green enterprise and
service delivery, tourism and game farming activities.
Strategic Groundwater Areas in the central and arid regions are critical
for many towns that are dependent on scarce groundwater sources.
The system of National Fresh Water Bodies and management guidelines
are set out in the
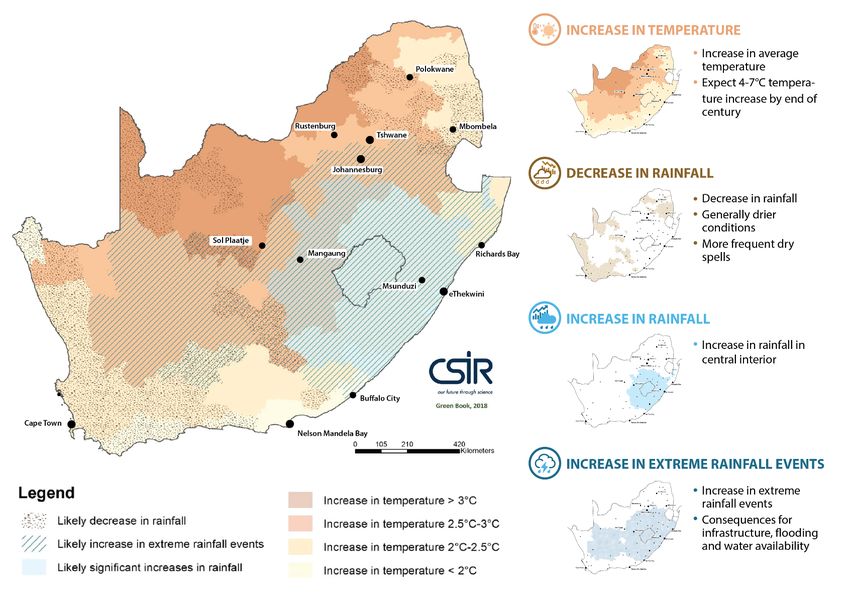
Spatial Illustration of Significant Inter-Basin Water Transfer
Lines
Nationally significant inter-basin water transfer lines and dependent cities
have been identified and are set out on Figure 13.
26Figure 13. Significant Inter-Basin Water Transfer Lines
27Figure 14 National Resource Risk Areas
Additional Spatial Description of National Resource
Risk Areas
National resource risk areas (See Figure 14) are both nationally significant
and under stress from an ecological perspective, but are also “resource
critical regions” for other sectors such as mining and agriculture. These
areas are under pressure in terms of their resilience, but also in terms of
the impact of development and risk to critical biodiversity areas (CBA1)
and associates ecological service areas.
Priority Focus Areas: Stressed Catchments and densely populated
Strategic Water Source Areas
Strategic Focus Areas: The risks associated with inter-regional
interdependencies are clearly evident in significant national scale
ecological core “competition” areas in
• Ekangala region (Mpumalanga) (SWSA, coal mining, high
potential agricultural land),
• Greater uMngeni region (KZN) (water supply for Ethekwini,
intensive agriculture, expanding settlements.),
• Waterberg region (Limpopo) (mining, water and future expansion
driven as national priority) and the The Mpumalanga Coal Mining and Coal Fired Power Plant region will be
• Olifants Water Management Area (Mpumalanga and Limpopo) under increased pressure for environmental considerations, possible
(big irrigation scheme, major water quality issues, mining decline in demand in coal and large scale employment under threat.
pressure). Coal Fired Power Station Dependency on Water Transfers.
• The Berg and Breede River Catchments.
Areas require (1) regional economic diversification and transition, and
(2) shared forecasting, phasing, pro-active and regional scale
economic transition planning, scenario development and enterprise
development between multiple role players and institutions.
28Significant plans, studies and sources that informed distribution (CSIR, 2018. NSDF Vision Settlement Population Growth
Projection).
the spatial specific selection of frame elements • SADC. (2015). SADC Industrialization Strategy and Roadmap 2015
- 2063. Gabarone: SADC.
National Urban and Settlement Network • Southern African Development Community. (2012). Regional
Guidance for national urbanisation patterns, nodes and corridors have Infrastructure Development Master Plan. Gabarone: SADC.
been informed by a range of policies and plans. Spatially explicit national • Selection of regional growth centres considered regions
plans, initiatives and strategies. That includes: envisioned to facilitate national urbanisation (central, eastern
and coastal regions), and identified growth and development
• Current metropolitan, city and secondary cities (SOCR, 2016; corridors. (See Frame 1.2 and 1.3).
SACN Secondary Cities Work); • The Integrated Urban Development Framework Implementation:
• Existing urban densities and size of population and economy in 37 Intermediary City Municipalities are also expected to play a
functional urban regions (city areas) and cities on the basis of key role as future urban regions, cities and regional anchor towns
nationally comparative town profiles developed in the CSIR, 2018 in NSDF Spatial Scenario.
Town Area Typology. • Department of Human Settlements Spatial Master Plan (guiding
• Network of cities with international gateway functions as land release and investment through the Housing Development
identified using the EU International Gateway Indicators (see Agency)
Matfield, et al. 2014 and EDD, 2014 and EU, 2014). These primarily • International journal of urban and regional research, still to be
consider: published.Cilliers, J. 2018. Made in Africa: Manufacturing and the
o Projected urbanisation and population growth Fourth Industrial Revolution. Institute of Security Studies. In Africa
o International and national trade, logistic centres (land, and the Wolrd Report. April. 2018
sea and air ports) • Council for Scientific and Industrial Research. (2016). Settlement
o Mining, manufacturing and industrial centres design guidelines for climate change adaptation in South Africa.
o Gateway functions as government services, provincial CSIR. Pretoria: CSIR.
capitals and education centres • Snowball, Collins and Tarentaal. (2016). Transformation and job
o Knowledge economy and research centres creation in the cultural and creative industry in SA, SACO.
• South African Cities Network (SACN). (2014). Outside the core:
o Service economy and green economy size and
Towards and understanding of Intermediate Cities in South
opportunities Africa. South African Cities Network: Johannesburg.
o International tourism nodes • South African Cultural Observatory (SACO). (2016). The Role of
• NSDF Spatial vision and settlement pattern scenario based re- Cultural and Creative Industries in Regenerating Urban and Rural
modelling of regional patterns of projected urban population Space and Economies in South Africa: A case Study Approach.
Submitted to the Department of Arts and Culture.
29• South African Cultural Observatory (SACO). (2016).The mapping • Selection of regional development anchors:
of the South African creative economy: A baseline. Submitted to o Rural regional anchors was identified based on a network
the Department of Arts and Culture. of towns with strategic regional roles as identified on the
• South African Cultural Observatory (SACO). (2017).
basis of nationally comparative town profiles developed
Macroeconomic impact assessment and analysis of South
Africa’s cultural and creative industry (CCI) and creative. in the CSIR, 2018 Town Area Typology. The town area
Submitted to the Department of Arts and Culture. typology is also used for the identification of potential
• Southern African Development Community (SADC). (2012). regional roles for medium and small towns in support of
Regional Infrastructure Development Master Plan. Gabarone: SALGA’s Small Town Regeneration Strategy. The role of
SADC towns informs the Integrated Urban Development
• Southern African Development Community (SADC). (2015). Framework Implementation: SALGA Small Town Strategy.
SADC Industrialization Strategy and Roadmap 2015 - 2063.
o SA CSIR MesoZone 2018v1 Dataset: Available at
Gabarone: SADC.
• South African National Biodiversity Institute (SANBI). (2016). http://stepsa.org. Available at http://stepsa.org see
Framework for Investment in Ecological Infrastructure. http://stepsa.org/socio_econ.html#Indicator
• Selection of priority corridors, harbours, ports and trade posts as
well as government investment areas (such as SEZs) and inter- • Council for Scientific and Industrial Research. (2016). Settlement design
guidelines for climate change adaptation in South Africa. CSIR. Pretoria:
regional corridors and networks as outlined in
CSIR.
o Transnet, 2016. National ports plan 2016;
o TRANSNET. (2016). 30-year Long-term Planning Framework
(Chapter 4 Port Development Plan). Johannesburg:
National Movement and Connectivity Infrastructure
o TRANSNET Group; Department of Transport. 2015. National
Transportation Plan. Department of Transport; • Department of Water and Sanitation (DWS). (2017). Draft National
o Amos, S. (2010). The role of South Africa in SADC regional Water Plan, DWS (2017: 40-41).
integration: the making or braking of the organisation. • Transnet, 2016. National ports plan 2016;
Journal of International Commercial Law and • TRANSNET. (2016). 30-year Long-term Planning Framework (Chapter
Technology, 124-131. 4 Port Development Plan). Johannesburg:
o Brand, A. 2017. The use of corridor development as a • Transnet. 2015. Transnet Freight Rail: Road to Rail Strategy Progress:
strategic and supporting instrument towards the June 2015. Presentation to the Parliamentary Committee on Public
development of national space economies. Enterprises, Cape Town, South Africa.
Potchefstroom: NWU (Unpublished Thesis – PhD); • Department of Transport (DoT). 2013. National Household Travel
o Brand, A. and Drewes, JE. 2018. Spatial Corridor Model Survey datasets. Pretoria, South Africa.
(SCM) – structuring economic spaces in South Africa. • Department of Water and Sanitation. National Water and Sanitation
Master Plan. Draft 2.6. 2017.
30• Department of Transport (DoT). 2015. National Transport Master Plan National Resource Regions and Ecological Infrastructure
2050. Pretoria, South Africa.
Guidance for national ecosystem and resource regions have been
• Strategic National South African Infrastructure network and plans,
informed by a range of policies and plans. Spatially explicit national
including: IDZs, SEZs, Strategic freight, heavy haul and passenger
plans, initiatives and strategies. This includes:
railway networks, Road network, Ports,
- Department of Agriculture: Considering a) crop fields from the
• Green energy suitability – 2017 EGIS data
National Department of Agriculture as well as b) land capability 2016
(https://egis.environment.gov.za/) available from the Department of
from the National Department of Agriculture. NOTE: The National
Environmental Affairs. It was processed by CSIR to create areas of Department of Agriculture is currently in the process of an update of
focus (2017) this data layer and will form the basis of this sub-frame.
• Hydro Electricity, hydro-electricity, biomass electricity and co- - Land Capability and Agriculture Production (StatsSA, Quantec, CSIR
generation electricity, and coal fired power generation sites, Mesozone, 2017) Department of Agriculture, RSA. 2014. Land
provided by ESKOM 2017. capability. (dataset).
- Department: Planning, Monitoring and Evaluation. 2017. Research
• Settlement data, provided by the Department of Water Affairs, 2017
on the Limited Success of Entrepreneurial Activity by Locals in
• Electricity Grid and Coal Fired Power Stations, Eskom 2017
Townships and Rural Areas. Seven Dialogue Locations: Townships,
• Pipeline Networks, NATMAP,
Rural and Informal Settlement. Research Report conducted for
• Coal resource areas, Council for Geo-Science
Programme Four: National Planning Commission. October. 2017.
• Renewable Energy Development Zones, as identified investment
- Report of the High-Level Panel on the Assessment of Key Legislation
areas for renewable energy resource investment.
and the Acceleration of Fundamental Change. (2017). Page 32.
• Ports Regulator of South Africa (PRSA). 2015. South African port - Commission on the Restitution of Land Rights. (2014/15). Strategic
capacity and utilisation report 2015/16. Accessed 06 July 2016 at Plan. CRLR.
www.portsregulator.org. - DRDLR. (2011). Green Paper on Land Reform.
• Department of Environmental Affairs. SEA: National corridors for Gas - African National Congress. (2012). Land Reform Policy Discussion
Pipeline corridor and Electricity Grid Infrastructure Extension, 2018. Document. Johannesburg: ANC.
The green energy infrastructure focus areas, for solar energy, wind energy - Department of Energy (DOE). 2015. State of Renewable Energy in
and as identified in the renewable energy corridors, have been South Africa. [Online] available at:
considered as resource potential areas, as set out in the various Wind, http://www.gov.za/sites/www.gov.za/files/State%20of%20Renewabl
Solar, and Bio-Energy Atlases. e%20Energy%20in%20South%20Africa_s.pdf.
- Department of Environmental Affairs (DEA). n/d. About the green
economy. [Online] available at:
https://www.environment.gov.za/projectsprogrammes/greenecono
my/about.
31- Renewable Energy Independent Power Producer Procurement - EWT report (Taylor et al 2016) on wildlife ranching, which includes an
Programme (REIPPP) - http://www.energyintelligence.co.za/reippp- assessment of employment in the sector (65 000 jobs in 2014 – see
all-you-need-to-know/ below)
- Renewable Energy Development Zones (REDZ) -
- WWF’s 2015 report on SWSAs – for descriptions of individual SWSAs
https://egis.environment.gov.za/renewable_energy
- Local Action for Biodiversity: Wetlands South Africa – - SANBI, 2016: Framework for Investment in Ecological Infrastructure)
http://biodiversityadvisor.sanbi.org/wp- - Driver, A. Ecological Infrastructure FAQs. Unpublished Presentation.
content/uploads/2016/07/LAB-Wetlands-SA-brochure.pdf 2017
- Important Bird Areas - - Significant programmes, principles, policies or projects relating to
http://www.birdlife.org.za/conservation/important-bird-areas/iba- environment:
map • Grasslands Programme (SANBI) -
- Atlas of Freshwater Ecosystem Priority Areas in South Africa (Nel et al, https://www.sanbi.org/biodiversity-science/science-
2011).
policyaction/mainstreaming-biodiversity/grasslands-programme
- NDP. Chapter 6. Page 196
• Freshwater Programme (SANBI) -
- Department of Water and Sanitation (DWS). (2017). Draft National
https://www.sanbi.org/biodiversity-science/science-
Water Plan, DWS (2017: 40-41).
policyaction/mainstreaming-biodiversity/freshwater-programme
- Transnet, 2016. National ports plan 2016;
• Succulent Karoo Programme (SANBI) -
- TRANSNET. (2016). 30-year Long-term Planning Framework (Chapter
https://www.sanbi.org/biodiversity-science/science-
4 Port Development Plan). Johannesburg:
policyaction/mainstreaming-biodiversity/succulent-karoo-
- Transnet. 2015. Transnet Freight Rail: Road to Rail Strategy Progress:
programme
June 2015. Presentation to the Parliamentary Committee on Public
• Ecological Infrastructure (SANBI). -
Enterprises, Cape Town, South Africa.
https://www.sanbi.org/biodiversity-science/science-
- Department of Transport (DoT). 2013. National Household Travel
policyaction/mainstreaming-biodiversity/ecological-
Survey datasets. Pretoria, South Africa.
infrastructure
- Department of Water and Sanitation. National Water and Sanitation
• CAPE Programme (SANBI) conservation of the Cape Floristic
Master Plan. Draft 2.6. 2017.
Region - https://www.sanbi.org/biodiversity-science/science-
- Greenberg. 2013. Institute for Poverty, Land and Agrarian Strategies,
policyaction/mainstreaming-biodiversity/fynbos-programme
UWC. Page 18
- Greenberg. 2013. Institute for Poverty, Land and Agrarian Strategies,
UWC. Page 19 Provincial Plans and Strategies
- Cousins (2015), Aliber et al (2017). Provincial plans and strategies including:
- Atlas of Freshwater Ecosystem Priority Areas
National Biodiversity Economy Strategy (DEA) • KwaZulu-Natal, Provincial Growth & Development Plan, 2018
32• KwaZulu-Natal, Provincial Growth & Development Strategy, 2016 - National Department of Human Settlements. (2015). Towards a
• Eastern Cape, Provincial Spatial Development Plan, 2010 Policy Foundation for the Development of Human Settlements
• Free State, Provincial Spatial Development Framework, 2014 Legislation.
• Gauteng, Provincial Spatial Development Framework, 2017 - National Treasury, City Support Programme. (2012). CSP Framework.
• Limpopo, Provincial Spatial Development Framework, 2016 National Treasury.
• Mpumalanga, Provincial Spatial Development Framework, 2013
• Northern Cape, Provincial Spatial Development Framework, 2012
• North West, Provincial Spatial Development Framework, 2016
• Western Cape, Provincial Spatial Development Framework, 2014
Inter-regional , national and long term farmeworks
- Africa Union Commission. (2015). Agenda 2063: The Africa We Want.
- United Nations. 2016. Habitat III. Quito. 17-20 October 2016.
- United Nations. 2015. Sustainable Development Goals
- SADC. (2015). SADC Industrialization Strategy and Roadmap 2015 -
2063. Gabarone: SADC.
- Southern African Development Community. (2012). Regional
Infrastructure Development Master Plan. Gabarone: SADC.
- The Presidency. National Spatial Development Perspective, 2006.
- Department of Co-operative Governance. 2016. Integrated Urban
Development Framework. A new deal for South African Cities and
Towns.
- Department of Co-operative Governance. 2018. Localising the New
Urban Agenda: South Africa Discussion Document
- Economic Development Department. 2011. The New Growth Path
Framework.
- National Planning Commission. 2012. National Development Plan,
2030. Our Future – make it work.
33You can also read