ANTARES: The Arizona-NOAO Temporal Analysis and Response to Events System
←
→
Page content transcription
If your browser does not render page correctly, please read the page content below
ANTARES: The Arizona-NOAO Temporal
           Analysis and Response to Events System

Thomas Matheson and Abhijit Saha
National Optical Astronomy Observatory
950 North Cherry Avenue
Tucson, AZ 85719, USA

and

Richard Snodgrass and John Kececioglu
Department of Computer Science
University of Arizona
P.O. Box 210077
Tucson, AZ 85721, USA

1         Introduction
The Arizona-NOAO Temporal Analysis and Response to Events System (ANTARES)
is a joint project of the National Optical Astronomy Observatory and the Department
of Computer Science at the University of Arizona. The goal is to build the software
infrastructure necessary to process and filter alerts produced by time-domain surveys,
with the ultimate source of such alerts being the Large Synoptic Survey Telescope
(LSST). Such a tool is often called a broker [2], as it acts as the entity between
producers and consumers. ANTARES will add value to alerts by annotating them
with information from external sources such as previous surveys from across the
electromagnetic spectrum. In addition, the temporal history of annotated alerts will
provide further annotation for analysis. These alerts will go through a cascade of
filters to select interesting candidates. For the prototype, ‘interesting’ is defined
as the rarest or most unusual alert, but future systems will accommodate multiple
filtering goals. The system is designed to be flexible, allowing users to access the
stream at multiple points throughout the process, and to insert custom filters where
necessary.

2         The Problem
The rapid growth of time-domain surveys produces discoveries at an ever-growing
rate. Current optical surveys, such as the Lick Observatory Supernova Search1 , the
    1
        http://astro.berkeley.edu/bait/public html/kait.html

                                                   1
Catalina Real-Time Transient Survey2 , the Panoramic Survey Telescope & Rapid
Response System3 , the Palomar Transient Factory (PTF and iPTF)4 , and the La
Silla-Quest Variability Survey5 generate transient alerts well beyond the available
follow-up capacity. These projects have developed tools to filter their discoveries to
focus on events of interest to each team. A good example of this is SkyAlert6 , a system
that has solved many of the astronomical issues associated with adding value to alerts.
SkyAlert enables users to create filters on alerts, including ancillary information on
these alerts, in order to find relevant events. The PTF system also employs tools to
identify interesting alerts [1]. The scale of time-domain alert generation, though, is
quickly increasing. The Zwicky Transient Facility [9] will have more than 6 times the
field-of-view of PTF, while time domain surveys with DECam on the Blanco telescope
benefit not only from the 3 deg2 field-of-view, but the depth attainable with a 4m-
class facility. Moreover, transients are generated across the electromagnetic spectrum,
from radio facilities such as LOFAR7 to high-energy space-based observatories such
as Fermi8 , making the overall problem that much more complex.
On the horizon is LSST [8]. With its 10 deg2 field-of-view and ∼6m collecting
area, the transient detection rate leaps by orders of magnitude. LSST will detect
(with 5σ significance) 103 − 104 alerts per image, or 106 − 107 per night. A good
fraction of these will be known variable stars or moving objects [14, 5] (see also
Ridgway’s contribution to these proceedings), but hidden among them will be rare
and interesting objects that have relatively short lifetimes. Only with additional
follow-up will these objects reveal their nature. These could range from short-lived
phases of stellar evolution such as the final helium flash [6, 7] to superluminous
supernovae [3] to electromagnetic counterparts of LIGO detections [15, 12]. Beyond
these rare, but known or predicted, objects lies the great discovery space that awaits
LSST. The superluminous supernovae were essentially unknown fifteen years ago and
the discovery of dark energy was certainly surprising. Over its life, LSST will generate
more than a billion alerts and some will be completely unknown and unanticipated
objects. Without the ability to rapidly sort through millions of alerts each night and
winnow them down to a reasonable number that can be studied in detail, we will
lose these rare and potentially extraordinarily interesting objects. The astronomical
community is becoming more aware of the necessity of such a tool [10].
2
http://crts.caltech.edu/
3
http://pan-starrs.ifa.hawaii.edu/public/
4
http://ptf.caltech.edu/iptf/
5
http://hep.yale.edu/lasillaquest
6
http://skyalert.org/
7
http://www.transientskp.org/
8
http://fermi.gsfc.nasa.gov/
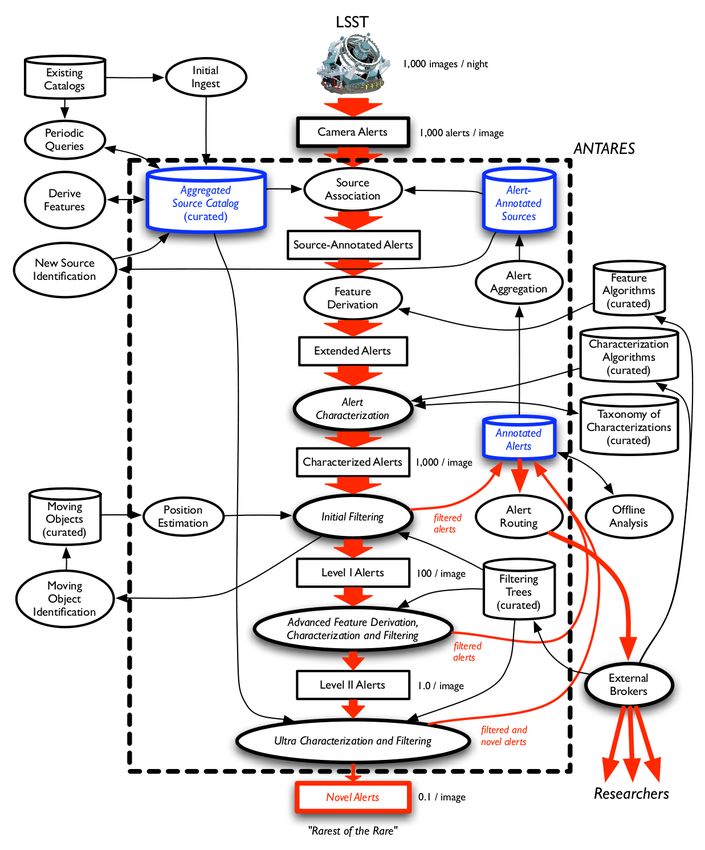
2Figure 1: Basic architecture of the ANTARES system. The dashed box encompasses
the processes that must keep up with the LSST frame-rate.
3 ANTARES
The knowledge we have about an alert, such as brightness, change in flux, Galactic
coordinates, ecliptic coordinates, distance to nearest galaxy, etc., constitute features
that can probabilistically characterize alerts. We emphasize that this is a broad
characterization, not a specific classification. Classification will have to come from
software systems further downstream. Because of the time-scale of LSST exposures,
with a new image every ∼37 seconds, alerts must be processed rapidly to keep up
3with the data stream. Classification often requires more complex analysis and usually
a more complete light curve [13, 4].
Figure 1 illustrates the main components of the ANTARES architecture. The over-
all design principles are open source and open access. The software will be available
for anyone to implement and our implementation will be community driven. The
alert stream can be tapped at many points throughout the system.
The first stage is annotation that adds value to the alerts. Source association is a
critical step to incorporate relevant astronomical knowledge for each alert. Catalogs of
astronomical information, as well as the LSST source catalog will be the basis for this
source association. Examples include the 2MASS All-Sky Data Release9 , the Chandra
Source Catalog10 , the NRAO VLA Sky Survey11 , the Sloan Digital Sky Survey12 ,
the NASA Extragalactic Database13 , and GAIA14 , among many others. Even the
proximity to known sources can provide useful constraints. In addition, the history of
flux measurements at the position, such as a light curve, will be valuable annotation.
An efficient database that can be updated regularly is an essential element of the
system. This will be a valuable astronomical resource on its own. As mentioned
before, the SkyAlert system provides a similar annotation. The problem for the
future is the scale of alerts and the resulting necessity of this efficient database being
integrated into the system brokering alerts.
For many alerts, there will only be a small number of features available for char-
acterization, especially for an initial detection. If there are not enough features for
discrimination by filtering, we can apply a probabilistic expectation of variability
based on position on the sky and known distributions of variability [14]. For a po-
sition, we can construct a variability probability density function and predict the
likelihood of the alert as observed. With more data, more features become available
and more complex filtering algorithms can be used.
ANTARES will then use multiple layers of filters to sort the alerts and find the
rarest or most interesting among them (this is the focus of the prototype project).
The other alerts are not discarded. Rather, they are diverted from the main filtering
stream but are still accessible to other filtering systems, including, potentially, copies
of the ANTARES system itself that are tuned to specific goals. In this way, custom
filters can be applied, allowing users to isolate exactly which of the alerts is of interest
to them and thus address many different goals. These community-derived filtering
algorithms will be applied in a multi-step process, allowing for better management
of computational resources. By characterizing the alerts, the number of dimensions
9
http://www.ipac.caltech.edu/2mass/releases/allsky/
10
http://cxc.harvard.edu/csc/index.html
11
http://www.cv.nrao.edu/nvss/
12
http://www.sdss.org/
13
http://ned.ipac.caltech.edu/
14
http://sci.esa.int/science-e/www/area/index.cfm?fareaid=26
4of feature space can be reduced. More complex filters can be applied to the smaller
number of alerts after initial filtering stages.
The Arizona Machine-Experimentation Laboratory (AMELIE, Figure 2), provides
a system for constructing and testing structural-causal models [11]. This essentially
automates the scientific process and allows us to run experiments to test relationships
among features, including relationships that have not yet been apparent. It can
observe the operation of ANTARES and make it more efficient.
The goal for the prototype is to distinguish rare and unusual objects. Once it is
operational, the next stage is to expand the scope to allow users to find any type of
alert of interest to them. In principle, there could be many stages of the ANTARES
system itself, processing different data streams over different time scales. The overall
alert ecosystem could accommodate multiple alert input streams and thus find a
general way to serve the astronomical community’s needs.
Prime with Manually
Lifecycle Specified Model
Model Hypothesis Design Experiment
User Interface
MILL Model Entry and
Managing Hypothesis Experiment Experiment
Exploratory Data
the Investigation Exploration Workflow Design Management
Analysis
LifecycLe
for Generation
Algorithms
Hierarchical Task Experiment Design,
Network Hypothesis Experiment
Model Construction Planning and
Generation Workflow
Scheduling
Cyber Workspace
(Representation)
Workflow
Execution
Experiment Data: Candidate Hypotheses and Experiment
Measured and Causal Models Explanatory Goals Workflows
Domain
Derived Domain
Experiment
Domain
Experiment
Environments
Experiment
Environment
Environment
SCM
for Analysis
Algorithms
Specification Experiment
Model Evaluation Hypothesis Testing Reliability Analysis Outcome
Domain Data
Specification
Prime with
Existing Data
Figure 2: Basic architecture of AMELIE.
The authors are happy to acknowledge the NSF INSPIRE grant (CISE AST-
1344024, PI: Snodgrass) that supports this work.
5References
[1] Bloom, J. S., et al. 2012, PASP, 124, 1175
[2] Bourne, K. D., 2008, AstrN 329, 255
[3] Gal-Yam, A. 2012, Science, 337, 927
[4] Graham, M. J., et al. 2013, MNRAS, 434, 3423
[5] Grav, T., et al. 2011, PASP, 123, 423
[6] Herwig, F. 2005, ARAA, 43, 435
[7] Iben, I., et al. 1983, ApJ, 264, 605
[8] Krabbendam, V. L. & Sweeney, D. 2010, Society of Photo-Optical Instrumenta-
tion Engineers (SPIE) Conference Series, 7733
[9] Kulkarni, S. 2012, astro-ph/1202.2381
[10] Matheson, T., et al. 2013, astro-ph/1311.2496
[11] Morrison, C. & Snodgrass, R. T. 2011, Communications of the ACM, 36
[12] Nissanke, S., Kasliwal, M., & Georgieva, A. 2013, ApJ, 767 124
[13] Richards, J. W., et al. 2011, ApJ, 733, 10
[14] Ridgway, S., et al. 2014, ApJ, submitted
[15] Sigg, D., & LIGO Scientific Collaboration 2008, Classical and Quantum Gravity
25, 114041
6You can also read