Application for Resource Plan Approval 2022-2036
←
→
Page content transcription
If your browser does not render page correctly, please read the page content below

Application for
Resource Plan Approval
                2022–2036

PUBLIC DOCUMENT — NOT PUBLIC (OR PRIVILEGED)
            Data has been excised

                          SUBMITTED TO
  Minnesota Public Utilities Commission: Docket No. E017/RP-21-339
              North Dakota Public Service Commission
              South Dakota Public Utilities Commission

                       September 1, 2021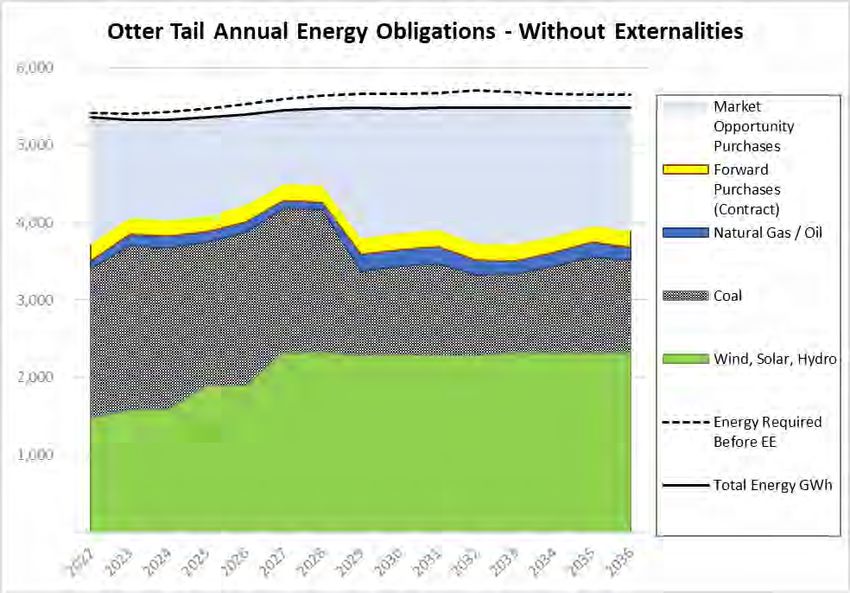
PUBLIC DOCUMENT – NOT PUBLIC (OR PRIVILEGED) DATA HAS BEEN EXCISED
Table of Contents
1 Statement of Preferred Plan ................................................................................................................ 1
2 Preface ................................................................................................................................................ 1
3 The Factors Considered in our Planning Analysis. .......................................................................... 12
3.1 Plan Synopsis ........................................................................................................................ 13
3.2 Load Forecast ........................................................................................................................ 15
3.3 Future Resource Needs.......................................................................................................... 16
3.4 Resource Plan Development ................................................................................................. 18
3.5 New Resource Alternatives ................................................................................................... 19
3.6 Preferred Resource Plan ........................................................................................................ 19
3.7 Multi-State Jurisdictional Complexity .................................................................................. 27
3.7.1 Multiple ISOs (SPP & MISO) .......................................................................................... 28
3.8 Resilience .............................................................................................................................. 32
3.9 Coyote Station ....................................................................................................................... 40
3.10 Adding Dual Fuel Capabilities at Astoria Station ................................................................. 53
3.11 Preferred Plan is in the Public Interest .................................................................................. 58
3.12 Preferred Plan Rate Impacts .................................................................................................. 59
3.13 Five-Year Action Plan........................................................................................................... 60
3.14 Conclusion............................................................................................................................. 61
4 Current Outlook ................................................................................................................................ 62
4.1 Retirement of Hoot Lake Plant.............................................................................................. 62
4.2 Completion of Astoria Station, a 245 MW simple-cycle natural gas combustion turbine in
South Dakota .................................................................................................................................... 62
4.3 Completion of the 150 MW Merricourt Wind generation facility in North Dakota ............. 63
4.4 MISO Module E Resource Adequacy Obligation ................................................................. 63
4.5 Market Conditions in the MISO ............................................................................................ 64
4.6 MPUC Approval of the 49.9 MW Hoot Lake Solar generation facility ............................... 64
4.7 Renewable Energy Objectives (REO) and Standards (RES) ................................................ 65
4.8 DSM and Conservation Requirements .................................................................................. 66
4.9 Projected Load and Capability .............................................................................................. 69
5 Plan Development ............................................................................................................................ 73
5.1 Plan Objectives...................................................................................................................... 73
5.2 Planning Tools ...................................................................................................................... 73
5.3 Planning Process ................................................................................................................... 74
6 Preferred Resource Plan ................................................................................................................... 75
6.1 Preferred Resource Plan Description .................................................................................... 78
6.2 REO/RES/SES Compliance .................................................................................................. 78
6.3 Load Growth Scenarios ......................................................................................................... 79
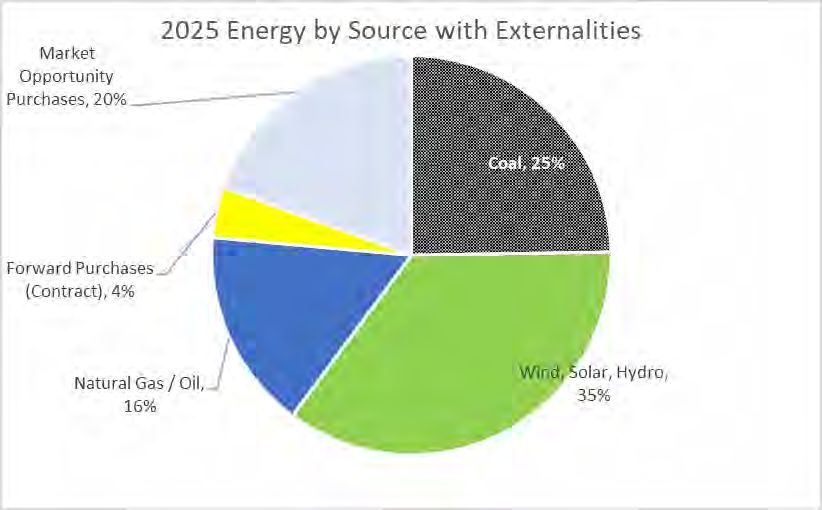
6.4 Environmental Externalities .................................................................................................. 80
6.5 Emissions and Greenhouse Gas Reduction Goal .................................................................. 80
6.6 Oil Peaker Evaluation Sensitivities ....................................................................................... 83
6.7 Additional Sensitivity Scenarios ........................................................................................... 84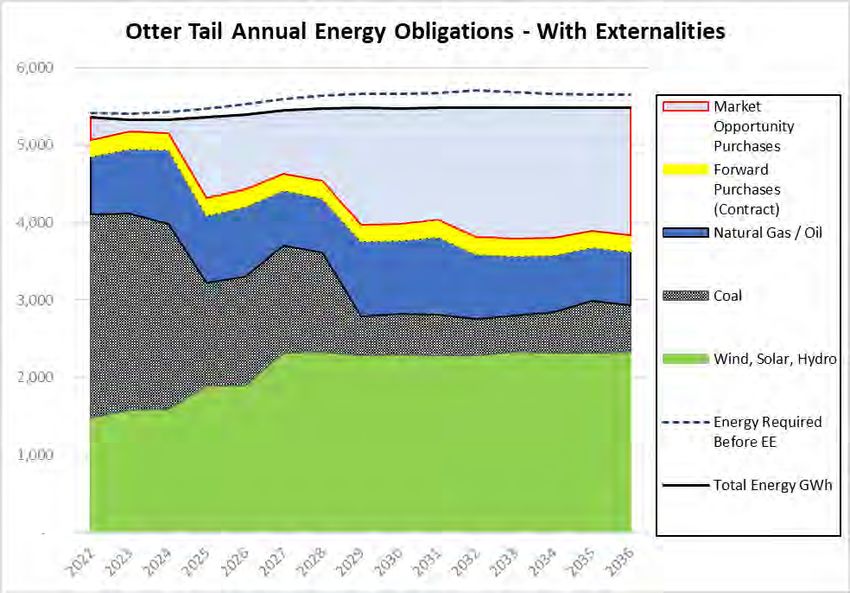
PUBLIC DOCUMENT – NOT PUBLIC (OR PRIVILEGED) DATA HAS BEEN EXCISED
ii. Table of Contents

7   Conclusion ........................................................................................................................................ 86
    7.1   Preferred Plan is in the Public Interest .................................................................................. 86
    7.2   Socio-Economic Impacts of the Preferred Plan .................................................................... 87
    7.3   Five-Year Action Plan........................................................................................................... 88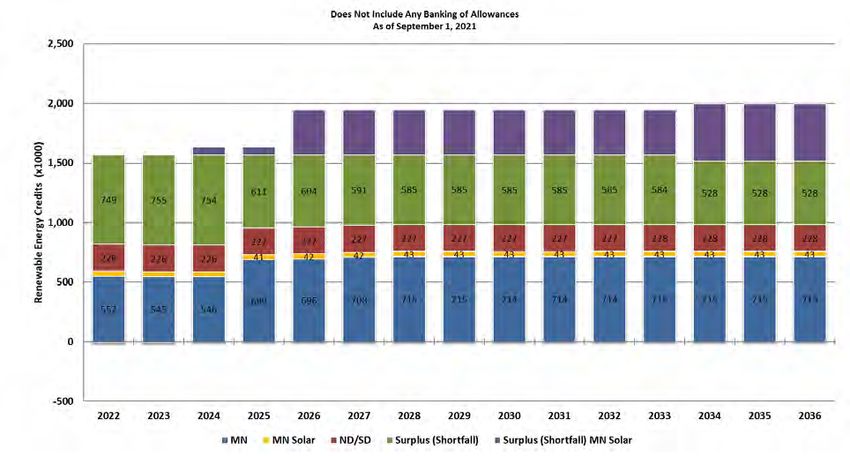
PUBLIC DOCUMENT – NOT PUBLIC (OR PRIVILEGED) DATA HAS BEEN EXCISED
iii. List of Appendices

Appendix A: Plan Cross Reference and Checklist
Appendix B: Electric Utility Report
Appendix C: Existing Resources
Appendix D: Potential Resources
Appendix E: Assessment of Federal and State Environmental Regulation
Appendix F: Assumptions for EnCompass Modeling Scenarios
Appendix G: REO/RES Compliance Strategy
Appendix H: Brattle Group Study on Demand Response
Appendix I:    Integrated Resource Plan Sensitivity Summary
Appendix J:    Distributed Renewable Generation Evaluation
PUBLIC DOCUMENT – NOT PUBLIC (OR PRIVILEGED) DATA HAS BEEN EXCISED
iv. List of Tables

Table 2-1: Execution of 2016 IRP Order ...................................................................................................... 4
Table 2-2: Comparison of 2017-2020 Forecasted to Actual Market Prices ................................................. 5
Table 2-3: Coyote Withdrawal NPVRR Comparison* ................................................................................. 8
Table 2-4: Otter Tail 2022-2028 Detailed Action Plan.............................................................................. 10
Table 3-1: Otter Tail Total System Average Cost of Energy Paid by Otter Tail Customers since 2010 .. 12
Table 3-2: Summer 2022-2036 Base Case Projected Load and Capability Prior to Preferred Resource
Plan ............................................................................................................................................................. 17
Table 3-3: List of Resource Alternatives Included in EnCompass Model .................................................. 19
Table 3-4: Preferred Resource Plan Summary ............................................................................................ 20
Table 3-5: Base Case with and without Externalities ................................................................................. 25
Table 3-6: NPV Revenue Requirement Base Case and Preferred Plan ...................................................... 26
Table 3-7: Percentage of Otter Tail operations in each of its three states ................................................... 27
Table 3-8: Generation Resources and Resiliency Factors........................................................................... 34
Table 3-9: Resilient Generation .................................................................................................................. 36
Table 3-10: Coyote Station Ownership Percentage .................................................................................... 41
Table 3-11: Coyote Station Estimated Foreseeable Withdrawal Costs....................................................... 46
Table 3-12: February 2021 LMP Pricing Scenario ..................................................................................... 57
Table 3-13: Five-Year Action Preferred Plan Activities............................................................................. 61
Table 4-1: Summer 2022-2036 Base Case Projected Load and Capability Prior to Preferred Resource
Plan ............................................................................................................................................................. 71
Table 6-1: Preferred Plan Resource Summary ............................................................................................ 75
Table 7-1: Five-Year Action Preferred Plan Activities............................................................................... 89
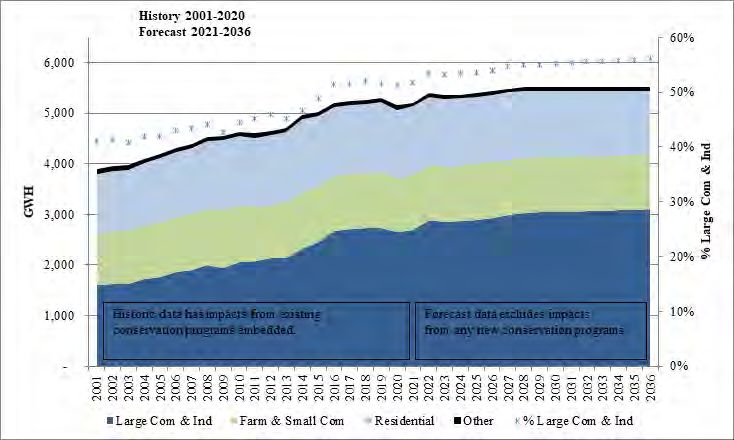
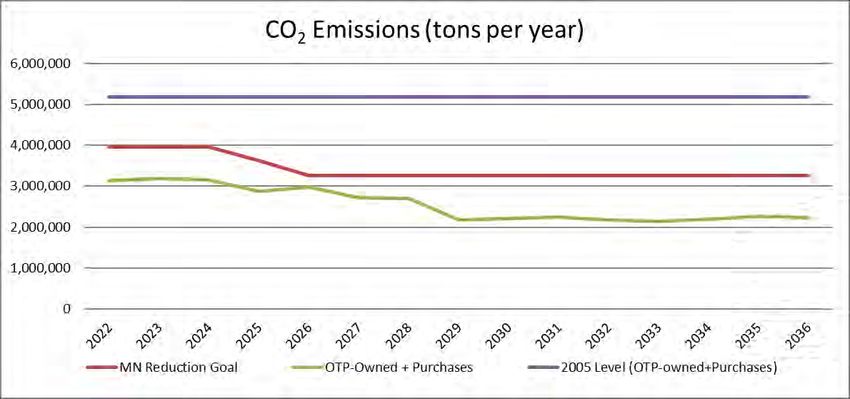
PUBLIC DOCUMENT – NOT PUBLIC (OR PRIVILEGED) DATA HAS BEEN EXCISED
  v. List of Figures

Figure 3-1: Current Capacity Resources and Reserve Obligation 2022-2036 (MW) ..................................................... 18
Figure 3-2: Preferred Plan Capacity Resources and Reserve Obligation 2022-2036 (MW) .......................................... 21
Figure 3-3: Preferred Plan Energy Resources and Requirements with Externalities Applied 2022-2036 (GWh) ......... 22
Figure 3-4: Preferred Plan Energy Resources and Requirements without Externalities Applied 2022-2036 (GWh) .... 22
Figure 3-5: 2025 Energy by Fuel Source No Externalities ............................................................................................. 23
Figure 3-6: 2025 Energy by Fuel Source with Externalities ........................................................................................... 23
Figure 3-7: Preferred plan 2036 Energy by Fuel Source No Externalities ..................................................................... 24
Figure 3-8: Preferred plan 2036 Energy by Fuel Source with Externalities ................................................................... 24
Figure 3-9: 2022 Forecasted Load Relationship with Resilient Generation ................................................................... 38
Figure 3-10: 2030 Forecasted Load Relationship with Resilient Generation (Preferred Plan)....................................... 39
Figure 3-11: Historic Ventura Hub Natural Gas Prices .................................................................................................. 55
Figure 3-12: Preferred Resource Plan Estimated Rate Impacts ..................................................................................... 59
Figure 3-13: Preferred Resource Plan Estimated Rate Impacts by Class ....................................................................... 60
Figure 4-1: Historic and Forecast Unmanaged 50/50 Non-coincident Summer Peak Demand ...................................... 69
Figure 4-2: Historic and Forecast Annual Retail Sales Before EE (Losses are not included) ........................................ 70
Figure 4-3: Summer 2022-2036 Capacity Needs Prior to Preferred Plan Information ................................................... 72
Figure 6-1: 2022-2036 Capacity Resources and Reserve Obligation for Preferred Plan (MW) ..................................... 76
Figure 6-2: 2022-2036 Energy Resources and Energy Requirements for Preferred Plan with Externalities (GWh) ..... 77
Figure 6-3: 2022-2036 Energy Resources and Energy Requirements for Preferred Plan without Externalities (GWh) 78
Figure 6-4: Compliance with REO/RES Regulation in All Jurisdictions ....................................................................... 79
Figure 6-5: SO2 and NOx Emissions ............................................................................................................................... 81
Figure 6-6: CO2 Emissions ............................................................................................................................................ 81
Figure 6-7: Mercury Emissions ...................................................................................................................................... 81
Figure 6-8: Preferred Plan CO2 Emissions and the CO2 reduction Goal ........................................................................ 82
Figure 6-9: Sensitivity Comparison (PVSC/PVUC) ...................................................................................................... 85
PUBLIC DOCUMENT – NOT PUBLIC (OR PRIVILEGED) DATA HAS BEEN EXCISED
                                                                                          Resource Plan 1

1        Statement of Preferred Plan
Otter Tail Power Company (Otter Tail or Company) has developed a Preferred Plan that will
allow us to reduce costs while maintaining and enhancing resiliency and giving the Company
greater control over whether or not to dispatch resources based on market conditions.
Accordingly, we are requesting authority to carry out the following key aspects of the plan
within the next five years:
    •    the addition of dual fuel capability at Astoria Station;
    •     the addition of 150 MW of solar generation in 2025; and
    •     the commencement of the process of withdrawal from our 35 percent ownership interest
         in Coyote Station.
This plan, the analysis supporting it, and its various components are discussed in greater detail
throughout this filing. 1

2        Preface
Otter Tail has prepared this resource plan for concurrent filings with the Minnesota Public
Utilities Commission (MPUC), the North Dakota Public Service Commission (ND PSC), and the
South Dakota Public Utilities Commission (SD PUC).

Resource Plan Requirements and Policy Considerations
In Minnesota, this plan is filed to satisfy the requirements of Minnesota Statute § 216B.2422 and
Minnesota Rules, Part 7843. In North Dakota, the plan is filed pursuant to North Dakota
Century Code §§ 49-05-04.4 and 49-05-17. In South Dakota, the plan is filed to keep the SD
PUC apprised of the Company’s plans; however, there is not any statute or rule requiring the SD
PUC to review or approve resource plans.

1
 In addition to the foregoing, Otter Tail’s five-year plan also includes taking the initial steps to necessary to bring
100 MW of additional wind resources into service in 2027.
PUBLIC DOCUMENT – NOT PUBLIC (OR PRIVILEGED) DATA HAS BEEN EXCISED
                                                                                     Resource Plan 2

The legal and regulatory requirements regarding resource plan approval thus differ from state to
state, as does the significance of approval (where required). However, regardless of the specific
differing statutory and regulatory provisions, integrated resource plan analysis plays an important
role in all three Otter Tail states when the necessity and prudence of resource additions are
considered, including certificate of need matters, certificate of public convenience and necessity
cases, and rate recovery matters.

Otter Tail is quite small for a vertically integrated utility. Despite that small size, we have
succeeded over the years in keeping our rates low. Customers have benefitted from our
efficiency and economies of scale we have been able to achieve in spite of our limited customer
base. If, however, the requirements of our regulators in Minnesota, North Dakota, and South
Dakota were to diverge to the point that we had to operate state-specific systems in each
jurisdiction, the increase in administrative expenses and the loss of economies of scale would
increase our costs and, necessarily, our retail rates. It is important, therefore, that the Company
be able to maintain a single integrated system pursuant to an integrated resource plan acceptable
to all three jurisdictions. Obviously, there can be (and are) some differences in the regulatory
treatment of certain resources, but there is also, just as obviously, a point at which Otter Tail
could not reasonably accommodate such differences. Fortunately, we are confident that the
Commissions in all three states will support the integrated resource plan presented in this filing,
as was the case with our most recent resource plan.

Execution of the 2016 Plan
Resource planning is a continuous and iterative process. Accordingly, the resource plan
submitted with this filing is based on the Company’s most recent resource plan, which was
submitted in 2016 (2016 Plan),2 with appropriate adjustments for changing conditions in the
market and our industry. In the 2016 Plan, various actions were scheduled for the 2017 to 2022
planning period. For the most part, the Company has completed its planned actions. In

2
 In the Matter of Otter Tail Power Company’s 2017-2031 Integrated Resource Plan, in Minnesota Docket No E-
017/RP-16-386 and North Dakota Case No. PU-16-308.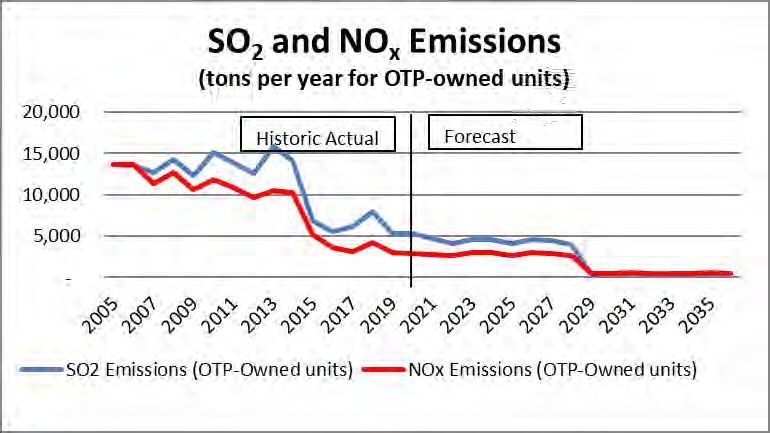
PUBLIC DOCUMENT – NOT PUBLIC (OR PRIVILEGED) DATA HAS BEEN EXCISED
                                                                                          Resource Plan 3

particular, two major resource additions authorized as part of the 2016 Plan3 are now in service:
the 150 MW Merricourt Wind Energy Center, located near Merricourt, North Dakota, went into
service in late 2020, and the 245 MW Astoria Station simple-cycle natural gas generator, located
near Astoria, South Dakota, went into service in early 2021. The Company added those two
generation resources in response to the May 2021 retirement of the Hoot Lake Plant4 and the
expiration of certain capacity contracts.

In addition to the new generation resources now in service, the Company is also working to
develop the MPUC-approved Hoot Lake Solar project, a 49.9 MW solar installation using the
Hoot Lake Plant interconnection.5 The facility is currently anticipated to be in service in 2023.
The Hoot Lake Solar opportunity emerged quickly, and Otter Tail responded effectively to
secure interconnection rights, investment tax credits, and the necessary permits. The Hoot Lake
Solar project matched a need identified in Minnesota for solar generation with a unique
opportunity at the site of the retiring Hoot Lake Plant. Once in service it will provide significant
ratepayer benefits, including reductions to market purchases during the most expensive hours of
the year.6 Table 2-1 summarizes Otter Tail’s execution of the 2016 Plan.

3
  In the Matter of Otter Tail Power Company’s 2017-2031 Integrated Resource Plan, Order Approving Plan with
Modifications and Setting Requirements for Next Resource Plan, April 26, 2017, MPUC Docket No E-017/RP-16-
386.
4
  The Hoot Lake Plant was a 140 MW coal-fired facility originally constructed in the 1950s that used coal from the
Powder River Basin. It was retired from service on May 31, 2021.
5
  In the Matter of Otter Tail Power Company’s Petition for Approval of the Hoot Lake Solar Project, Order
Approving Petition, Authorizing Allocation of Output and Costs, Authorizing Cost Recovery, And Requiring
Compliance Filings, April 29, 2021, MPUC Docket No. E-017/M-20-844. The Company is currently undergoing
vendor requests for proposals and negotiations.
6
  Id. at 7.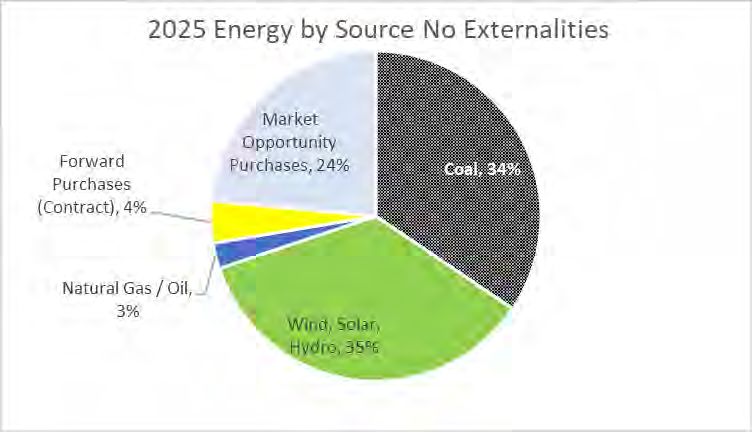
PUBLIC DOCUMENT – NOT PUBLIC (OR PRIVILEGED) DATA HAS BEEN EXCISED
                                                                                          Resource Plan 4

                                Table 2-1: Execution of 2016 IRP Order

               2016 Resource Plan Order                                  Execution of 2016 IRP
        The addition of 200 MW of wind in the              The 150 MW Merricourt Wind Farm became
        2018-2020 timeframe                                commercially operational in December 2020.7
        The addition of 30 MW of solar in about Received MPUC approval to construct the 49.9
        2020                                    MW Hoot Lake Solar Project beginning in
                                                2021.
        The addition of up to 250 MW of                    The 245 MW Astoria Station was completed
        peaking capacity in 2021                           and became operational during Q1 2021
        Average annual energy savings of 46.8              Average annual energy savings of 1.86%,
        GWh (1.6 percent of sales).                        which exceeds the newly established 1.75%
                                                           goal in Minnesota’s ECO Act.8

The Company has performed well in carrying out the 2016 Plan. The Astoria and Merricourt
projects were completed on time and under budget despite substantial labor availability
challenges and supply chain disruptions caused by the COVID-19 pandemic. In fact, final
Merricourt costs were nearly 20 percent9 lower than the estimated costs presented in the 2016
Plan, and the final Astoria costs are expected to be about seven percent10 lower than the
estimated costs presented in the 2016 Plan. The Hoot Lake Plant was retired on-schedule, on
May 31, 2021. The Company mitigated the community and worker impacts that are inherent in
any facility retirement through thoughtful planning, communication, and coordination.

7
  The 150 MW Merricourt Project with its approximately 50 percent net capacity factor is basically equivalent to the
200 MW addition of wind resource with an approximately 40 percent capacity factor assumed in the 2016 Resource
Plan Order.
8
  On May 25, 2021, Minnesota Governor Tim Walz signed the Energy Conservation and Optimization (ECO) Act of
2021. This legislation modernized Minnesota conservation policy by adding new opportunities and setting higher
conservation goals. The ECO Act increased the annual energy savings goal for public electric utilities, from 1.5
percent of retail sales to 1.75 percent of retail sales, based on a rolling three-year average of weather normalized
sales.
9
  The 2016 Resource Plan wind resource selected was $30/MW. Otter Tail expects the levelized cost of the
Merricourt project to be less than $24/MWh.
10
   The 2016 Resource Plan new thermal alternative selected was $599/kW (2017$), escalated to $674/kW (2021$) /
$167.2 million and the current estimate at completion is $628/kW / $153.8 million.
PUBLIC DOCUMENT – NOT PUBLIC (OR PRIVILEGED) DATA HAS BEEN EXCISED
Resource Plan 5
The Company has also been successful with its demand-response initiatives, including
Minnesota’s approved Conservation Incentive Program (CIP), South Dakota’s Energy Efficiency
Program (EEP), and other conservation and demand-response initiatives. These programs benefit
customers in all three states served by Otter Tail. Since the MPUC approved the 2016 Plan in
2017, Otter Tail has achieved energy savings of 78,583 MWh in 2018, 82,466 MWh in 2019,
and 81,559 MWh in 2020. Combined, these achievements have significantly reduced our energy
needs by 242,609 MWh, which has resulted in a substantial reduction in the cost of providing
service to our customers.
As a result of both the Company’s successful management of the costs of the generation resource
additions and favorable market conditions for purchased power, the Company has been able to
keep its costs lower than contemplated in the 2016 Plan. Table 2-2 provides a comparison
between the prices forecasted in the 2016 Plan and the actual market prices for 2017 to 2020.
Table 2-2: Comparison of 2017-2020 Forecasted to Actual Market Prices
$/MWh 2016 Resource Plan Actual LMPs $ Change % Change
2017 29.99 23.00 -6.99 -23.3%
2018 27.94 27.28 -0.66 -2.4%
2019 27.81 22.99 -4.82 -17.3%
2020 28.10 16.60 -11.50 -40.9%
2017 -2020 Average 28.46 22.47 -5.99 -21.0%
Otter Tail’s all-in rates (including base rates, riders, and fuel charges) continue to be among the
very lowest of all electric utilities in each of our states. We are proud of that, and we recognize
that collaboration with our state Commissions and other stakeholders has been an important part
of our success in keeping rates low. Our new resource plan is designed to keep our rates low,
while maintaining reliability and responding to the realities of current and projected market
conditions.PUBLIC DOCUMENT – NOT PUBLIC (OR PRIVILEGED) DATA HAS BEEN EXCISED
Resource Plan 6
The Preferred Plan
Our preferred 2022-2036 resource plan (Preferred Plan) takes account of the anticipated demand
and energy needs of the Company’s customers. Based on those forecasted needs, we have set
forth both specific actions that Otter Tail plans to complete during the first five years of the
planning period and potential actions that Otter Tail may take during the subsequent ten years.
In our plan, Otter Tail presents actions that: (a) will ensure that Otter Tail has the resources
necessary to continue to provide reliable, low-cost electricity to meet customers’ needs, while
avoiding adverse impacts; (b) comply with the requirements of applicable statutes and rules; and
(c) take account of the sometimes-differing goals of the commissions in all three states.
The Company has determined that it can best satisfy those goals by: (1) beginning the process of
withdrawal from our ownership interest in Coyote Station; (2) modifying the Astoria Station so
that it can use fuel oil in addition to natural gas (dual fuel capability); and (3) adding solar and
wind resources, including a 150 MW solar facility and a 100 MW wind facility. Our analysis
indicates that this combination of actions will maintain and enhance the resiliency of our system
and reduce costs.
In fact, the economic analyses supporting the Preferred Plan is compelling. In almost every
scenario and permutation analyzed, the results are clear: It is no longer in customers’ best
interest for Otter Tail to continue to participate as an owner in Coyote Station. This outcome is
true regardless of any future compliance obligation11 or potential change in law. Should
significant investments need to be made at Coyote Station for environmental compliance
purposes, the economic analysis is even more compelling. Consequently, Otter Tail is proposing
to commence the process of withdrawing from its ownership interest in Coyote Station upon
approval of this Preferred Plan with the consummation of that process expected by the end of
11
This possibility arises from the EPA’s Regional Haze Rule. In its planning, the Company is treating the need for
capital investments to comply with that rule as a possibility; however, to be clear, Otter Tail is not taking the
position that such capital investments should be required, nor are we providing an estimate of the likelihood of such
an outcome.PUBLIC DOCUMENT – NOT PUBLIC (OR PRIVILEGED) DATA HAS BEEN EXCISED
Resource Plan 7
2028.
Withdrawing from Otter Tail’s ownership interest in Coyote Station will not be without
challenges, however. Coyote Station is a key baseload resource for the plant’s co-owners.12
Additionally, Otter Tail is the current operator of the plant and is relied upon by the co-owners
for the plant’s safe and efficient operation. Further, Coyote Station is a mine-mouth lignite plant,
which is fully integrated with the mine adjacent to the plant. The mine is owned by Coyote
Creek Mining Company, LLC, a subsidiary of the North American Coal Corporation, which is
not affiliated with any of the Coyote Station co-owners. Finally, Coyote Station is a key source
of union jobs and tax base in Mercer County and North Dakota. Consequently, in addition to
considering customer impact we must also consider the impacts to our Coyote Station co-owners
and these other stakeholders. While these challenges are not insurmountable, they will require
thoughtful consideration and management. We have sought to be measured and deliberate in our
approach to withdrawing from Coyote Station. Through this resource planning process, we are
seeking Commission acknowledgement and understanding of these challenges and risks,
recognizing that Otter Tail’s withdrawal from Coyote Station is demonstrated as the most
reasonable course of action from a resource planning and customer perspective.
Otter Tail’s withdrawal from Coyote Station is justified by our modeling and will also help to
shift the Company’s generation portfolio into a more flexible one, allowing Otter Tail to better
match its operations with the ongoing trends in the MISO market. Shifting the generation fleet’s
focus to dispatchable gas resources and away from coal will help to improve operational
flexibility while hedging market risk. That said, it is also necessary to ensure fuel-secure
generation is available for those times when self-generation is necessary to maintain reliability of
the system. Obtaining gains in reliability is a necessary component of prudent resource planning
12
Ownership shares in Coyote are: 35% Otter Tail; 30% Northern Municipal Power Agency; 25% Montana-Dakota
Utilities Co.; and 10% NorthWestern Energy. Minnkota Power Cooperative, Inc., serves as the agent for Northern
Municipal Power Agency. NorthWestern’s share of the plant is dispatched into the SPP Market with the remainder
of Coyote Station dispatched into MISO.PUBLIC DOCUMENT – NOT PUBLIC (OR PRIVILEGED) DATA HAS BEEN EXCISED
Resource Plan 8
and, to that end, we intend to make key system investments to enable Astoria Station to run on
fuel oil in addition to natural gas. By making an investment in on-site fuel oil storage, Otter Tail
will actually have more generation capacity than we currently have, while providing greater
flexibility to decide whether to dispatch the resource depending on fuel costs and market
conditions. Our analysis supports dual fuel at Astoria Station regardless of the course of action
on Coyote Station.
Otter Tail’s Preferred Plan will make the Otter Tail system more flexible in its ability to respond
to market signals. Flexibility in this context includes the ability to start and stop generation
quickly and less reliance on long term fuel supply commitments. The Preferred Plan provides
sufficient resources to meet our customers’ needs and hedges overall exposure while enhancing
the Company’s ability to take advantage of favorable market dynamics that accrue to our
customers’ short-and long-term benefit. In light of current market dynamics and as a hedge
against the future, Otter Tail’s Preferred Plan also includes the addition of 150 MW of solar and
100 MW of wind as economic resources for the system.
Table 2-3 demonstrates the economic benefits of the Company’s Preferred Plan.
Table 2-3: Coyote Withdrawal NPVRR Comparison*
No Externalities With Externalities
Base Case Preferred Plan Base Case Preferred Plan
Continued Operation ($000) $2,515,096 $2,530,668 $2,971,847 $2,991,608
2028 Withdrawal ($000) $2,466,554 $2,479,385 $2,864,875 $2,909,334
Difference ($000) -$48,542 -$51,283 -$106,972 -$82,274
* Tables 3-5 and 3-6 detail the resource additions included for the plans in Table 2-3.
The figures presented above are the result of EnCompass modeling that forms the foundation for
this resource plan. To prepare for this modeling, the Company conducted numerous virtual
stakeholder group meetings in the states we serve. Otter Tail considered input from those
stakeholders in developing this resource plan. Details of the underlying assumptions and
descriptions of significant components, activities and issues associated with this resource planPUBLIC DOCUMENT – NOT PUBLIC (OR PRIVILEGED) DATA HAS BEEN EXCISED
Resource Plan 9
are documented within the appendices to this filing.
Historically, the Company has advocated for what we describe as a “least cost” resource plan.
However, the selection of such a plan has always involved more than just selecting the lowest
cost option under a single forecasted scenario. Instead, Otter Tail analyzes numerous potential
scenarios in a range of possible “futures.” By considering a variety of scenarios, the Company’s
goal has always been to go beyond a single “least cost” consideration to also consider the various
risks that are inherent in any plan so that we can arrive at a plan that has the greatest likelihood
of being “least cost” under the broadest range of possible futures. It might therefore be more
accurate to say that Otter Tail’s resource planning has been focused on finding the “least
cost/least risk” plan. The Preferred Plan is such a plan.
As with any planning based on forecasts, considerable unknowns and variables outside of any
stakeholder’s control will impact the actual resulting costs. Any long-range plan is subject to
change because it is based on forecasts and assumptions from a specific point in time. As we
continue into this rapidly evolving period influenced by technological advances, efficiency gains,
fuel economics and, not least of all, regulatory influences, speculating on what the “least-cost
plan” looks like using current assumptions carries significant opportunities and risk. These
opportunities and risks relate mostly to actual fuel and market prices, capital costs for
construction, and the future volatility of prices and costs. In this resource plan we have attempted
to present information that our Commissions and other stakeholders can use to give careful
consideration of how best to balance least-cost principles and the cost-related risks and
opportunities inherent in planning.
There is no doubt there will be differences of opinion based upon stakeholders’ various
perspectives. Otter Tail’s goal is to keep customers’ interests in the forefront of this analysis.
We know we share this goal with each of our three Commissions. With this in mind, our
Preferred Plan strikes a balance between several planning objectives - including arriving at a
diversified mix of generation resources that assures reliability, rate stability, stewardship ofPUBLIC DOCUMENT – NOT PUBLIC (OR PRIVILEGED) DATA HAS BEEN EXCISED
Resource Plan 10
resources, and the flexibility to respond to risks and opportunities in this rapidly changing
environment. Table 2-4 below summarizes the key actions in the Preferred Plan. Each of the
items listed is discussed in greater detail in subsequent sections of this filing.
Table 2-4: Otter Tail 2022-2028 Detailed Action Plan
Year Actions
2022 Pursue Withdrawal from Coyote:
Fulfill contractual and legal obligations; assess opportunity to sell
ownership interest in plant
150 MW Solar (in-service 2025):
Development Activities: Secure land, MISO interconnection,
Preliminary Design Permitting
Dual Fuel at Astoria:
Development Activities: Engage engineering firm for studies to
refine cost estimates and the combustion turbine supplier to develop
preliminary schedule including environmental study for permitting
process
2023 Pursue Withdrawal from Coyote:
Fulfill contractual and legal obligations; assess opportunity to sell
ownership interest in plant; assess other actions necessary to withdraw
from plant ownership by end of 2028
150 MW Solar (in-service 2025):
Secure necessary equipment and contracting for construction
Dual Fuel at Astoria:
Enter into agreements for equipment, begin detailed design, seek
construction bids
2024 Pursue Withdrawal from Coyote:
Fulfill contractual and legal obligations; assess opportunity to sell
ownership interest in plant; assess other actions necessary to
withdraw from plant ownership by end of 2028
150 MW Solar (in-service 2025):
ConstructionPUBLIC DOCUMENT – NOT PUBLIC (OR PRIVILEGED) DATA HAS BEEN EXCISED
Resource Plan 11
Dual Fuel at Astoria:
Manufacture equipment and start construction
100 MW Wind (in-service 2027):
Commencing development activities: secure land, MISO
interconnection, preliminary design permitting
2025 Pursue Withdrawal from Coyote:
Fulfill contractual and legal obligations; assess opportunity to sell
ownership interest in plant; assess other actions necessary to
withdraw from plant ownership by end of 2028.
150 MW Solar:
2025 commercial operation
Dual Fuel at Astoria:
Construction and 2026 commercial operation.
100 MW Wind (in-service 2027):
Secure necessary equipment and contracting for construction
2026 Pursue Withdrawal from Coyote:
Fulfill contractual and legal obligations; assess opportunity to sell
ownership interest in plant; assess other actions necessary to
withdraw from plant ownership by end of 2028.
Dual Fuel at Astoria:
2026 Commercial operation
100 MW Wind (in-service 2027):
Construction
2027 Pursue Withdrawal from Coyote:
Fulfill contractual and legal obligations; assess opportunity to sell
ownership interest in plant; assess other actions necessary to
withdraw from plant ownership by end of 2028
100 MW Wind:
2027 Commercial operation
2028 Pursue Withdrawal from Coyote:
Otter Tail expected withdraw from Coyote Station end of 2028PUBLIC DOCUMENT – NOT PUBLIC (OR PRIVILEGED) DATA HAS BEEN EXCISED
Resource Plan 12
3 The Factors Considered in our Planning Analysis.
Otter Tail’s overall rates for electric service are among the lowest in the nation. The Table below
reflects an Otter Tail Total System blended cost of energy paid by Otter Tail’s customers since
2010.13 It shows that our customers have benefitted from our consistent and cost-effective
portfolio of resources over that period. It is important that we continue to be able to operate as
one system, with a generation mix serving all our customers.
Table 3-1: Otter Tail Total System Average Cost of Energy
Paid by Otter Tail Customers since 2010
Calendar Estimated Total
Year System Cost of
Energy ($/MWh)
2010 21.64
2011 22.04
2012 23.43
2013 23.54
2014 26.46
2015 25.18
2016 22.45
2017 23.73
2018 24.68
2019 23.25
2020 18.54
The Preferred Plan identifies the anticipated electric service needs of our customers for the 2022-
2036 planning period, and it includes aspects that are aimed at the emergence of new
opportunities presented by low market prices, low market price forecasts, and low costs for
generation alternatives. It details specific action items that we intend to complete within the first
six years of the planning period.
13
Recovery of fuel costs vary by jurisdiction including the treatment of true-up amounts. For the purposes of this
estimation Otter Tail utilized actual fuel costs per MWh by jurisdiction and weighted them: Minnesota – 50%, North
Dakota 40%, and South Dakota 10% to arrive at an approximate average cost of energy across all our states.PUBLIC DOCUMENT – NOT PUBLIC (OR PRIVILEGED) DATA HAS BEEN EXCISED
Resource Plan 13
In its Order concerning Otter Tail's initial resource plan filing in 1992, the MPUC stated that it
considers the characteristics of the available resource options and the proposed plan as a whole.14
The MPUC has continued this approach in Otter Tail’s subsequent resource plans. In Minnesota
Administrative Rules, Chapter 7843.0500, Subp.3, it states that:
“Resource options and resource plans must be evaluated on their ability to:
A. maintain or improve the adequacy and reliability of utility service.
B. keep the customer's bills and the utility's rates as low as practicable, given regulatory
and other constraints.
C. minimize adverse socio-economic effects and adverse effects upon the environment.
D. enhance the utility's ability to respond to changes in the financial, social, and
technological factors affecting its operations.
E. limit the risk of adverse effects on the utility and its customers from financial, social,
and technological factors that the utility cannot control.”
While this list is taken from Minnesota Administrative Rules, it provides a useful set of factors
from which to consider Otter Tail’s plan in all states; the plan’s success in any state will depend
on how it will maintain and improve reliability, keep rates low, manage the potential for adverse
effects, maintain flexibility, and mitigate risk. These factors could be a simple report card for any
utility and for any resource plan. Therefore, we have incorporated these objectives into the
evaluation of our Preferred Plan.
3.1 Plan Synopsis
Our Preferred Plan is consistent with our 2016 Plan, and it positions the Company well to
manage customer costs, risks, and other negative impacts while maintaining reliable electric
service. At the same time, the resulting diversified, balanced generation portfolio will give us the
14
In the Matter of the Petition of Otter Tail Power Company for Approval of its 1992 Resource Plan, Order
Approving 1992 Resource Plan and Requiring Additions To 1994 Resource Plan, May 19, 1993, MPUC Docket No.
E-017/RP-92-484.PUBLIC DOCUMENT – NOT PUBLIC (OR PRIVILEGED) DATA HAS BEEN EXCISED
Resource Plan 14
flexibility to respond to industry changes and MISO market conditions. The Preferred Plan better
manages risks than would the base case scenario or other scenarios, and it is therefore the most
favorable of the plan scenarios considered.
Otter Tail’s request regarding its interest in Coyote Station
The most notable aspect of the Preferred Plan is Otter Tail’s request for authority to meet
customers’ generation needs through resources that are more flexible in their dispatch and less
likely to require large capital expenditures at Coyote Station. Otter Tail owns a 35 percent
interest in Coyote Station, and it was designed as a baseload generating resource. It therefore has
limitations to its dispatch flexibility. Current and forecasted market conditions present
opportunities to utilities that have greater flexibility in the dispatch of their resources and,
therefore, as part of this filing, we are requesting authority to commence the process of
withdrawing from Coyote Station so that we can increase the flexibility of our portfolio and
reduce costs for our customers. Also, we anticipate Coyote Station may require significant
capital investment to maintain compliance with the Environmental Protection Agency’s (EPA)
Regional Haze Rule and possibly other environmental regulatory requirements.
To be clear, Coyote Station has performed at least as well as it was expected to perform in
previous resource plans, and the costs of Coyote Station have not materially increased from what
was expected at the time of the 2016 Plan. Its costs have been stable, and the results of this
analysis are, therefore, not due to unexpected increases to the costs of operating the plant (with
the exception of the possible costs anticipated to comply with the Regional Haze Rule).
The results of our analysis, and our request, are instead due to market price forecasts and demand
forecasts now being much lower than previous forecasts. Otter Tail has taken advantage of these
low market conditions within the limits of its existing resource portfolio, but current forecasts
reflect that we can lower costs further by increasing the flexibility of our generation portfolio.
Commencing withdrawal from ownership will include monitoring changes to our capacity needs
and other assumptions to ensure withdrawal from Coyote Station will remain prudent.PUBLIC DOCUMENT – NOT PUBLIC (OR PRIVILEGED) DATA HAS BEEN EXCISED
Resource Plan 15
Again, the details of the factors affecting Coyote Station and the evolving market conditions are
considered more fully throughout this filing, and they provide insight on the question of whether
it is preferable to maintain or withdraw from our current interest in Coyote Station to pursue
favorable market opportunities for our customers through more advantageous resources. This
requested authority is not typical of resource plans, but it is also not unique. In Otter Tail’s 2010
IRP,15 a thorough examination was made of the question whether Otter Tail should maintain its
Hoot Lake Plant or retire it to pursue more advantageous alternatives. For purposes of this
resource plan, we have conducted significant comparative scenario analysis in our modeling.
Later in this filing, we also consider factors relating to this decision that go beyond the modeling.
The Preferred Plan
This filing provides an explanation of our analysis, the data and inputs into the analysis and its
results. With this filing we request Commission authority within the legal framework of each
particular state to commence the following key actions in furtherance of the Preferred Plan:
• To add of dual fuel capability at Astoria Station;
• To add of 150 MW of solar generation in 2025; and
• To commence of the process to withdraw from our ownership interest in Coyote Station.
3.2 Load Forecast
The process of developing this resource plan began with an econometric peak demand and
energy requirements forecast, which was used as our Base forecast scenario.
The forecast peak demand and energy requirements are detailed in Appendix B. The energy
requirements forecast represents an approximately 0.46 percent average annual growth rate, prior
to new demand side management (DSM) programs, and it is the key component in determining
15
In the Matter of Otter Tail Power Company’s 2011-2025 Resource Plan, Order Approving Baseload
Diversification Study and Setting Requirements for Next Resource Plan, March 25, 2013, MPUC Docket No.
E017/RP-10-623. The Baseload Diversification Study was a study required by the MPUC for the purpose of
examining alternatives for decommissioning or replacing or repowering Otter Tail’s Hoot Lake Power Plant. The
March 25, 2013 Order authorized Otter Tail to decommission and replace Hoot Lake Plant.PUBLIC DOCUMENT – NOT PUBLIC (OR PRIVILEGED) DATA HAS BEEN EXCISED
Resource Plan 16
the type of resources to be added, whether baseload, intermediate, or peaking. Peak demands are
anticipated to average an annual growth rate of 0.57 percent in the summer, prior to new DSM
programs. The peak demand will determine the size of capacity resources required for the
system. As a participant in the Midcontinent Independent System Operator, Inc. (MISO), Otter
Tail is currently required to maintain a 9.4 percent planning reserve margin on the forecasted
summer peak demand coincident with the MISO’s peak demand, after accounting for plant
accreditation ratings as defined by the MISO.16
When comparing the load forecast from our 2016 IRP to the updated forecast used in this IRP
there is a noticeable reduction in the current forecast. This reduction is a result of energy
efficiency programs. Otter Tail has seen significant demand and energy savings, in excess of
three percent in some years. Another factor contributing to our forecast reductions is a decrease
to firm demand requirements from our large industrial customers.
3.3 Future Resource Needs
Table 3-2 and Figure 3-1 provide the Company’s summer season resource needs showing the
Company’s projected load and capability according to the MISO Module E rules for resource
adequacy. Section 4.4 provides discussion of the MISO Module E and further detail regarding
the resource adequacy obligation calculation.17
The total accredited capacities, shown as Zonal Resource Credits (ZRCs), represent the MISO’s
capacity ratings for the Company’s resources based on the 2021 planning year accreditation
levels. Resource, forward purchase, and demand response accreditations are based on historical
summer performance and do not vary monthly.
16
As noted below MISO is considering changes to its compacity construct.
17
The Module E resource adequacy obligation calculation is: Reserve Obligation = (Coincident Peak Demand
Forecast-Demand Response) x (1+Load Based Reserve Margin) + Transmission Losses, where the reserve margin is
currently 7.6 percent. Total Accredited Capacity is the sum of Aggregate ZRCs, Local ZRCs, External ZRC’s and
Net Transaction ZRCs, where ZRCs are MWs that have been converted to “Zonal Resource Credits.” Under
Module E, only ZRCs are eligible for designation toward the Reserve Obligation.PUBLIC DOCUMENT – NOT PUBLIC (OR PRIVILEGED) DATA HAS BEEN EXCISED
Resource Plan 17
Table 3-2: Summer 2022-2036 Base Case Projected Load and Capability Prior to
Preferred Resource Plan
Line
No. 2022 2023 2024 2025 2026 2027 2028 2029 2030 2031 2032 2033 2034 2035 2036
1 Forecasted Load 672.0 675.6 679.2 682.8 686.4 690.0 693.6 697.3 700.9 704.6 708.3 712.0 715.7 719.5 723.2
2 Transmission Losses 39.0 38.8 38.6 38.6 38.6 38.6 38.5 38.4 38.4 38.5 38.6 38.4 39.0 39.5 40.0
Net CIP Demand
3 Reduction 12.3 23.1 32.8 38.7 44.7 51.4 58.2 64.9 70.9 74.2 77.4 89.2 80.1 72.6 66.2
Total Forecasted
4 Load 698.8 691.4 685.1 682.7 680.3 677.1 674.0 670.8 668.4 668.9 669.5 661.2 674.6 686.3 697.1
MISO Coincident
5 Factor 91% 91% 91% 91% 91% 91% 91% 91% 91% 91% 91% 91% 91% 91% 91%
6 Coincident Load 635.9 629.2 623.4 621.3 619.1 616.2 613.3 610.4 608.2 608.7 609.2 601.7 613.9 624.6 634.3
MISO Planning
7 Reserve 9.4% 9.4% 9.4% 9.4% 9.4% 9.4% 9.4% 9.4% 9.4% 9.4% 9.4% 9.4% 9.4% 9.4% 9.4%
8 Total Obligation 695.6 688.3 682.0 679.6 677.3 674.1 671.0 667.8 665.4 666.0 666.5 658.2 671.6 683.3 694.0
2022 2023 2024 2025 2026 2027 2028 2029 2030 2031 2032 2033 2034 2035 2036
9 Coal 365.5 365.5 365.5 365.5 365.5 365.5 365.5 365.5 365.5 365.5 365.5 365.5 365.5 365.5 365.5
10 Natural Gas / Oil 344.3 344.3 344.3 344.3 344.3 344.3 344.3 344.3 344.3 344.3 344.3 286.7 286.7 286.7 286.7
11 Wind 82.3 82.3 82.3 82.3 82.3 82.3 82.3 78.7 78.7 78.7 78.7 74.0 74.0 74.0 74.0
Solar 0.0 12.3 12.3 12.3 12.3 12.3 12.3 12.3 12.3 12.3 12.3 12.3 12.3 12.3 12.3
Hydro 2.5 2.5 2.5 2.5 2.5 2.5 2.5 2.5 2.5 2.5 2.5 2.5 2.5 2.5 2.5
12 Purchased* 8.5 8.5 8.5 8.5 8.5 8.5 8.5 8.5 8.5 8.5 8.5 8.5 8.5 8.5 8.5
13 Load Management 16.0 16.0 16.0 17.0 18.0 19.0 20.0 21.0 22.0 23.0 24.0 25.0 26.0 27.0 28.0
14 Total ZRCs 819.1 831.4 831.4 832.4 833.4 834.4 835.4 832.8 833.8 834.8 835.8 774.4 775.4 776.4 777.4
*Co-generation, Co-Op Shared, and WAPA
15 Net (Line 14 - Line 8) 123.5 143.0 149.3 152.7 156.1 160.2 164.4 164.9 168.3 168.8 169.3 116.2 103.9 93.2 83.5
Implementation Information
The data in Table 3-2 above and Figure 3-1 below illustrate Otter Tail’s capacity position prior to
plan development in 2021.18 The decrease in Total ZRCs in 2033 is due to the end of
depreciable lives for a number of our peaking plants. The table shows that we have adequate
capacity for the planning period.
Figure 3-1 depicts the Table 3-2 data and includes a solid black line representing Otter Tail’s
current forecast obligation to customers, which incorporates energy efficiency savings. Figure 3-
1 also includes a dotted black line that shows what Otter Tail’s forecast obligation would be if
we recognized no new energy efficiency.
18
Based on the existing resources as of May 31, 2021.PUBLIC DOCUMENT – NOT PUBLIC (OR PRIVILEGED) DATA HAS BEEN EXCISED
Resource Plan 18
Figure 3-1: Current Capacity Resources and Reserve Obligation 2022-2036 (MW)
As shown in Figure 3-1, for 2036, forecasted CIP Demand Reduction is expected to reduce Otter
Tail’s 2036 summer capacity position from 760 MW to 694 MW, approximately nine percent.
3.4 Resource Plan Development
The software model we use for resource plan modeling is EnCompass, which replaced the
Strategist model used for our 2016 Plan.19 Otter Tail’s long-range peak demand and energy
forecasts were incorporated into the EnCompass database, along with the supply-side and
demand-side resources available to the Company over the course of the study period.
EnCompass was then used to develop a series of least-cost resource plans. We defined the
objective function as minimizing total utility costs (i.e., a zero externality scenario) and, for
Minnesota, minimizing total societal costs (i.e., an externality value scenario).
Otter Tail first used the EnCompass software in previous Minnesota proceedings that were approved by the
19
Commission including its forecasted 2021 Energy Adjustment Rider rates in Docket No. E017/AA-20-462.PUBLIC DOCUMENT – NOT PUBLIC (OR PRIVILEGED) DATA HAS BEEN EXCISED
Resource Plan 19
The EnCompass software develops an optimized resource plan for each scenario for the time
period 2022 through 2036. Scenarios were developed, including evaluation of sensitivities that
varied load growth, altered natural gas and energy market prices, adjusted the MISO capacity
requirement, and applied externalities.
3.5 New Resource Alternatives
Otter Tail considers both demand-side and supply-side resources in long-term planning analysis.
Appendix D provides a more detailed discussion of the new resources we evaluated. Table 3-3
provides a list of the alternatives evaluated within the EnCompass model.
Table 3-3: List of Resource Alternatives Included in EnCompass Model
Resource Alternatives Modeled Description
Natural Gas Simple Cycle - Small Generic 49 MW nameplate capacity aeroderivative type simple cycle unit
Natural Gas Simple Cycle - Large Generic 248 MW nameplate capacity frame type simple cycle unit
50 MW nameplate capacity utility-scale wind resource. Generic options as well as
Wind
specific replacement and surplus interconnection options are available.
25 MW nameplate capacity utility-scale solar resource. Generic options as well as
Solar
specific replacement and surplus interconnection options are available.
Stand Alone Battery Storage Generic 25 MW lithium-ion battery storage resource
Paired Battery Storage 10 MW lithium-ion battery storage resource paired with a 25 MW solar installation
3.6 Preferred Resource Plan
Table 3-4 shows preferred 15-year resource plan which includes a request for authority to add
dual fuel capability at Astoria by 2026, add 150 MW of solar in 2025, add 100 MW of wind in
2027, start the process of withdrawing from ownership in Coyote Station, and add 50 MW of
solar in 2033. The Preferred Plan appropriately addresses customer needs and balances other
objectives described in this filing, including, most importantly, low-cost and reliable service for
our customers.PUBLIC DOCUMENT – NOT PUBLIC (OR PRIVILEGED) DATA HAS BEEN EXCISED
Resource Plan 20
Table 3-4: Preferred Resource Plan Summary20
Figure 3-2 below shows the capacity resource additions along with existing resources over the
study period. Figures 3-3 (with externalities) and 3-4 (no externalities) below show the energy
contributions by fuel category for 2022-2036 for the Preferred Plan under the two externality
scenarios. The application of externality penalties to the unit dispatch results in significant
differences in the energy mix between the two scenarios even though both scenarios have the
same set of resources available. In Figures 3-3 and 3-4, the Purchases category (light blue) is
primarily comprised of day-ahead market opportunity purchases (where we can take advantage
of market prices that are lower than our generation costs), while the Forward Purchases (yellow)
represents longer term bilateral contractual purchases.
20
Otter Tail includes three categories for wind and solar projects: (1) generic wind resources require a new
generation site, (2) surplus interconnection wind may be added alongside an existing generating facility where the
generation of both resources does not exceed the existing interconnection amount of the original facility, and (3)
replacement interconnection wind resources reuse the existing interconnection rights of an existing resource that is
retiring.PUBLIC DOCUMENT – NOT PUBLIC (OR PRIVILEGED) DATA HAS BEEN EXCISED
Resource Plan 21
Figures 3-2 through 3-8 below note the significant demand and energy contributions from Otter
Tail’s DSM and energy efficiency programs, which reduce our capacity requirements by 54 MW
in 2025 and by 94 MW in 2036. These reductions have saved our customers significant costs.
We have approved energy efficiency and DSM programs in Minnesota and South Dakota, and all
customers in our three-state service area have benefitted from cost reductions driven by DSM
energy efficiency efforts.
Figure 3-2: Preferred Plan Capacity Resources and Reserve Obligation 2022-2036 (MW)You can also read