APRIL 2021 - Get the Lead Out, Pittsburgh
←
→
Page content transcription
If your browser does not render page correctly, please read the page content below

APRIL 2021

             A
Background
    The American Academy of Pediatrics stated,
    “We now know that there is no safe level of blood lead
    concentration for children, and
    the best ‘treatment’ for lead                                                       As the Centers for Disease Con-
    poisoning is to prevent any ex-                                                     trol and Prevention indicates, “The
    posure before it happens.”                                                          goal is to prevent childhood lead
    Children, especially those un-        “We now know                                  exposure before any harm oc-
                                                                                        curs.” This can be accomplished
    der six years of age, are most
    vulnerable and at risk from          that there is no                               through primary prevention – the

                                      safe level of blood
    lead exposure due to their                                                          identification and removal of lead
    rapid growth and develop-                                                           hazards from the environment be-
    ment. Their impacts from lead
    poisoning include neurodevel-
                                     lead concentration                                 fore a child is exposed.
                                                                                  “Get the Lead Out, Pittsburgh”
    opmental delays and impacts       for children, and the                       (GTLO) is a public awareness cam-
    (behavior and learning prob-                                                  paign designed to shine a light on
    lems, lower IQ, ADD, ADHD),         best ‘treatment’ for                      lead poisoning in Allegheny Coun-

                                       lead poisoning is to
    hearing problems and speech                                                   ty, help families who are impact-
    delays, anemia, weight loss,                                                  ed by lead poisoning and enact
    fatigue and seizures. Further,
    the body sees lead as a nu-
                                     prevent any exposure                         changes to make our community
                                                                                  safer. Primary data describing res-
    trient and absorbs it into the
    bloodstream. Maternal health
                                        before it happens.”                       idential lead sources is important
                                                                                  to protecting public health. Aimed
    impacts from exposure to lead                                                 at gaining a better understand-
    include gestational hyperten-                                                 ing of the primary sources of lead
    sion, spontaneous abortion,                                                   exposure in municipalities across
    low birth weight and impaired                                                 Allegheny County, the campaign
    neurodevelopment. And science informs us that adults         developed a strategy to sample homes for lead in
    may experience negative health effects from lead expo-       the Borough of Wilkinsburg. In the fall of 2019, 65
    sure including cardiovascular issues, decreased kidney       residents were recruited through a combination of
    function and reproductive problems.                          community events, door-to-door canvassing, com-
    Lead is primarily found in paint, dust, soil and water. In   munity networks and social media.
    addition, it can be found in consumer products such as       This report summarizes the findings of those efforts.
    toys, spices, cosmetics and dishware (glazed pottery);
    hobbies such as fishing (weights), hunting (bullets), and    Council on Environmental Health “Prevention of Childhood Lead Toxicity”
    stained-glass work; and jobs that involve working with          (2016) https://doi.org/10.1542/peds.2016-1493
                                                                 https://www.cdc.gov/nceh/lead/prevention/populations.htm
    lead and lead-based products.                                https://www.cdc.gov/nceh/lead/publications/educational_interventions_
                                                                    children_affected_by_lead.pdf
                                                                 https://services.math.duke.edu/education/ccp/materials/diffeq/bodylead/
                                                                    lead1.html
                                                                 https://www.acog.org/clinical/clinical-guidance/committee-opinion/
                                                                    articles/2012/08/lead-screening-during-pregnancy-and-lactation
                                                                 https://www.atsdr.cdc.gov/csem/csem.asp?csem=34&po=10
                                                                 https://www.epa.gov/lead/learn-about-lead
                                                                 https://www.who.int/ceh/publications/leadguidance.pdf
                                                                 https://www.cdc.gov/nceh/lead/prevention/default.htm

1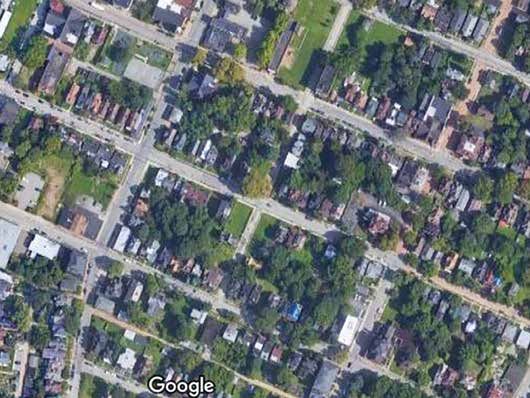
ENVIRONMENTAL
                           INJUSTICE
Wilkinsburg is home to several Environ-
mental Justice communities. The Pennsylva-
nia Department of Environmental Protection defines
Environmental Justice (EJ) communities as “any
census tract where 20% or more individuals live in
poverty, and/or 30% or more of the population is a      striking, especially considering only about 30% of the
minority.” Below is a distribution of EJ communities    census tracts in the county are designated as EJ areas.
in Allegheny County and the Borough of Wilkinsburg.     These are also the areas in which lead poisoning among
                                                        children is more prevalent.
As the maps indicate, Wilkinsburg is centrally locat-
ed, and houses a higher concentration of Environ-       There is a disproportionate impact of lead poisoning on
mental Justice communities. This concentration is       communities of color. The CDC summarizes this cumula-
                                                        tive burden: “Communities of color are at a higher risk of
                                                        lead exposure because they may not have access to safe,
                                                        affordable housing or face discrimination when trying to
                                                        find a safe, healthy place to live. This is called housing
                                                        inequity, and it puts some children, such as non-Hispanic
                                                        Black persons, at a greater risk of exposure to lead.” Ac-
                                                        cording to the 2018 Childhood Lead Surveillance Annual
                                                        Report, 7.47% of “Non-Hispanic black or African Ameri-
                                                        can” and “Hispanic” children in Allegheny County tested
                                                        for lead poisoning before the age of 6 (4,962) in 2018
                                                        had confirmed Elevated Blood Lead Levels. This percent-
                                                        age is 6.3 times greater than the 1.19% of “Non-Hispanic
                                                        white” children in Allegheny County tested for lead poi-
                                                        soning before the age of 6 (15,149) in 2018. In general,
                                                        households with lower incomes, and particularly those
                                                        who are renting, are unlikely to have the financial re-
                                                        sources or legal ability to remediate lead hazards in their
                                                        homes.
                                                        The data suggests that environmental hazards have dis-
                                                        proportionate impacts on populations of color in Allegh-
                                                        eny County and within the Borough of Wilkinsburg. Our
                                                        hope is that the findings of this report will shed light on
                                                        lead hazards found in environmental justice communities
                                                        across Allegheny County and mobilize communities and
                                                        decision makers to take action.

                                                        Pennsylvania Department of Environmental Protection. (2020). PA
                                                         Environmental Justice Areas. https://www.dep.pa.gov/PublicParticipation/
                                                         OfficeofEnvironmentalJustice/Pages/PA-Environmental-Justice-Areas.aspx
                                                        Pennsylvania Department of Environmental Protection. (2020). Environmental
                                                         Justice Areas Viewer. https://padep-1.maps.arcgis.com/apps/webappviewer/
                                                         index.html?id=f31a188de122467691cae93c3339469c
                                                        Centers for Disease Control and Prevention. (2020). Populations at Higher Risk.
                                                         https://www.cdc.gov/nceh/lead/prevention/populations.htm
                                                        Pennsylvania Department of Health. (2020). 2018 Childhood Lead
                                                         Surveillance Annual Report. https://www.health.pa.gov/topics/Documents/
                                                         Environmental%20Health/2018%20Childhood%20Lead%20Surveillance%20
                                                         Annual%20Report.pdf

                                                                                                                                          2
Wilkinsburg
    Demographics:
    According to the 2010 Census, the
    population of Wilkinsburg is 15,930.
    There are 7,076.9 people per square
    mile in the Borough.
    66.6% of the population are African American, and
    28.3% are Caucasian. About 3.2% are of two or          Wilkinsburg Sampling
    more races, 1% are Asian, and less than 0.5% are
    Native American and Pacific Islander. Hispanic or      Project
    Latino people constitute about 1.8% of the popu-
    lation.                                                Each participant volunteered to have a full lead risk
                                                           assessment of their home completed, which included
    There are 10,696 total housing units in the Borough:
                                                           testing for lead in soil, water, paint and dust. Sam-
    9,138 are occupied and 1,558 are vacant housing
                                                           pling was completed by Pennsylvania certified lead
    units. 17% of households have children under the
                                                           inspectors and risk assessors working at two firms:
    age of 18. Almost 49% of all households were made
                                                           Conservation Consultants, Inc (n = 23 households)
    up of individuals, and 14% had someone living alone
                                                           and Accredited Environmental Technologies, Inc. (n
    who was 65 years of age or older. The average
                                                           = 42 households).
    household size in Wilkinsburg is 1.92, and the aver-
    age family size was 2.82.                              For the report, we gathered information from 65 in-
                                                           dividuals, asking each individual to answer 36 ques-
    19% of Wilkinsburg’s residents are under the age of
                                                           tions, in nine broad categories such as occupancy
    18. Residents aged 65 years old or older make up
                                                           and household breakdown by age and size. There
    about 16% of the total population. The median age
                                                           are several particularly relevant factors to note: chil-
    in Wilkinsburg is 41 years old. There are 8,866 fe-
                                                           dren under 6, Elevated Blood Lead Levels (EBLL),
    males and 7,064 males in the Borough. About 38%
                                                           occupancy type, length of occupancy, intention to
    of households are owner occupied and 62% are
                                                           relocate, income range, monthly housing costs and
    renter occupied.
                                                           where residents believe lead may exist in their home.
    The median household income in the Borough
                                                           Out of the 65 respondents, 29% noted that they
    is $36,743, which is much lower than the median
                                                           have children under 6 in the home; however, sever-
    household income of $61,043 for Allegheny Coun-
                                                           al of these respondents noted that they have sev-
    ty. The per capita income for the borough is about
                                                           eral children under 6 in the home for a total of 26
    $30,455. About 24.5% of the total population are
                                                           children under 6 accounted for. Just over 10% re-
    below the poverty line.
                                                           spondents noted that they were aware of someone
    According to the Allegheny County Health Depart-       in their household having an EBLL. With respect to
    ment, from 2015-2018 there were 929 children un-       occupancy type, 52% were renters and 48% were
    der 6 years of age who were screened for lead poi-     homeowners. Length of occupancy ranged from 0.5
    soning in the Borough. Of that, 58 children (6.24%)    years to 55 years and residents averaged 11.3 years
    had a confirmed elevated blood lead level (EBLL).      of occupancy. When asked whether or not they had
    Comparatively, an average of 1.84% of children un-     the intention to relocate, 7% said yes, 91% said no
    der 6 years of age tested in Allegheny County had      and 2% said maybe.
    confirmed EBLLs.

3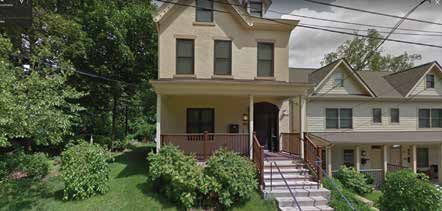
For income range, 63 respondents provided answers. The income range and corresponding
percentage are listed below:

         Income Ranges of Respondents
                         RANGE 5
                         $75,000+                                                 RANGE 1

                         13%                                                      Less than $15,000
                                                                                  19%

          RANGE 4
          $45,000 – $75,000
          14%

                                                                                   RANGE 2
                                                                                   $15,000 – $25,000
             RANGE 3                                                               26%
             $25,000 – $45,000
             25%

64 of 65 respondents recorded their monthly hous-        65 homes. Samples were evaluated on the basis
ing costs which ranged from $55 to $3,000 and            of detection (concentrations above or below the
averaged $972 per month. Assessing participants          limits of the detection equipment), exceedance of
beliefs regarding their personal lead risk, about 25%    recommended regulatory thresholds and the raw
believed they had lead paint within their property,      observed concentration.
about 28% believed they had lead in their drinking       Highlights indicate that lead was detected in at least
water, 23% believed they had lead in their soil, 9%      one source in 88% of households. Lead concen-
believed they had lead in dust, 5% believed they         trations in paint, dust (on floors), water and soil (for
had a lead-free home and 78% said they were un-          produce gardens) exceeded recommended levels
sure whether or not there was any lead present in        in 78%, 46%, 2% and 6% of sampled households,
the home.                                                respectively. Table ES-1 summarizes additional
Individual participants were notified of their results   highlights from the sampling effort. The remainder
and provided with appropriate guidance on how to         of this report provides additional summaries of the
protect themselves from lead exposure. In addition,      sampling results.
participants were invited to a community meeting         Biomarkers (such as blood specimens) of potential
held by the GTLO campaign, where they could ask          lead exposure were not collected. As a result, this
specific questions regarding their results. At the       report cannot draw associations between the pres-
community meeting, attendees received a home             ence of lead in the built environment and occupant
cleaning kit and water pitcher certified to remove       health effects. Thus, this report is limited to char-
lead from drinking water.                                acterizing the presence and concentration of lead
This report summarizes the sampling results for all      relative to regulated thresholds.

                                                                                                                    4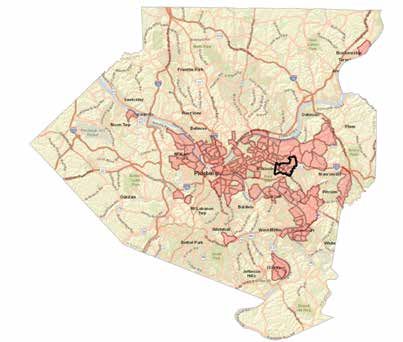
Summary of findings:
     Table ES-1: Summary of sampling for lead in 65 households in Wilkinsburg, PA in the fall of 2019.
               Households   Positive    Households with at least one sample        Average       Minimum and
      Source   sampled      samples     exceeding regulatory thresholds            result        maximum result

      Paint        65           51      51 above definition for lead-based paint   6 mg/cm2      1 to 36 mg/cm2

      Dust         65           39      Hazard levels                              6 mg/cm2      11 to 13,000 microg/ft2
                                        30 above level for floors
                                        5 above level for window sills
                                        1 above level for window troughs

      Water        64           26      1 above action level                       6 microg/L    1 to 40 microg/L

      Soil         19           19      Hazard levels                              1,500 mg/kg   40 to 14,000 mg/kg
                                        4 above level for edible garden
                                        0 above level for play areas
                                        4 above level for other areas

    Analyzing Lead Samples                                       previous studies have found no safe levels of lead. For
                                                                 this reason, many of the federal action levels are not
    for Detection Limits                                         health based nor health protective. Thankfully, the EPA
                                                                 lowered its lead dust and paint standards for both risk
    Lead concentrations fall either above or below the
                                                                 assessments and clearance testing in 2019 and 2020,
    detection limit of the equipment and methods used.
                                                                 respectively. This followed recent findings of increased
    “Negative” and “positive” samples fall below and
                                                                 blood lead levels and cases of childhood lead poison-
    above the detection limits, respectively. Detection lev-
                                                                 ing between floor dust lead of 10 μg/ft2 (current, new
    els vary by equipment and methods used to measure
                                                                 standard) and 40 μg/ft2 (previous standard).
    lead concentrations.
                                                                 Positive samples may exceed regulated thresholds.
    A negative reading does not guarantee that no lead is
                                                                 While paint is a primary lead source, lead that is encap-
    present. The detection limits of certified testing equip-
                                                                 sulated is not necessarily a hazard. Thus, paint sam-
    ment and methods must fall below hazard or action
                                                                 ples that exceed the federal definition of lead paint, or
    levels. While negative samples have concentrations
                                                                 1 mg/cm2, are often considered a precursor to poten-
    below action levels determined by federal agencies
                                                                 tial exposure. Lead observed in dust and soil indicates
    such as the U.S. Environmental Protection Agency,
                                                                                          previous or existing lead paint
                                                                                          has been compromised, in-
                                                                                          creasing exposure risks. Fed-
                                                                                          eral agencies set health-based
                                                                                          hazard or action levels for lead
                                                                                          in dust and soil, which vary by
                                                                                          source and sample location.
                                                                                          In addition to paint, lead may
                                                                                          leach into drinking water from
                                                                                          lead plumbing and fixtures.
                                                                                          Lead in drinking water is regu-
                                                                                          lated by the U.S. Environmen-
                                                                                          tal Protection Agency.

5
Figure 1 summarizes the potential outcomes for any                                described as “negative,” meaning the concentration
given sample, and Table 1 summarizes the regulatory                               of lead in the tested surface is somewhere between 0
thresholds used in this report. As an example, consid-                            and the detection limit of 10 mg/ft2. The second and
er sampling for lead in dust on floors with equipment                             third readings could be labeled “positive” because
that can detect lead concentrations as low as 10 mg/                              each is above the detection level. However, only the
ft2. Three samples are taken throughout the home:                                 third reading is above the regulatory level.
one is below the detection level and the others are
14 mg/ft2 and 170 mg/ft2. The first reading would be

                                                           Threshold for hazard, action, or
                                                            definition of lead-based paint

                                              Detection limit                                 Concentrations above the hazard or action level
                                          (varies by equipment)

         Concentrations below the detection limit                  Concentrations above the detection limit are called “positive” samples
             are called “negative” samples

 0                                                   lead concentration increases from left to right

            Figure 1: Lead concentrations fall above or below detection limits. Positive samples
                                    may exceed regulatory thresholds.

                                                                                                                                                6
SOURCES OF LEAD EXPOSURE
    Paint Lead that is encapsulated in intact paint
          presents a lower exposure risk than lead
                                                                household were 6, 1, and 10, respectively. Lead in
                                                                dust was detected on at least one surface in 60% of
    coming off of paint that may be compromised. Com-           households.
    promised lead paint ends up in dust inside homes and
                                                                Figure 2 shows concentrations of lead in dust for 39
    in soil outside of homes. Thus, sampling in all three
                                                                households testing positive for lead. Dust samples
    sources – paint, dust and soil – is needed to indicate
                                                                exceeded regulatory thresholds for floors, windowsills
    exposure risks. Households with lead in interior paint
                                                                and window troughs in 30, 5, and 1 households re-
    and dust samples exceeding recommended levels
                                                                spectively. Single samples of lead in five homes ex-
    suggest interior lead-based paint may be compro-
                                                                ceeded 5,000 micrograms per ft2 on floors, which is
    mised and be an exposure risk. Similarly, homes with
                                                                more than 10 times the recommended threshold.
    lead in exterior paint and soil samples exceeding the
    recommended levels suggest exterior paint may be            Figure 2 also describes the condition of the exterior
    compromised and may be an exposure risk. Impor-             paint as whether a majority of paint was intact. The
    tantly, lead detected in dust or soil may come from         condition of interior paint does not appear to signifi-
    sources other than compromised existing lead-based          cantly influence the lead concentrations in dust, as
    paint, such as previous coats of paint or historical off-   indicated by homes with the highest dust levels con-
    site industrial sources.                                    taining mostly intact paint. However, the condition as
                                                                described by Figure 2 represents the share of sam-
                                                                ples intact across the entire home, whereas the dete-

    dust Allon 65floors,
                    homes were sampled for lead in dust
                         windowsills and window troughs.
                                                                rioration of lead paint into dust may vary by room or
                                                                even across surfaces within a given room. Similarly,
    The number of samples taken varied by household             the concentration of lead in paint may vary by room
    depending on household size and characteristic. The         and surface.
    average, minimum, and maximum dust samples per

7
One of the two inspectors (Accredited Environmental        1, and 30 mg/cm2, respectively. The average, min-
Technologies, Inc) reported results for paint samples      imum, and maximum exterior concentrations were
below the regulatory definition of lead-based paint (1     7.7, 1, and 36 mg/cm2, respectively. There was no
mg/cm2). Whereas the second inspector, Conserva-           obvious relationship between the lead in paint con-
tion Consultants, Inc., reported only paint samples        centration and the paint condition.
that fall above the regulatory threshold of 1 mg/cm2.      Figure 3 shows ranges in observed lead concentra-
In order to maintain consistency, all paint samples        tions in interior and exterior paint by household, where
provided by Accredited Environmental Technologies,         households are grouped by indicators of whether any
Inc that fell below 1 mg/cm2 were removed from the         dust and soil levels exceeded recommended thresh-
data unless otherwise noted. As a result, all paint        olds. At the household level, Figure 5 indicates that
samples presented in this report fall above regulatory     the concentration of lead paint does not affect wheth-
thresholds unless otherwise noted.                         er dust or soil samples exceed action levels. How-
All 65 homes were sampled for lead in paint. An av-        ever, as described above, correlations between con-
erage of five and 17 samples were taken on various         centrations of lead in paint, soil and dust may not be
interior and exterior surfaces, respectively. Lead paint   meaningful at the household scale given expectation
was detected in 51 households. The average, mini-          variation by location and surface within households.
mum, and maximum interior concentrations were 6.5,

                                                                                                                      8
Figure 4 shows the relation-
    ship between lead in interior
    paint and dust by room for
    locations where the inspec-
    tion reports clearly indicat-
    ed dust and paint samples
    were taken from the same
    room. Figure 4 shows a
    moderate positive associ-
    ation between lead paint
    concentration and lead in
    dust. This association does
    not change with the paint
    condition.

9
SOIL Lead soil samples were collected at 19 of
65 (29%) participating households. Each of
recommended thresholds for other areas. One home
was sampled for lead in a play area, which did not ex-
the 19 households sampled tested positive for lead ceed recommended levels. One household demon-
in soil. Inspectors did not collect soil samples where strated two positive samples ranging from around
there was no obvious outdoor area to occupy, such as 5,000 mg/kg to 14,000 mg/kg, which is 60 and 12
apartment buildings with no common outdoor space. times the recommended level for sampled areas (gar-
If present, samples were taken from play areas and den and other area).
edible gardens. Samples were also taken from “oth- Figure 5 also identifies the condition of the exterior
er” locations with at least nine square feet of topsoil, paint. The condition of the exterior paint does not
according to sampling standards. appear to significantly influence the surrounding soil
Figure 5 shows ranges in sampled soil concentration concentration, consistent with the expectation that
by household. Of these, four exceeded recommend- lead in soil comes from multiple sources (e.g. industri-
ed thresholds for edible gardens, and four exceeded al pollutants) and not exclusively from lead paint.
Figure 5: Concentrations of lead in soil 19 households testing positive for lead in soil.
10wAter Lead water samples were collected at
64 of 65 participating households. For
A majority of households (n = 39 or 60%) tested
negative for lead in drinking. First and second draws
each sampled household, two samples were taken tested positive for 26 (40%) and 8 (12%) households,
from the cold water tap in the kitchen. The first sam- respectively. Figure 6 shows the variation in mea-
ple – or “first draw” – was taken following at least sured concentration of lead in water for the 26 posi-
eight hours of stagnation. The second sample – or tive households. Water in only one household tested
“second draw” – was taken after flushing the cold wa- above the action level of 15 micrograms per L.
ter plumbing for at least five minutes.
Figure 6: Concentrations of lead in drinking water in 26 households testing positive for lead.
11Next Steps
The Get The Lead Out campaign continues to meet
with the Borough of Wilkinsburg and staff to update
Policy Recommendations
them on the report findings. Following the sampling Preventing exposure to lead is key to solving lead
project, a summary was presented to the Wilkins- poisoning. Primary prevention strategies largely in-
burg Planning Commission on February 4, 2020. clude policies and procedures that require:
According to the Borough of Wilkinsburg website, n Identification and remediation of lead hazards in
“The Planning Commission plays a crucial role in the built environment
developing recommendations for implementing
change in land use and promoting responsible land n Safe (wet) demolition, renovation, repair and
use practices. The Planning Commission reviews painting practices
proposed development plans and ensures the n Replacement of lead water service lines
compliance of those plans with the Borough’s Zon- There are a number of policies that may be imple-
ing Ordinance and Subdivision and Land Use Reg- mented as tools to protect community members
ulations and makes recommendations to Borough from lead exposure. The Borough of Wilkinsburg
Council.” The Wilkinsburg Planning Commission has a number of these tools in place, putting them
consists of seven members who are all residents among a number of Allegheny County municipali-
of the Borough. At the February 2020 meeting of ties with a promising opportunity to integrate lead
the Wilkinsburg Planning Commission, they passed safety into their existing codes, programs and re-
a motion to adopt the ‘Get The Lead Out, Wilkins- quirements.
burg’ initiative to raise awareness in the community
about the dangers of lead, where it is found and *Those in blue are tools Wilkinsburg already has
how it can be avoided. in place, but do not necessarily include lead
safety requirements at this time.
12HOUSING an inspection for safety and health standards. Adding
lead-specific protocols to these inspections can be eas-
Proactive Rental Inspections (PRI) ily accomplished.
One of the most effective municipal strategies to reduce Before new tenants are permitted to move into a Wilkins-
lead poisoning is a Proactive Rental Inspection (PRI) burg rental property, the owner of the property must
program. These inspections for lead hazards in rental obtain an occupancy permit that is conditioned on a
housing are commonly included in a municipality’s rental code inspection and correct any cited violations. The in-
property occupancy permitting, licensing or registration spection carried out by code enforcement staff includes
processes, and are strategically implemented in high- a visual assessment for interior and exterior peeling
risk areas. The inspections may include any of the fol- paint per the International Property Maintenance Code,
lowing protocols, in order of increasing technicality: which ensures deteriorated paint, that may or may not
Visual Assessment – Inspecting the residence for any be lead-based, will be cited and remediated. Testing for
peeling, flaking or chipping paint on the interior or exte- other lead hazards, such as lead-contaminated dust, is
rior of a home not conducted as part of these inspections currently.
Dust Wipe Sampling – Identifying the number of mi- Due to household dust being the leading source of child-
crograms of leaded dust per square foot near high fric- hood lead poisoning, it is recommended that Wilkins-
tion surfaces (i.e. doors or windows) and areas where burg explore the integration of dust wipe sampling into
occupants spend large amounts of time the inspection protocol for occupancy permits.
Lead Risk Assessment – Sampling all potential sourc- Rental Registry
es of lead (paint, dust, water, soil and household items) A rental registry is an inventory with accurate contact in-
and providing recommendations to reduce risk of ex- formation for all rental properties so that property own-
posure ers/managers can be reached in the event of an emer-
Proof of lead dust wipe clearance and visual gency or to facilitate code compliance activities, such
inspection as scheduling proactive rental inspections. Rental reg-
Lead dust wipe sampling and visual inspections are istries also sometimes incorporate property inspections
recommended for PRI programs when taking both mit- into the registration process, when such inspections are
igation of risk and cost effectiveness into consideration. not otherwise implemented under other programs.
This twofold inspection protocol may be conducted by In the Borough of Wilkinsburg, rental property owners
a third-party technician or municipal code enforcement must annually renew registration of their units by com-
officer with lead inspection training. Obtaining sample pleting a “Tenant Registration Application” that requests
results below the federally defined hazard levels – or a information about both the property owner and tenants.
successful clearance test – may be required before re- Because code inspections already occur during their
ceiving an occupancy permit or registration for a rental occupancy permitting process, there is no need to in-
property built before 1978. Results may also be shared tegrate lead testing into the registration. However, ac-
on a public database in order to inform the decisions of cess to accurate contact information for both the rental
prospective tenants. property owners and tenants will facilitate success in
Certificates of Occupancy enforcing the remediation of lead hazards required by
the occupancy permitting program.
A certificate of occupancy is a permit issued to certi-
fy that a property meets all applicable codes such as
building or zoning regulations. Proactive rental inspec-
tions are commonly incorporated into the occupancy
permitting process. Occupancy permits often require
13in place to ensure that demolitions are conducted in a
WORK PRACTICES lead-safe manner. Municipalities in Allegheny County
can fill this gap by including cost-effective, lead-safe
demolition standards in the demolitions that they car-
Proof of RRP Certification ry out and permit.
The 2010 federal RRP Rule requires that renovations, Below is a summary of the five key stages of a lead-
repairs and painting in pre-1978 homes, childcare safe demolition, per a report released in August 2019
centers and preschools be performed by firms who by the Institute of Politics and Lead-Safe Demolition
are certified in lead-safe work practices. The RRP Rule Working Group. These recommendations apply to
also requires that individuals and firms must be RRP both private and public demolitions.
certified through an EPA accredited program. Typical-
Pre-demolition: All supervisory personnel must be
ly, the EPA enforces this rule on a complaint-driven
trained in lead abatement and all workers must be
basis; however, under-reporting and lack of federal
accredited lead hazard reduction workers according
resources have impeded effective enforcement. Al-
to the state DEP.
though authorized to enforce the RRP Rule directly,
Pennsylvania has not undertaken enforcement of the Deconstruction: Contractors must deconstruct
Rule, nor have most municipalities. On the local level, specific housing components by hand, wrap debris
municipalities can enforce this rule through partial or thoroughly and transport it off site.
full implementation, outlined below: Demolition: The municipal staff or independent con-
Partial Implementation: Verify RRP certification tractor monitors lead emissions in air, soil and water
upon application for building permits. before, during and after demolition.
Full Implementation: Adopt RRP rule into housing Post-demolition: At the conclusion of demolition,
code and enforce violations of the code. debris must be wetted, covered and transported to
an EPA-approved landfill.
It is recommended that Wilkinsburg consider partial
implementation by requesting contractors apply for Ongoing Site Safety: Pending redevelopment of the
building permits from the Borough to show proof of site, a ground cover that grows to a short height and
RRP certification. requires little maintenance must be in place.
It is recommended that the Borough of Wilkinsburg
consider a first step towards this model procedure:
Demolition Requirements the wet-wet-wet method. This method includes wet-
Cities across the nation have instituted lead-safe dem- ting structures built before 1978 with water before,
olition protocols to prevent exposure to lead hazards during and after the demolition in order to reduce lead
that are caused by demolitions. In Allegheny County, dust falling in the surrounding area. A requirement for
municipalities and private parties conducting demoli- this protocol could be included in the specifications
tions must ensure that demolitions are done in an as- for public demolitions and proof of this method could
bestos-safe manner. However, there are no protocols be required before issuing private demolition permits.
14WATER associated with short-term increases in lead levels in
drinking water and has not been found to decrease
Moratorium on partial lead service line risk for blood lead levels in children. Studies published
replacements in Environmental Science Technology now show long-
The U.S. Lead and Copper Rule regulates the amount term increases in lead in water levels as well.
of lead in drinking water. Many water systems across The Borough of Wilkinsburg is encouraged to pass
the nation are working to replace lead pipes in order a resolution urging water systems serving their res-
to reduce lead in water levels. Some of these unfor- idents to place a moratorium on partial lead service
tunately include partial lead service line replacements, line replacements, as well as partner with stakehold-
where the piping from the curb to the interior of the ers to support applications for funding, such as the
home is left in place. PennVest grants that will be available to water sys-
According to the Centers for Disease Control and Pre- tems across Pennsylvania in early 2021 for full-service
vention, partial lead service line replacement has been line replacements.
15CONCLUSION
In summary, this project demonstrates that lead is
present in multiple sources, including paint, dust, soil and
water in properties and homes in the Borough of Wilkinsburg. We look
forward to collaborating with the Borough of Wilkinsburg leadership on
the recommendations put forward in this report and working together
to create a lead-safe community for all Wilkinsburg residents.
16References
American Academy of Pediatrics
www.aap.org/en-us/advocacy-and-policy/aap-health-initiatives/lead-expo-
sure/Pages/Lead-Exposure-in-Children.aspx
Braun JM, Yolton K, Newman N, Jacobs DE, Taylor M, Lanphear BP. Residen-
tial dust lead levels and the risk of childhood lead poisoning in United States
children. Pediatr Res. 2020 Jul 28. doi: 10.1038/s41390-020-1091-3. Epub
ahead of print. Erratum in: Pediatr Res. 2020 Oct 30;: PMID: 32722664.
Centers for Disease Control and Prevention (CDC)
www.cdc.gov/nceh/lead/prevention/default.htm
CA (State of California). 2009. “Revised California Human Health Screening
Levels for Lead.” Office of Environmental Health Hazard Assessment. oehha.
ca.gov/media/downloads/crnr/leadchhsl091709.pdf.
EPA (US Environmental Protection Agency). 2000. “Economic Analysis of Toxic
Substances Control Act Section 403: Lead-Based Paint Hazard Standards.”
www.epa.gov/sites/production/files/documents/403_ea_d21.pdf.
———. 2008. “Lead and Copper Rule: A Quick Reference Guide.” www.epa.
gov/dwreginfo/lead-and-copper-rule.
HUD (U.S. Department of Housing and Urban Development). 2012. “Guide-
lines for the Evaluation and Control of Lead-Based Paint Hazards in Housing.”
www.hud.gov/sites/documents/SECOND_EDITION_2012.PDF.
U.S. Census Bureau. 2019. “QuickFacts: Wilkinsburg Borough, Pennsylva-
nia.” https://www.census.gov/quickfacts/wilkinsburgboroughpennsylvania
“U.S.C. Title 15 - COMMERCE AND TRADE.” n.d. Accessed April 10, 2020.
www.govinfo.gov/content/pkg/USCODE-2009-title15/html/USCODE-2009-ti-
tle15-chap53-subchapIV-sec2681.htm.
Western Pennsylvania Regional Data Center. 2010. “Allegheny County En-
vironmental Justice Areas.” https://data.wprdc.org/dataset/environmental-jus-
tice-census-tracts
MISCELLANEOUS NOTES
The condition of one paint sample for household 87954 was not reported. All
other samples were reported as “intact.” This report assumes that the paint
was intact for sampling missing information.
Units for one dust sample for household 16107 reported as “microgram per
wipe.” This report assumes these units are equivalent to “microgram per ft2,”
as demonstrated by the remaining dust samples.
Learn more:
Gettheleadoutpgh.org
1718
19
You can also read