Assessment of Potential Land Suitability for Tea (Camellia sinensis (L.) O. Kuntze) in Sri Lanka Using a GIS-Based Multi-Criteria Approach - MDPI
←
→
Page content transcription
If your browser does not render page correctly, please read the page content below
agriculture
Article
Assessment of Potential Land Suitability for Tea
(Camellia sinensis (L.) O. Kuntze) in Sri Lanka Using a
GIS-Based Multi-Criteria Approach
Sadeeka Layomi Jayasinghe 1,2, *, Lalit Kumar 1            and Janaki Sandamali 3
 1    School of Environmental and Rural Science, University of New England, Armidale, NSW 2351, Australia
 2    Department of Export Agriculture, Faculty of Animal Science and Export Agriculture, Uva Wellassa
      University, Passara Road, Badulla 90000, Sri Lanka
 3    Department of oceanography and marine geology, Faculty of Fisheries and Marine Sciences & Technology,
      University of Ruhuna, Matara 81000, Sri Lanka
 *    Correspondence: ljayasi2@myune.edu.au; Tel.: +61-040-535-5742

 Received: 6 May 2019; Accepted: 5 July 2019; Published: 8 July 2019

 Abstract: The potential land suitability assessment for tea is a crucial step in determining the
 environmental limits of sustainable tea production. The aim of this study was to assess land suitability
 to determine suitable agricultural land for tea crops in Sri Lanka. Climatic, topographical and soil
 factors assumed to influence land use were assembled and the weights of their respective contributions
 to land suitability for tea were assessed using the Analytical Hierarchical Process (AHP) and the
 Decision-Making Trail and Evaluation Laboratory (DEMATEL) model. Subsequently, all the factors
 were integrated to generate the potential land suitability map. The results showed that the largest
 part of the land in Sri Lanka was occupied by low suitability class (42.1%) and 28.5% registered an
 unsuitable land cover. Furthermore, 12.4% was moderately suitable, 13.9% was highly suitable and
 2.5% was very highly suitable for tea cultivation. The highest proportion of “very highly suitable”
 areas were recorded in the Nuwara Eliya District, which accounted for 29.50% of the highest category.
 The model validation results showed that 92.46% of the combined “highly suitable” and “very highly
 suitable” modelled classes are actual current tea-growing areas, showing the overall robustness of this
 model and the weightings applied. This result is significant in that it provides effective approaches to
 enhance land-use efficiency and better management of tea production.

 Keywords: AHP; DEMATEL; climate; land suitability; soil; tea; topography

1. Introduction
     Land evaluation is a foundation for sustainable land resource planning, management and finding
optimum land use for each defined land unit [1]. Land cover is the biophysical features of land and the
land use refers to the socio-economic functions of land to meet human needs [2,3]. Appropriate land use
decisions are vital to achieving optimum land productivity and ensuring environmental sustainability.
This requires an effective management of land information on which such decisions should be based [4].
The Food and Agricultural Organization [5,6] recommended a land suitability assessment approach for
crops in terms of suitability ratings ranging from very highly suitable to unsuitable based on climatic
and terrain data, as well as soil properties. Land suitability evaluation according to FAO standards has
been applied in many parts of the world, particularly in the developing countries.
     The planting of tea in Sri Lanka has been carried out since 1860 and it has become the mainstay
of the island’s economy [7]. Of the agricultural land, 40% is used for plantation agriculture—of
which 28% is used for tea cultivation [8]. The major constraints of the tea sector in Sri Lanka are the
limited area of suitable terrain, which keep land prices high and the average estate size small, and

Agriculture 2019, 9, 148; doi:10.3390/agriculture9070148                     www.mdpi.com/journal/agriculture
Agriculture 2019, 9, 148                                                                                2 of 26

labor shortage [9]. Thus, the selection of land according to its suitability has become increasingly
important in making the best use of available land for tea cultivation. Farmers establish tea based
on prior knowledge and experience, without the availability of scientific information and validation.
So, farmers definitely consider site suitability but using a different set of information. This adversely
impacts on tea production and, in the long run, would exacerbate the existing economic, social, and
environmental problems related to the tea sector.
      Further, land use activity contributes to climate change and the impact of climate and natural
disasters has increased in recent decades due to improper land use in Sri Lanka [10]. Tea cultivation in
Sri Lanka is clearly vulnerable to climate change and extreme events, and this has resulted in some of
the existing tea land area becoming unsustainable for tea cultivation and, by contrast, existing marginal
land has been morphed into cultivated land [11]. Other ramifications of climate change are receiving
longer dry seasons, uneven rainfall distribution, and erosion of top soil caused by uncharacteristic
heavy rainfall patterns, which can lead to negative effects on production. In addition, crop-weed
competition, the spread of pests and diseases, drought damage, soil losses and infertility in tea fields
fostering the increased use of fertilizers to maintain the soil fertility, resulting in an increase in the cost
of production and posing a threat to the tea industry [12,13]. Commercial tea growing in Sri Lanka,
limited to a few areas, is at risk due to climate change and its subsequent fallouts. Consequently,
the expected production in response to the demand may not be as easy as in the earlier days under
given potential constraints on the availability of suitable tea lands [14].
      This situation has also aggravated the current status of tea cultivation in Sri Lanka through
construction and other human activities and, correspondingly, there is a great risk of a lower return
on investment in tea cultivation [15]. For example, forest areas and tea lands in hilly areas have been
converted for human settlement and the cultivation of annual crops, which has resulted in soil erosion,
soil infertility, landslides and floods. The National Building Research Organization (2015) identified
that seven tea-growing districts of Sri Lanka (i.e., Badulla, Nuwara Eliya, Kegalle, Ratnapura, Kandy,
Matale and Kalutara) are subjected to severe landslides that demarcate nearly 12,000 km2 (21%) of the
total area of Sri Lanka. Therefore, the extent of the major tea producing area is apparently threatened
and not sustainable to produce a high quantity of tea to cater for global demand. Moreover, land use
policies in Sri Lanka are not designed to ensure that economies of scale in production and cropping
and that farming systems are sustainable in the long run [16]. Also, the productivity of fertile lands
has been reduced due to improper land use [10] and this can lead to the mismanagement of natural
resources and degradation of the environment with other socio-economic conflicts [17].
      Under the current economic trends and the nature of commercialization, tea planters and related
companies are more interested in converting the estate bungalows into tourist hotels, cutting down
trees in the estates for timber, extracting granite and other mineral resources and selling the land at the
end [18]. The public railed against some multipurpose development projects especially implemented in
hilly areas (i.e., the irrigation project of Uma oya) for wreaking unsafe levels of environmental damage
and thus thousands of acres of tea lands are becoming unusable or less suitable for tea growing [19].
Hence the responsible authorities should shoulder the responsibility to take initiatives to only make
use of the unproductive tea lands for the above-mentioned activities, leaving the suitable lands for
the long-term sustainability of tea cultivation. Approximately 80% of the population concentrated in
the tea plantation sector are Tamil people who immigrated to Sri Lanka from South India during the
British colonial era in the 19th century. Most of the workers in the tea estates reside within the estate
area itself and work as laborers. The clusters of the labor lines are strategically located in different parts
of the tea estate to enable quick labor deployment and to protect the boundary of the tea plantations.
But with the increase of population in communities attached to the tea industry, tea plantation workers
demand land for constructing their own settlements and fight for their rights for lands as they have
no choice [20]. Sometimes they establish their settlements illegally in tea lands, clearing the existing
tea cultivation and adjacent forest areas. Thus, it is obvious that immediate steps must be taken to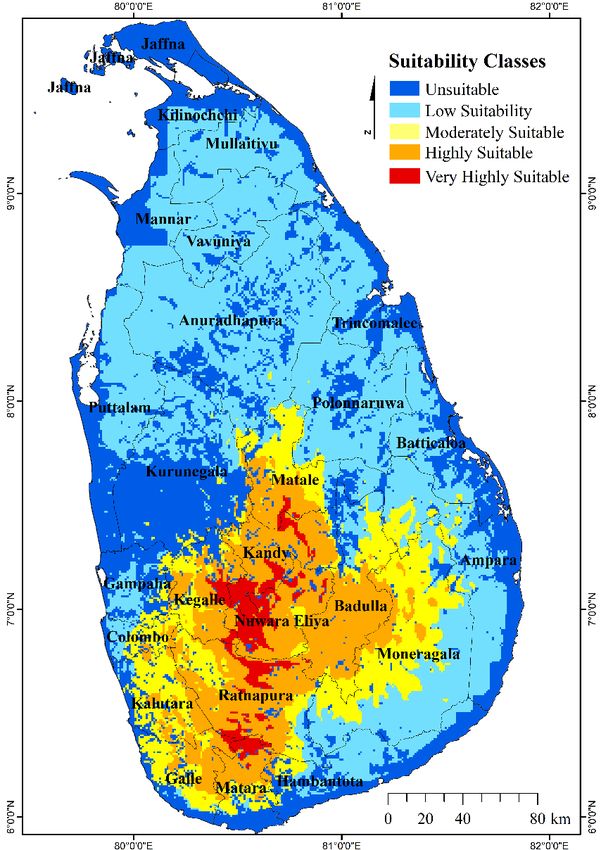
Agriculture 2019, 9, 148                                                                                3 of 26

form a national policy and strategy on these circumstances by giving special reference to the land
management practices in tea plantations.
      In conjunction with the above circumstances, the existing tea-growing areas in Sri Lanka that were
identified in the early 1940s may not be suitable for tea anymore or some other areas may have suitable
conditions to grow tea. The total land area under tea cultivation was estimated to be approximately
221,969 hectares in 2016 [12], but the area under tea has decreased by 10% from 1946 to 1982 [8]. Based
on the figures given by Food and Agriculture Organization (FAO) Statistical Databases [13], we estimate
that the tea cultivation area decreased by 2.6% from 1961 to 2016 while other tea producing countries
substantially increased their cultivation extent. The land area for tea cultivation in Sri Lanka has
not increased compared to other tea producing countries like Kenya, China and India, which creates
difficulties in competing in the international market in the future [14]. Therefore, urgent attention has
to be drawn to implement proper land use planning and to work on suitability analysis for tea in order
to upgrade the productivity and to avoid land use-related problems in tea cultivation [21].
      In the global context, a number of studies have been undertaken to assess the land suitability
assessment for tea crops. In Kenya, a land use assessment was done for tea, particularly in Kirinyage
region using the MaxEnt Species Distribution Model [17], quantitative and economic land suitability
has been assessed for tea in Gulian province in Iran using the Square root and the Storie methods [18],
and the land suitability assessment was conducted in the Kabarole District of Western Uganda for tea
and food crops using a model built in Automated Land Evaluation System (ALES) software by means
of decision trees [19]. A comprehensive suitability evaluation was carried out by Bo, Zhang [22] for
tea in Southern China using the Geographic Information System (GIS) and modified land ecological
suitability evaluation model, providing the scientific basis and reference for the rational distribution
of the tea crops, while Gahlod, Binjola [20] carried out an evaluation for tea, cardamom and rubber
cultivations in Kerala, making use of environmental and variety of soil physio-chemical parameters.
These types of studies provide information on the constraints and opportunities for the use of the land
and therefore guide in decision making on optimal utilization of land resources [23].
      The present land use pattern in Sri Lanka is a legacy of the land policy of the colonial past,
where export-based commercial plantations like tea were superimposed on a traditional subsistence
farming system. Today, the tea industry is considered as one of the largest agro-based industries in
Sri Lanka and the land suitability assessment will help to achieve maximum sustained production.
Until recently, many decisions on land use matters in Sri Lanka were taken on an ad hoc basis, using
the local knowledge and intuition of the officers concerned. An inadequate number of studies have
been conducted to enable informed decisions on the proper utilization of lands for tea plantation in Sri
Lanka, and they have not taken the factors of topography, soil, climate and management into account.
The first such attempt was made by Panabokke [24], who identified the main regions for tea and rubber.
This gave a general assessment of the land suitability for tea, but no criteria of suitability were given [25].
Jayathilaka, Soni [26] generated crop suitability maps for tea, amalgamating yield maps and climatic
factors maps using the Analytic Hierarchy Process (AHP) in multi-criteria analysis under two times
frames of 1980–1992 and 1993–2007. The selected study area only covers five agro-ecological zones
(AEZs) between the coordinates of 6◦ and 7◦ 30’N latitude and 79◦ 50’ to 81◦ E longitude. They only
considered climate parameters such as temperature, rainfall, relative humidity and evapotranspiration
with yield factors whereas our study addresses climatic as well as topographical and soil parameters
in order to study the suitability of land for tea. Land Utilization Committee and Tea Commission
of Sri Lanka conducted a comprehensive assessment of the unsuitability of tea plantation lands
and the feasibility of rehabilitation and diversification in 1968 considering available data for slope,
rockiness, soil depth, drainage, soil erosion, nutrition status, rainfall and temperature. A case study
was undertaken to classify and to map the tea-growing areas in Ratnapura District [27], but climatic
factors were not taken into consideration for this study.
      Also, land use planning for tea by individual site assessment using the traditional method is
subjective and a time-consuming procedure [27,28]. Although a few studies have been undertaken [25,
Agriculture 2019, 9, 148 4 of 26
29,30] to map the suitability of lands for tea cultivation, they did not cover the entire tea-growing
region of the country. In the given context, no initiative has yet been taken by the Sri Lankan Tea
Research Institute to classify land or existing tea-growing areas to varying degrees of suitability.
It is usually difficult to make a detailed and precise analysis because of the inappropriate
understanding of evaluation factors and weights in practice [31]. The availability of GIS and
Multi-Criteria Decision Analysis (MCDM) methods allows the combination of knowledge from
different sources to support land use planning and management [32,33]. The most commonly used
MCDM are the AHP, weighted linear combination, ordered weighted averaging, ELECTRE, DEMATEL,
PROMETHEE, VIKOR and multiple-objective land allocation [34,35]. The AHP has advantages over
conventional multi-attribute utility methods, consisting of the hierarchical breakdown of the particular
decision problem and the use of subjective and verbal expressions to determine the relative importance
of the criteria [35]. The main drawbacks of the AHP indicated by literature are potential internal
inconsistency and the dubious theoretical base of the rigid 1–9 scale, together with the possibility of
rank reversal following the introduction of a new alternative [36,37]. Also, the AHP is incapable of
finding the interdependence between criteria which does not address the influences and effects that
each of them has on other factors. The DEMATEL method is generally used to establish interactive
relationships among criteria [38–40]. In addition, this allows to estimate both the importance of criteria
and shows the causal relations of factors [41]. This method was originally developed by the Science
and Human Affairs Program of the Battelle Memorial Institute of Geneva between 1972 and 1976 [42].
DEMATEL technique has been used in a broad spectrum of fields because of its capacity to handle
complex relationships between components of a system [43].
Compared with other MCDMs, the DEMATEL method has many advantages such as it effectively
analyzes both direct and indirect effects among different criteria, understands the cause and effect
relationships in the decision-making problem, is able to visualize the interrelationships between
factors via a causal diagram, and enables the decision maker to clearly understand which factors have
mutual influences on one another. The DEMATEL method can be used not only to determine the
ranking of alternatives, but also to find out critical evaluation criteria and measure the weights of
evaluation criteria [42]. Although the AHP can be implemented to rank alternatives and determine
criteria weights, it assumes the criteria are autonomous and their interactions and dependencies are
not considered. The DEMATEL technique also has some drawbacks compared to other techniques
of MCDMs. It determines the ranking of alternatives based on interdependent interactions between
them, but other criteria are not included in the issue of decision-making. It cannot take into account the
aspiration level of alternatives or obtain partial ranking orders of alternatives. Therefore, DEMATEL
has been incorporated with other MCDM techniques to combine other necessary characteristics in
many previous studies [43]. A combined AHP–DEMATEL technique has been used approximately the
globe in many land suitability assessments [44–47].
The land suitability assessment for tea is important for identifying the potential areas for
maximizing the production and to suggest ameliorating measures for better crop management [20].
The suitability analysis allows recognizing marginal suitable areas which facilitate decision makers
to identify limiting factors and enable them to formulate appropriate management decisions (i.e.,
new planting, replanting, infilling, diversification, and adopting climate-friendly best practices) for
increasing the productivity of the land. An exhaustive study needs to be carried out to determine
appropriate land use in the unproductive estates giving due consideration to other factors. Also,
this allows stakeholders to identify new areas where tea can be planted in accordance with the
requirements of the tea crops, emphasizing the qualities of the land unit. Hence, matching crop
requirements with available resources through land suitability analysis has become an urgent need to
sustain agricultural land productivity in Sri Lanka.
The previous sections show that no comprehensive study has been undertaken in Sri Lanka to
look at land suitability for tea cultivation using both physical (soil properties and topography) and
climate factors. This shows the need for the rationalization of land use, where the available land shouldAgriculture 2019, 9, 148 5 of 26
be selected according to the crop requirements and it has become enormously important in making the
best use of the land available in Sri Lanka for tea cultivation. Therefore, in this study, an attempt has
been made to assess the land suitability for tea in order to ensure the long-term progression in the tea
sector towards a sustainable tea production. The geographical information system-based multi-criteria
approach was used to identify potential, suitable and unsuitable areas and information about the type
of limitation (s) facing the utilization of the land for tea cultivation. The research value and novelty
of this study is the simultaneous utilization of the AHP and DEMATEL methods to assess the land
suitability for tea crops.
Agriculture 2019, 9, x FOR PEER REVIEW 5 of 26
2. Methodology
approachand
2.1. Data Sources was General
used to identify potential, suitable and unsuitable areas and information about the type
Methodology
of limitation (s) facing the utilization of the land for tea cultivation. The research value and novelty of
2.1.1. thisArea
Study studyandis the simultaneous utilization of the AHP and DEMATEL methods to assess the land
Climate
suitability for tea crops.
The whole of Sri Lanka was considered as the study area. Attention has to be drawn in particular
2. Methodology
to the effect of rainfall and temperature as they are considered as delimiting and significant factors
upon land 2.1.use
DatainSources
Sri Lanka. mean monthly temperature range is 25–30 ◦ C in coastal areas and
TheMethodology
and General
◦
15–18 C in the highlands. The Southwest and Northeast monsoons play a major role in annual rainfall
2.1.1. Study Area and Climate
in Sri Lanka, which ranges from 900 to 5000 mm per year [48].
Red-yellowThe podzolic
whole of Srisoils
Lanka was considered
(leached lateriticas soils)
the study
canarea. Attention
be found in has
thetoWetbe drawn
Zone in andparticular
reddish brown
to the effect of rainfall and temperature as they are considered as delimiting and significant factors
earth (nonlateritic loamy soils) is present in the Dry Zone. Reddish brown
upon land use in Sri Lanka. The mean monthly temperature range is 25–30 °C in coastal areas and 15–
latosolic soils (partially
laterized soils)
18 °C inorthe immature
highlands. brown loamsand
The Southwest (clayey loams)
Northeast are available
monsoons in Central
play a major Hills.
role in annual Alluvials
rainfall in occur
along the Sri
lower
Lanka,courses of rivers
which ranges fromand 900 tothe5000regosols (sandy
mm per year [48]. soils) occur in the coastal tracts [28].
GuidelinesRed-yellow
given podzolic
by Food soilsand(leached lateritic soils)
Agriculture can be found in [5]
Organization the Wet
were Zone and reddish
used to conductbrown the land
earth (nonlateritic
laterized soils) loamy soils)
or immature brown is present in
loamsclimaticthe Dry
(clayey loams) Zone. Reddish
arewere
available brown
in to latosolic
Central soils (partially
Hills. Alluvials occur of land
assessment process. Topographic, soil and factors used evaluate the suitability
along the lower courses of rivers and the regosols (sandy soils) occur in the coastal tracts [28].
for tea. NineGuidelines
criteria were used for land suitability classification for tea crops in Sri Lanka. These
given by Food and Agriculture Organization [5] were used to conduct the land
were selected based on existing
assessment process. Topographic, literature and
soil and viewsfactors
climatic of local
wereexperts. These the
used to evaluate criteria were
suitability of basically
land soil
factors (soil
for type,
tea. NinepH, depth,
criteria weretexture,
used fordrainage (permeability)),
land suitability variables
classification for tea crops inrelated to topography
Sri Lanka. These were (slope,
selected
elevation and landbased
use)onand
existing literature
climatic and views
factors of local
(rainfall andexperts. These criteriaThe
temperature). wereexisting
basically land
soil factors
use map was
(soil type, pH, depth, texture, drainage (permeability)), variables related to topography (slope,
used to identify areas with physical limitations for tea cultivation and this allowed us to distinguish
elevation and land use) and climatic factors (rainfall and temperature). The existing land use map was
potential used
areastothat linkareas
identify ranges
with andphysicalthreshold
limitations values
for teafor other relevant
cultivation characteristics
and this allowed (i.e., climatic,
us to distinguish
soil and terrain
potentialrequirements) to tea
areas that link ranges andcrop suitability
threshold values for ratings. The summary
other relevant characteristicsof(i.e.,
steps usedsoil
climatic, in the land
and terrain requirements) to
suitability assessment is presented in Figure 1. tea crop suitability ratings. The summary of steps used in the land
suitability assessment is presented in Figure 1.
Precipitation
Climatic Downscaling and Interpolation Temperature
parameters
Elevation
Topographic Digital Elevation Model (DEM) Slope
Parameters
Soil Depth
Soil Texture
Soil Parameters GIS Processing Soil pH
Soil Drainage
Soil Type
Standardization Analytical Hierarchy Process (AHP)
+ Decision Making Trial and Evaluation
Weighted Scoring Method: Laboratory (DEMATEL) + GIS
AHP-DEMATEL
Weighted Overlay Reclassification –FAO Standard Incorporation of Land Suitability Map
Land Use
Constraints Field Verification
FigureFigure 1. Process
1. Process forfor analysis of
analysis of the
thesuitability
suitabilityof land for tea.
of land for tea.
Agriculture 2019, 9, x; doi: FOR PEER REVIEW www.mdpi.com/journal/agricultureAgriculture 2019, 9, 148 6 of 26
The above set of layers were prepared to assess the suitability of the land for tea cultivation in Sri
Lanka. The layers were combined using GIS-based MCDA [32]. This involved five main steps: (1) data
acquisition, (2) defining crop requirements for tea in relation to the selected criteria (Table 1), (3) the
reclassification of criterion maps using Spatial Analyst Reclassify tool, (4) the weighting of criteria
according to importance using the pairwise comparison method using the Analytic Hierarchy Process
(AHP) and DEMATEL method, and (5) the standardized criterion maps are combined/aggregated by
means of the weighted overlay technique and vector overlay analysis.
2.1.2. Crop Requirements and Classification Procedure
Suitability ratings were established according to FAO [49] classification on the appropriateness of
land for defined uses in five different suitability classes defining very highly suitable, highly suitable,
moderately suitable, low and unsuitable conditions. Table 1 shows the extent to which a particular
factor influences the growth of tea crops directly or indirectly.
The most critical environmental factors for tea are temperature and rainfall as tea growth and
productivity are mainly controlled by water availability and temperature [26,50–52]. The tea plant
requires a minimum rainfall of 1200 mm per year, but 2500–3000 mm per year is considered optimum [53].
The distribution of rainfall is very important in countries with rain-fed tea production systems, such as
Kenya, Sri Lanka and India. Rainfall in Sri Lanka consists of monsoonal, convectional and expressional
rainfall. Among them, monsoons play a major role in the share of the annual rainfall [54]. The mean
annual rainfall is less than 900 mm in the south-eastern and north-western (driest) parts of the island,
and it is over 5000 mm in the western slopes and the central highlands. However, since the distribution
of rainfall throughout the year is distinctly bi-modal due to the seasonality of the monsoons, some
areas experience a continuous dry period of approximately 2–3 months [55]. In addition, tea-growing
areas are expanding rapidly and a large proportion of this expansion is taking place in areas where the
main limitation is soil moisture. Hence, the water deficit is and will continue to be a major limiting
factor in tea production [56].
The growth of the tea plant is highly affected by temperature ranges. Tea yield is sensitive to
increased average monthly temperatures, and sustained periods of higher temperatures reduce tea
yield. Tea grows well within an air temperature (Ta) range of approximately 19–23 ◦ C. Air temperatures
below 13 ◦ C and above 30 ◦ C have been found to reduce shoot growth [52,57]. Most of the country’s
central region (i.e., Nuwara Eliya, Badulla, Kandy) has the best temperature for growing tea.
Tea is also grown across a range of elevations, from sea level up to approximately 2200 m above
sea level (a.s.m.l). The elevations at which tea grows greatly affects the quality and quantity of
tea [53,58]. The difficult climatic conditions found at these extreme altitudes are highly favorable
for the development of aromas, as the cold nights and misty peaks slow the growth of the tea plant,
resulting in a higher concentration of aromatic oils and richer flavors. The elevation above 2000 m is
considered to be moderate areas of suitability, as it involves infrastructure and other practical problems
in plucking tea. In addition to that, as the elevation increases above 2000 m, the air gets colder, the soil
gets harder and the land gradient makes less rainwater available. These factors inevitably reduce tea
crop yield. Low-lying areas ranging from 0 to100 m are considered inappropriate for tea because they
flood much more frequently in the rainy seasons [59] and are unfavorable for growth of tea.
The main effect of the slope aspect on surface runoff and erosion is due to differences in the
microclimate [60]. Also, Khormali, Ayoubi [60] found that the slope position had a significant impact on
soil properties such as soil moisture, clay content, total N, calcium carbonate content and exchangeable
Mg. The land with a slope of between 15–25◦ is considered as very highly suitable class while gentle
slope (>5–7◦ ) is regarded as highly suitable for tea. The class of “very steep slope” (more than 35◦ )
is considered as unsuitable for tea. More flatlands and steeper slopes are advisable to be avoided
because steeper slopes provide a major risk of soil erosion and landslide while flatlands will increase
water-logging conditions, which is undesirable for tea growth [61].Agriculture 2019, 9, 148 7 of 26
The variety
Agriculture 2019, 9, x of
FORsoil types
PEER on which tea is cultivated successfully makes it very difficult to fit the
REVIEW
soils into a general classification. This is further complicated by the various descriptive terms and
systems used Tablearound the world
9. The values in soil classification.
of significance We classified
and relationship indicators forsoilcriteria
into five
andmajor classes based on
their weights.
its suitability for tea, according to the literature [28,62]. The Red Yellow Podzolic soils (Ultisol in the
Sum
U.S. Soil Taxonomy) dominate existing Sum of tea EachlandsSignificance
in Sri Lanka atRelationship
an altitude of more than 600 a.m.s.l.
Successive
This soil occurs in a variety of landforms
Criteria Column of such as undulating,
Indicator plains, rolling lands,
Indicator dissected
Average Ratesrolling
Scales
Rows of Di
plains, hills with moderately steep the slopes,
rj Matrixridge and valley formations,
(di+rj) (di-rj)high massive hills, and also
Matrix
steep slopes (i.e., central highlands). Reddish brown latolic soils (partially laterated soils) or immature
Temperature 3.752 3.008 6.760 0.745 3.752 0.161
brown loams (clayey loams) are also suitable for tea growth [28].
Rainfall 4.216 3.325 7.541 0.891 4.216 0.181
Tea is grown in soils that differ from country to country, with soil pH being the most important
Elevation
feature. The pH requirement3.347 for the2.632
growth of tea is 5.979 0.716 [20,63]. The
in the range of 4.5–5.5 3.347
optimum soil 0.144
Soil Type 3.020 2.421 5.441 0.599
conditions recommended for tea growth include a well-drained, deep and well-aerated soil with more 3.020 0.130
Slope
than 2% organic matter2.736 [64]. Other characteristics
2.570 5.306
have to be considered 0.166for economic2.736 tea production, 0.118
pH 1.792 2.547 4.339 -0.755
including field slope, soil gravel percentage in the top 50 cm of the soil layer and rockiness. Soil depths 1.792 0.077
Drainage
of less than 50 cm,1.676 soil gravel of more 2.436
than 50% in top 4.111
50 cm of the -0.760 1.676
soil layer and a rockiness 0.072
of 20%
Depth 1.420 2.181 3.601 -0.761
negatively affect tea growth. Tea plants growing in shallow and compacted soils are likely to suffer 1.420 0.061
Texture 1.313
from drought and waterlogging during2.121
the rainy months 3.434
[65]. Due to the -0.808
unavailability1.313
of data, organic0.056
matter, rockiness and soilThreshold gravity were value
not=taken
0.287into account in the land suitability ∑ assessment.
= 23.272 1.00
In Figure 2, the criterion of rainfall has the highest significance indicator value followed by
2.2. Criteria Layers
temperature, Creation
elevation and slope, indicating that these are the most important criteria for the land
suitability
The vector-formatted tea
assessment for worldin Sri
soilLanka. Thedownloaded
data were lowest position fromindicator value is attained
GeoNetwork@fao.org by depth
(accessed on
and
13 texture. Further,
November 2018) and the relationship
then clipped to indicator allows
the Sri Lanka to set
border. a degree
Vector of influence
files were of the analyzed
then converted to raster
parameters
layers on other
with 30-m cell parameters. In Figuretables
resolution. Attribute 2, rainfall
werehas the greatest
created including positive
pH (5 pHvalue of relationship
classes), soil type
indicator,
(5 which1means
classes where thatsuitable
is highly it has afor dominating,
tea and 5 iscausal influence
not suitable on the
for tea other criteria.
cultivation), texture The
(1 value
organic,of
d -r segregated the flexibilities into two groups: cause group and effect
2 heavy, 3 medium and 5 light and there is no marginal class, as only 4 classes were available) and
i j group. According to the
relationship
depth (5 depthindicators
classes).(Figure 2 and Table 9), rainfall, temperature, elevation and slope belong to the
causeThe group,
30-mand haveelevation
digital a significant
datainfluence
(DEM) were overobtained
the criteria
from of the
pH,global
soil type, drainage, depth
multi-resolution and
terrain
texture.
elevation data 2010 (http://lta.cr.usgs.gov/GMTED2010; accessed on 13 November 2018). Slope raster of
the studyThe final criteria
area was weights
derived fromwere achieveddata
the elevation by calculating each criterion’s
(both in degrees) using ARCaverage weight
GIS version in both
10.4.1 [66].
techniqueslayer
Elevation as shown in Table 10
was classified intoand
fiveapplied
classesinwith
the land-use
regard to suitability
the productionfor teaperformance
crops. Rainfall (21.6%)
of existing
followed
tea by temperature
cultivation areas, expert (18.56%)
advice and and elevation (16.69%)[67].
previous studies highly
Thecontributed
slope was also to the land suitability
classified into five
evaluation than other criteria. The least impact
classes based on tea-growing ability (See Table 1 and Figure 2). on the evaluation of land suitability for tea was the
texture, accounting for 3.8%.
1
Rainfall
0.8 Elevation
Relationship Indicator (di-rj)
Temperature
0.6
Soil Type
0.4
0.2 Slope
0
-0.2 3 4 5 6 7 8
-0.4
-0.6
Depth Drainage
-0.8
Texture pH
-1
Significance Indicator (di+rj)
Figure
Figure 2. Causal diagram
2. Causal diagram for
for nine
nine criteria
criteria used
used for
for the
the land
land suitability
suitability assessment
assessment for
for tea.
tea.
Agriculture 2019, 9, x; doi: FOR PEER REVIEW www.mdpi.com/journal/agricultureAgriculture 2019, 9, 148 8 of 26
Table 1. Crop requirements for tea in relation to the selected criteria.
Range of Suitability (From Very Highly Suitable (5) to Unsuitable (1)) References
Criteria
Very Highly Suitable Moderately Suitable
Highly Suitable (4) Low Suitability (2) Unsuitable (1) [6,68]
(5) (3)
Soil Parameters
Soil depth 50–100 10–50 100–150 >150 25–35 (Steep Slope) >35 (Very steep Slope) [6,63,71]
Slope) Slope)
Own
elaboration
Elevation 600–2000 m 300–600 m 2000–2500 m 100–300 m 0–100 m
based on Xin,
Youhua [67]Agriculture 2019, 9, 148 9 of 26
Raster maps for temperature and rainfall were downloaded from WorldClim (1950–2000) (http:
//www.worldclim.org/; accessed on 13 November 2018). Maps for mean temperature for 12 months
were downloaded and annual precipitation was computed. Mean monthly temperature was calculated
using the raster calculator and then final maps were clipped and two climate rasters were reclassified
according to five classes of suitability as defined in Table 1 and Figure 2.
Land use map 2007 was obtained from the Department of Agriculture, Sri Lanka, and it was
used to produce the final land suitability map for tea crops. All raster layers used in this study were
projected into the Kandawela Sri Lankan national projection system. All data layers were at 30-m
spatial resolution prior to being used in modelling or overlaying to extract statistics.
2.3. Determination of Weights
As mentioned in the introduction section, a number of methods exist for the determination of
weights for the criteria. In this study, we used the Analytical Hierarchical Process (AHP) and the
Decision-Making Trail and Evaluation Laboratory (DEMATEL) methods to calculate the weights. Each
of these methods has strengths and weaknesses, and utilizing two methods is expected to give more
balanced results.
2.3.1. The Analytic Hierarchy Process (AHP)
Weights were allocated for each criterion using the Analytical Hierarchy Process (AHP) introduced
by Saaty [72]. The AHP uses a fundamental measurement of 9 points to express individual preferences
or judgments [72] and creates a matrix of pairwise comparisons (Table 2). A value of 1 expresses
“equal importance” and a value of 9 is given over another factor for those factors which have “extreme
importance” (Table 2).
Table 2. Scale of relative importance according to Saaty [73] (Note: 1 is the highest importance and 9 is
the least importance).
Intensity of Importance Definition Description
1 Equal importance Two factors contribute equally to the objective
Moderate importance of one factor Experience and judgment favor each other
3
over another slightly
Experience and judgement strongly favor one
5 Strong or essential importance
over the other
Experience and judgement very strongly favor
7 Very strong importance one over the other. Its importance is
demonstrated in practice
The evidence favoring one over the other is of
9 Extreme importance
the highest possible validity
2,4,6,8 Intermediate values When Compromise is needed
The weight for each factor was calculated through a pairwise comparison matrix and the maximum
eigenvalues (λmax ) of normalized matrix were computed. The consistency index (CI) was estimated
using the formula: CI= (λmax -n)/(n-1) [73]. The random consistency index (RCI) (Table 3) was used
to determine the degree of consistency or consistency ratio (CR) (i.e., CI/RCI). If the CR value is less
than or equal to 0.1, the inconsistency is acceptable, or the pair-wise comparison may be revised [74].
Accordingly, weights were assigned relevant to the importance of criteria for tea based on expert ideas
and literature [75].
Table 3. Random Consistency Index (RCI).
n 1 2 3 4 5 6 7 8 9 10 11 12 13 14 15
RCI 0 0 0.58 0.90 1.12 1.24 1.32 1.41 1.45 1.49 1.51 1.48 1.56 1.57 1.59Agriculture 2019, 9, 148 10 of 26
2.3.2. Decision-Making Trial and Evaluation Laboratory (DEMATEL)
The DEMATEL method was used to deal with the importance and causal relationships among
the criteria, and to recognize the influential criteria of the land suitability assessment for tea. In this
research, the software of MATLAB and Excel 2013 were used to estimate six major measures in the
DEMATEL technique. First, three respondents were asked to assess the direct influence between
any two criteria. The measurement criteria of 0, 1, 2, 3, and 4 were used to illustrate no influence,
very low influence, low influence, high influence and very high influence, respectively [76]. Secondly,
the direct-influence matrix was constructed based upon the degrees of relative impact derived from
the pair comparisons Equation (1). An initial direct-influence matrix (A) with the directly observed
relations was obtained where aij denotes the degree of impact of the i factor on the j factor [40]. As
the third step, the normalized matrix was obtained from Equations (2) and (3) where all the matrix
diagonals are equal to zero and the sum of each row and column does not exceed 1. Then, the full
relationship matrix (T) was derived from Equation (4). The significance and relationship indicators
were estimated summing each column and row using Equations (5) and (6).
a11 . . . a1 j . . .
a1n
.. .. ..
. . .
A = ai1 . . .
aij . . . ain
(1)
.. .. ..
. . .
an1 · · · anj · · · ann
X = s.A (2)
1 1
s = min Pn , Pn
(3)
max i j=1 aij maxi i=1 aij
T = X + X2 + . . . Xk = T = X(1 − X)−1 (4)
n
P
!
h i
D= Ti j = di (5)
j=1 nX1
n
!
P h i
R= Ti j = rj (6)
i=1 1Xn
Here, di is the sum of each row in T and the rows show the degrees of direct and indirect impact
over the other criteria, and rj is the sum of each column in T where columns indicate the degrees
of influence from the other criteria. Numeric algorithm variable di , therefore, represents the factors
that influence the others, rj represents the factors that are influenced by others, di + rj represents
the strength of relationships between factors, di − rj represents the strength of influences among
factors [43]. Subsequently, a threshold value to ignore the minor effects is necessary to isolate the
relationship structure of the factors and finally to obtain causal diagram [77]. The threshold value
helps in distinguishing some important and unimportant criteria. Only the values greater than the
threshold value were highlighted and selected for illustrating the causal diagram.
2.4. Aggregating Criterion Weights and Standardized Criterion Maps
The land adaptation map for tea was created using the “weighted overlay” spatial analysis tool in
Arc GIS by assigning a given weight to each criterion. Each raster was assigned a percentage influence
depending on its importance as defined by the average weights of the AHP–DEMATEL analysis (Table
10). The weight is a relative percentage, and the sum of the percentage influence weights must add
up to 100. Each cell value was multiplied by its percentage influence and then added to create the
output raster.Agriculture 2019, 9, 148 11 of 26
The formula used to calculate land unit’s suitability index was as follows Equation (7);
X
Si = Xi × W i (7)
where, Xi = values of each criterion, Wi = weight values of each criterion, and Si = suitability index
As the final step, the constraint criteria were taken into account. The existing land use map of Sri
Lanka was used to assess the condition of restrictions on land use for tea growing. The evaluation
of land use classes was based on factors affecting the cultivation of tea. Therefore, the existing land
use classes were classified in which “1” was for possible appropriate land use classes for tea such as
existing tea-growing areas, crop lands, etc., and “0” was where tea could not be grown (i.e., urban,
rock, bare lands, open water, wet lands, paddy, roads, etc.). A raster map was then developed. The
newly developed land use restriction map was overlaid with the rasterized suitability map.
2.5. Validation of the Results
The validation method used here concerned whether the selected crop had already been produced
or grown in the region and a subjective comparison was made [65]. The final suitability map produced
from the model was verified to ensure that the model corresponded to the actual conditions in the field.
Existing tea-growing areas were extracted from the land use map of Sri Lanka. Using the “geometry
intersection” tool in Arc GIS software, each suitability class was intersected with the layer of existing
tea-growing area. We calculated the percentage of existing tea-growing areas that were intersected
with each of the modelled suitability classes. If a high percentage of modelled “very highly suitable”
and “highly suitable” areas fell within the actual tea-growing areas, we assumed that our results were
more valid.
3. Results
3.1. Results of the Multi-Criteria Analysis-AHP
The criteria were weighted and scored in terms of their importance for tea cultivation in the
preparation of the model. Tables 4 and 5 show the comparison matrix and the calculated weights of
the criteria. The overall consistency ratio (CR) of 0.09 was below the 0.10 ratio, suggesting that the
judgement had a reasonable level of consistency.
Table 4. Matrix comparing the relative importance of land use requirements for tea cultivation.
Criteria Temperature Rainfall Elevation Soil Type Slope pH Drainage Depth Texture
Temperature 1 1 2 3 3 5 7 7 7
2
Rainfall 1 2 3 3 5 7 7 7
Elevation 1 3 3 5 7 7 7
Soil Type 1 3 3 5 5 5
Slope 1 3 5 5 5
pH 1 3 3 3
Drainage 1 3 3
Depth 1 3
Texture 1
Sum 4.9 3.2 6.3 11.3 13.9 23 35.5 38.3 41
(The numbers show the rating of the row factors relative to the column factor). Note: for example, rainfall is more
important for tea cultivation than soil texture. (If the soil texture is “a,” then the rainfall value can be given as “7a”
and the raw value is “7”).Agriculture 2019, 9, 148 12 of 26
Table 5. Analytical Hierarchical Process (AHP) analysis for the assessment of the relative importance of climate, soil and topography parameters; normalized matrix
with results.
Criteria Temperature Rainfall Elevation Soil Type Slope pH Drainage Depth Texture Total Priority Vector Influence %
Temperature 0.20 0.16 0.32 0.27 0.22 0.22 0.20 0.18 0.17 1.93 0.21 21.4
Rainfall 0.41 0.32 0.32 0.27 0.22 0.22 0.20 0.18 0.17 2.29 0.25 25.4
Elevation 0.10 0.16 0.16 0.27 0.22 0.22 0.20 0.18 0.17 1.67 0.19 18.5
Soil Type 0.07 0.11 0.05 0.09 0.22 0.13 0.14 0.13 0.12 1.05 0.12 11.7
Slope 0.07 0.06 0.05 0.03 0.07 0.13 0.14 0.13 0.12 0.81 0.09 9.0
pH 0.07 0.06 0.03 0.03 0.02 0.04 0.08 0.08 0.07 0.50 0.06 5.5
Drainage 0.03 0.05 0.02 0.02 0.01 0.01 0.03 0.08 0.07 0.32 0.04 3.6
Depth 0.03 0.05 0.02 0.02 0.01 0.01 0.01 0.03 0.07 0.25 0.03 2.8
Texture 0.03 0.05 0.02 0.02 0.01 0.01 0.01 0.01 0.02 0.18 0.02 2.0
Eigenvalue (λmax ) = 10.0, Consistency Index (CI) = 0.13, Consistency Ratio (CR) = 0.09.Agriculture 2019, 9, 148 13 of 26
3.2. Results of the Multi-Criteria Analysis-DEMATEL
Table 6 presents the ratings assigned to individual pairs of criteria based on the expert participatory
method. Then, the normalized direct influence matrix (X) was calculated according to Equation (4)
(Table 7) and the matrix of total relations (T) is given in Table 8. DEMATEL has the ability to complete
the matrix by obtaining direct and indirect relations from each pair of alternatives. With reference to
Table 9, values in the (di + rj ) column show the total effect of each main factor on the whole system.
Correspondingly, rainfall acquires high influence compared to other criteria. Similarly, values in the (di
− rj ) column, divide all criteria into cause and effect groups based on their values. The (di + rj ) values
of all criteria are greater than the threshold value, indicating the importance of these criteria to use in
the land suitability assessment process for tea.
Table 6. The initial direct influence matrix (A).
Criteria Temperature Rainfall Elevation Soil Type Slope pH Drainage Depth Texture
Temperature 0 4 3.33 2.33 0 1 0.33 1 0.67
Rainfall 3.67 0 2.67 2.33 1.67 2 2.67 0 0
Elevation 3 2.33 0 2.33 2.33 0.67 0.67 0.33 0.33
Soil Type 0 0 0 0 0 3.33 2.67 2.33 2.67
Slope 0.33 1 3.67 0.67 0 1 1.67 1.33 0.33
pH 1 1.33 1 3.33 0.67 0 1 0.33 1
Drainage 0 0.67 1 2.33 1.33 1 0 1.67 1.33
Depth 0 0 0 2.67 0.33 1.33 2 0 2
Texture 0 0 0 2.33 0 1.67 2.337 2 0
Table 7. The normalized direct influence matrix (X).
Criteria Temperature Rainfall Elevation Soil Type Slope pH Drainage Depth Texture
Temperature 0.00 0.23 0.19 0.13 0.00 0.06 0.02 0.06 0.04
Rainfall 0.21 0.00 0.15 0.13 0.10 0.12 0.15 0.00 0.00
Elevation 0.17 0.13 0.00 0.13 0.13 0.04 0.04 0.02 0.02
Soil Type 0.00 0.00 0.00 0.00 0.00 0.19 0.15 0.13 0.15
Slope 0.02 0.06 0.21 0.04 0.00 0.06 0.10 0.08 0.02
pH 0.06 0.08 0.06 0.19 0.04 0.00 0.06 0.02 0.06
Drainage 0.00 0.04 0.06 0.13 0.08 0.06 0.00 0.10 0.08
Depth 0.00 0.00 0.00 0.15 0.02 0.08 0.12 0.00 0.12
Texture 0.00 0.00 0.00 0.13 0.00 0.10 0.13 0.12 0.00
Table 8. The matrix of total relations (T) and direct–indirect matrix.
Criteria Temperature Rainfall Elevation Soil Type Slope pH Drainage Depth Texture
Temperature 1.38 0.38 0.35 0.36 0.18 0.40 0.26 0.20 0.24
Rainfall 0.40 1.53 0.34 0.31 0.21 0.38 0.46 0.28 0.31
Elevation 0.36 0.23 1.00 0.23 0.21 0.32 0.36 0.30 0.32
Soil Type 0.20 0.22 0.12 0.23 0.11 0.46 0.45 0.78 0.45
Slope 0.10 0.15 0.14 0.16 1.47 0.36 0.13 0.11 0.12
pH 0.18 0.22 0.19 0.40 0.11 0.14 0.15 0.17 0.23
Drainage 0.15 0.34 0.19 0.27 0.09 0.17 0.13 0.17 0.17
Depth 0.11 0.13 0.17 0.37 0.08 0.21 0.13 0.05 0.17
Texture 0.14 0.13 0.14 0.10 0.11 0.11 0.36 0.12 0.11Agriculture 2019, 9, 148 14 of 26
Table 9. The values of significance and relationship indicators for criteria and their weights.
Sum Successive Sum of Each Significance Relationship
Average
Criteria Rows of Di Column of Indicator (di Indicator Scales
Rates
Matrix the r j Matrix + r j) (di − r j )
Temperature 3.752 3.008 6.760 0.745 3.752 0.161
Rainfall 4.216 3.325 7.541 0.891 4.216 0.181
Elevation 3.347 2.632 5.979 0.716 3.347 0.144
Soil Type 3.020 2.421 5.441 0.599 3.020 0.130
Slope 2.736 2.570 5.306 0.166 2.736 0.118
pH 1.792 2.547 4.339 −0.755 1.792 0.077
Drainage 1.676 2.436 4.111 −0.760 1.676 0.072
Depth 1.420 2.181 3.601 −0.761 1.420 0.061
Texture 1.313 2.121 3.434 −0.808 1.313 0.056
Threshold value = 0.287 = 23.272
P
1.00
In Figure 2, the criterion of rainfall has the highest significance indicator value followed by
temperature, elevation and slope, indicating that these are the most important criteria for the land
suitability assessment for tea in Sri Lanka. The lowest position indicator value is attained by depth
and texture. Further, the relationship indicator allows to set a degree of influence of the analyzed
parameters on other parameters. In Figure 2, rainfall has the greatest positive value of relationship
indicator, which means that it has a dominating, causal influence on the other criteria. The value
of di -rj segregated the flexibilities into two groups: cause group and effect group. According to the
relationship indicators (Figure 2 and Table 9), rainfall, temperature, elevation and slope belong to
the cause group, and have a significant influence over the criteria of pH, soil type, drainage, depth
and texture.
The final criteria weights were achieved by calculating each criterion’s average weight in both
techniques as shown in Table 10 and applied in the land-use suitability for tea crops. Rainfall (21.6%)
followed by temperature (18.56%) and elevation (16.69%) highly contributed to the land suitability
evaluation than other criteria. The least impact on the evaluation of land suitability for tea was the
texture, accounting for 3.8%.
Table 10. The final weights for criteria combining the AHP and Decision-Making Trail and Evaluation
Laboratory (DEMATEL) model for the land suitability assessment for tea.
Average Weights of
Criteria AHP DEMATEL Influence % Rank
AHP–DEMATEL
Temperature 0.21 0.16 0.19 18.56 2
Rainfall 0.25 0.18 0.22 21.56 1
Elevation 0.19 0.14 0.17 16.69 3
Soil Type 0.12 0.13 0.12 12.49 4
Slope 0.09 0.12 0.10 10.38 5
pH 0.06 0.08 0.07 6.85 6
Drainage 0.04 0.07 0.06 5.60 7
Depth 0.03 0.06 0.05 4.55 8
Texture 0.02 0.06 0.04 3.82 9Soil Type 0.12 0.13 0.12 12.49 4
Slope 0.09 0.12 0.10 10.38 5
pH 0.06 0.08 0.07 6.85 6
Drainage 0.04 0.07 0.06 5.60 7
Agriculture
Depth2019, 9, 148
0.03 0.06 0.05 4.55 15 of
8 26
Texture 0.02 0.06 0.04 3.82 9
3.3. The Land-Use Suitability with Respect to Selected Criteria
3.2. The Land-Use Suitability with Respect to Selected Criteria
All criteria maps were standardized (reclassified) into five classes (very highly suitable, highly
All criteria
suitable, mapssuitable,
moderately were standardized
low suitability (reclassified) into five
and unsuitable). classes
Figure (verythe
3 shows highly suitable, criteria
standardized highly
suitable, moderately suitable, low suitability and unsuitable). Figure 3 shows the
maps for tea suitability. Each of the criteria was separately analyzed for their suitability for supporting standardized
criteria
tea cropsmaps
basedforon
teaitssuitability.
requirements. EachMostof theofcriteria was separately
Sri Lanka’s analyzed for their
northern, northwestern, suitability
north for
central, and
supporting tea crops based on its requirements. Most of Sri Lanka's northern, northwestern,
eastern parts do not have suitable rainfall, temperature, and elevation requirements for tea cultivation north
central,
(Figure and eastern3parts
3). Figure shows dothat,
not have
with suitable rainfall,
the exception of temperature,
the northern and partselevation requirements
of the country, many for
Sri
tea cultivation (Figure 3). Figure 3 shows that, with the exception of the
Lankan regions have at least a moderate slope category for tea production. The soil maps northern parts of the country,
of pH,
many Sri Lankan
drainage, depth and regions
texture have at least
illustrate a moderate
varying degrees slope categoryto
of suitability for tea production.
grow tea. Overall, The soil maps
soil properties
of
in pH,
many drainage,
parts of depth
Sri Lankaandaretexture illustrate
suitable for teavarying degrees of suitability to grow tea. Overall, soil
cultivation.
properties in many parts of Sri Lanka are suitable for tea cultivation.
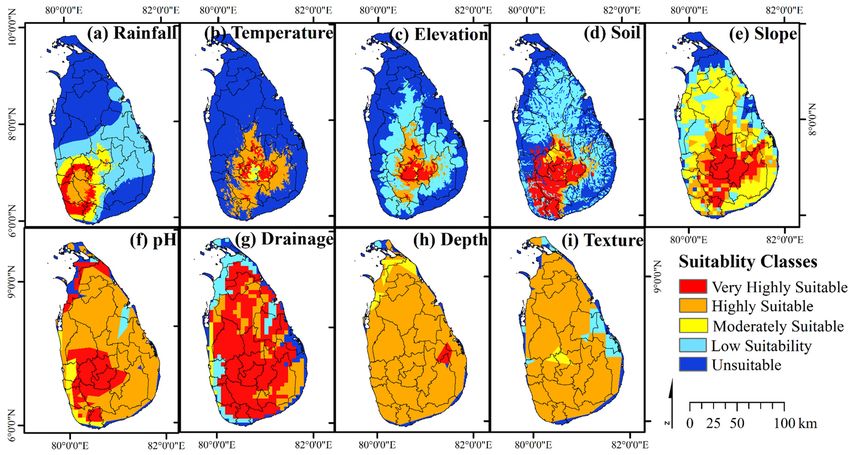
Figure 3.
Figure 3. Criteria
Criteria distribution
distributionmaps
mapsofofthe
thestudy area
study climatic
area factors
climatic (rainfall
factors (a) and
(rainfall temperature
(a) and (b)),
temperature
(b)), elevation (c), soil types (d), slope (e), and other soil characteristics (pH (f), drainage (g), depthand
elevation (c), soil types (d), slope (e), and other soil characteristics (pH (f), drainage (g), depth (h) (h)
texture
and (i)). (i)).
texture
3.4. Overall Land Suitability for Tea in Sri Lanka
3.3. Overall Land Suitability for Tea in Sri Lanka
Figure 4 shows the map of derived suitability classes of the land for tea cultivation in Sri Lanka.
Figure 4 shows the map of derived suitability classes of the land for tea cultivation in Sri Lanka.
The land consists of very highly suitable, highly suitable, moderately suitable, low suitable and
The land consists of very highly suitable, highly suitable, moderately suitable, low suitable and
unsuitable areas as described in Table 2. Nuwara Eliya, Ratnapura, Matara, Galle, Matale, Kandy,
unsuitable areas as described in Table 2. Nuwara Eliya, Ratnapura, Matara, Galle, Matale, Kandy,
Badulla, Kegalle and Kalutara districts show “very highly suitable” or “highly suitable” classes for
tea cultivation.
Agriculture 2019, 9, x; doi: FOR PEER REVIEW www.mdpi.com/journal/agricultureAgriculture 2019, 9, x FOR PEER REVIEW
Agriculture 2019, 9, 148 16 of 26
Badulla, Kegalle and Kalutara districts show “very highly suitable” or “highly suitable” classes for
tea cultivation.
Landsuitability
Figure4.4.Land
Figure suitabilityclasses
classesfor
fortea
teain
inSri
SriLanka.
Lanka.
The degree of potential land
Table 11.suitability forarea
Potential land tea cultivation variesclass.
in each suitability between districts in Sri Lanka
(Figure 5). It clearly shows that the existing tea-growing districts are ideal for tea. Among the areas
under the very highlySuitability Classes29.5% Total Areato(km 2) Percentage (%)to Kandy and 21.7% to
suitable category, belong Nuwara-Eliya, 26.2%
Unsuitable 18,695 28.5
Ratnapura District. The districts of Ratnapura (52.2%), Kandy (51.4%), Badullla (56.2%), Kegalle (43.1
%), NuwaraEliya (48.7%), Low suitability
Matara (38.9%), Matale27,581
(32.5%) and Kalutara 42.1(25.2%) are clearly classified
Moderately suitable 8137 12.4
in the “highly suitable” land category (Figure 5). The highest area under “moderately suitable” is
recorded in the KalutaraHighly suitable
District, 9498 52.0%, followed
which is approximately 14.5 by Colombo (43.8%), Galle
Very highly suitable 1627
(42.9%) and Moneragala (42.4%). The district of Jaffna (94.9%), Kurunegala 2.5 (74.1%) and Kilinochchi
Thewere
(70.4%) degree of potential
dominated land suitability
by “unsuitable” for for
areas tea tea
cultivation
compared varies between
to other districts
districts. Therein are
Sri no
Lanka
low
(Figure 5). It clearly shows that the existing
suitable areas in the Nuwara Eliya District. tea-growing districts are ideal for tea. Among the areas
under the very highly suitable category, 29.5% belong to Nuwara-Eliya, 26.2% to Kandy and 21.7%
to Ratnapura District. The districts of Ratnapura (52.2%), Kandy (51.4%), Badullla (56.2%), Kegalle
(43.1 %), NuwaraEliya (48.7%), Matara (38.9%), Matale (32.5%) and Kalutara (25.2%) are clearly
Agriculture 2019, 9, x; doi: FOR PEER REVIEW www.mdpi.com/journal/agricultureAgriculture 2019, 9, x FOR PEER REVIEW
classified in the "highly suitable" land category (Figure 5). The highest area under "moderately
suitable" is recorded in the Kalutara District, which is approximately 52.0%, followed by Colombo
(43.8%), Galle (42.9%) and Moneragala (42.4%). The district of Jaffna (94.9%), Kurunegala (74.1%) and
Agriculture 2019, 9, 148 17 of 26
Kilinochchi (70.4%) were dominated by "unsuitable" areas for tea compared to other districts. There
are no low suitable areas in the Nuwara Eliya District.
Unuitable Low Suitable Moderately Suitable Highly Suitable Very Highly Suitable
Vavuniya
Trincomalee
Ratnapura
Puttalam
Polonnaruwa
Nuwara Eliya
Mullaitivu
Moneragala
Matara
Matale
Districts
Mannar
Kurunegala
Kilinochchi
Kegalle
Kandy
Kalutara
Jaffna
Hambantota
Gampaha
Galle
Colombo
Batticaloa
Badulla
Anuradhapura
Ampara
0% 20% 40% 60% 80% 100%
Proportion of area
Figure 5. Land
Land suitability
suitability assessment
assessment according to district basis.
3.5. Measures
3.4. Measures of
of Model
Model Performance
Performance
The coordinates
The coordinates of of modelled
modelled veryvery highly
highly and
and highly
highly suitable
suitable areas
areas were
were within
within the
the range
range of
of the
the
coordinates of
coordinates of existing
existing tea-growing areas (Figure
tea-growing areas (Figure 6). The latitudes
6). The latitudes ofof existing
existing teatea cultivation areas
cultivation areas
range from 5.9991 to 7.59550, where the coordinates of modelled highly tea-growing
range from 5.9991 to 7.59550, where the coordinates of modelled highly tea-growing areas ranged areas ranged
from 6.2473
from 6.2473 to
to 7.4508.
7.4508. This
This showed
showed thatthat most
most of
of the
the existing
existing tea-growing
tea-growing areas
areas range
range from
from 80.0489
80.0489 toto
81.3026, where
81.3026, wherethe thelongitude
longitude of of
thethe
modelled
modelledveryvery
highly and highly
highly suitable
and highly area ranged
suitable from 80.4531
area ranged from
to 80.9239 (Figure 6).
80.4531 to 80.9239 (Figure 6).
Most of
Most of the
themodelled
modelled“highly
"highlysuitable”
suitable"class
classaligns
alignswith
withexisting
existingtea-growing
tea-growing areas, accounting
areas, accountingfor
for 62.45%, while the "very highly suitable" class accounts for 30.01% of existing tea cultivation6
62.45%, while the “very highly suitable” class accounts for 30.01% of existing tea cultivation (Figure
and Table
(Figure 12). Table
6 and The moderately suitable class
12). The moderately accounts
suitable classfor 7.10% of
accounts forexisting
7.10% of teaexisting
lands, while the lowest
tea lands, while
percentage of existing tea land classified as “low suitability” was 0.36% (Figure 6 and Table
the lowest percentage of existing tea land classified as "low suitability" was 0.36% (Figure 6 and Table 12). Further,
0.08%
12). of the current
Further, 0.08% oftea-growing
the current areas were modelled
tea-growing areas wereas unsuitable
modelled as areas.
unsuitable areas.
Agriculture 2019, 9, x; doi: FOR PEER REVIEW www.mdpi.com/journal/agricultureYou can also read