Augmenting Media Data with Mobile Behaviour - Peter Searll - Pamro
←
→
Page content transcription
If your browser does not render page correctly, please read the page content below
Augmenting Media Data with
    Mobile Behaviour

                      Peter Searll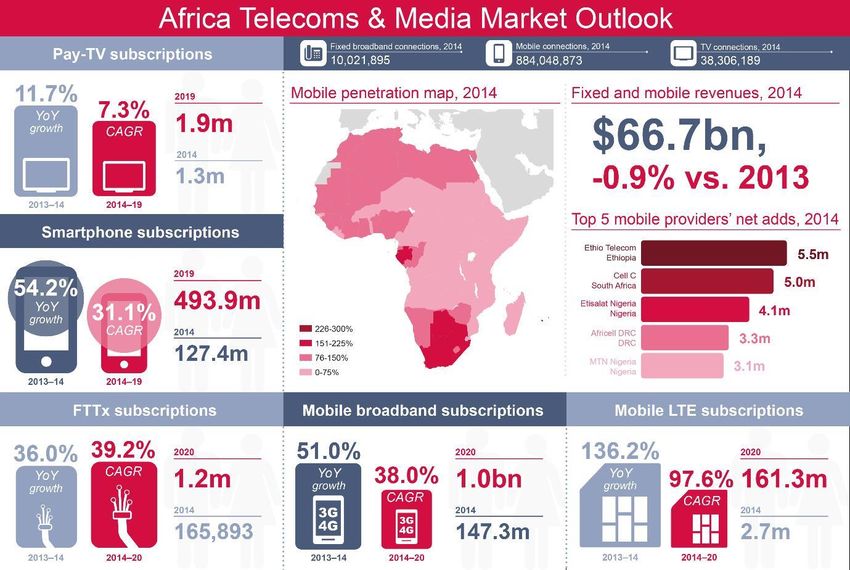
CONTENTS

• Intelligence
• Changing media consumption patterns
• Implications for our industry
  • Rationale for this paper
• Case study
• Applications
• Conclusions

INTELLIGENCE IS A ROUTINE OF…
..collection, collation, interpretation and dissemination of
information

                                                    www.envision.com

                                                       …it’s not a once-off task!
   The application of intelligence leads us to insight & strategy
    John Hughes-Wilson – The Puppet Masters
    The Definitive Guide to Military Intelligence
MARKETING INTELLIGENCE SOURCES
       Tip-offs                    Interrogation                       Spying
     (feedback)                 (traditional research)              (observation)

− Tend to be source          − Researcher initiated          − “Big data”
  initiated                  − Problem focused               − Systematic
− Less structured            − Question / answer             − Behavioural data
− Bi-polar                   − Sample is controlled
− Self-selection

Examples:
Sentiment analysis            Motivation, satisfaction,          Actual behaviour
                                   media diaries               patterns /data mining

        Applying all 3 sources provides a comprehensive consumer perspective.
                    This paper focuses on Observation (spying) only.
TRADITIONAL TV VIEWERSHIP IS CHANGING

                          •     Under 50 yrs old declines
                                   • 50-64 static
                              • Slight growth in 65+ yrs
    Source: Nielsen USA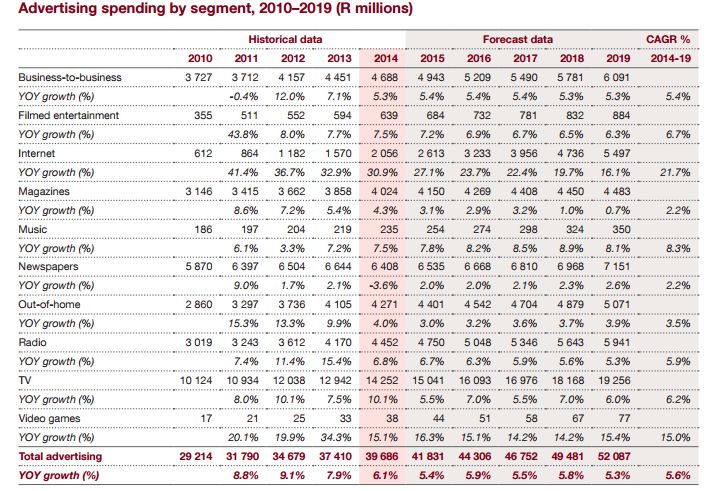
THE EVIDENCE IS OVERWHELMING…

                                 UK viewers doubled amount of time spent
                                          streaming TV in 2015

Netflix Caused 50% of U.S. TV Viewing
         Drop in 2015 (Study)
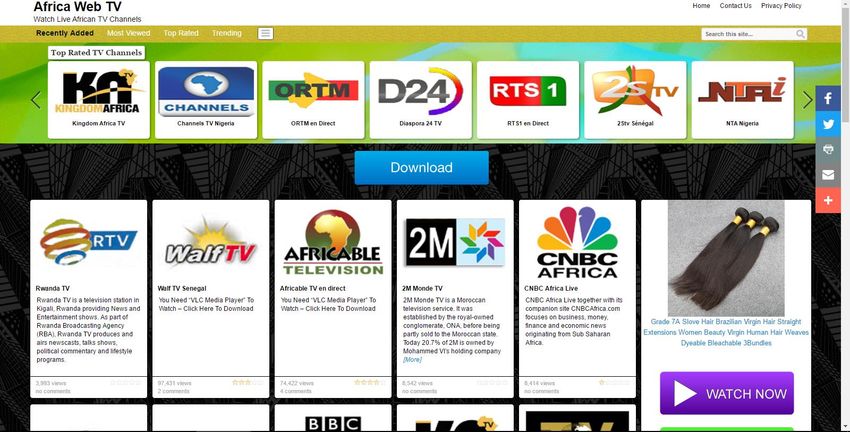
NOT JUST USA & EUROPE
   There is a proliferation of live streaming channels in Africa too…
MOBILE STREAMING IN AFRICA
                 Ghana                                                 23%
                Zambia                                              21%
             Cameroon                                            20%
           South Africa                                         19%
               Rwanda                                           19%
                 Liberia                                     17%
          Guinea Bissau                                     17%      Weighted total 16%
                Uganda                                    15%
                Nigeria                                 15%
       Congo Brazzaville                               14%
           Cote d'Ivoire                   7%
        Guinea Conakry                    7%
                  Benin              5%
             Swaziland             4%

  •   Percentage of mobile owners currently using video or music streaming on mobile
                   •    Total across these markets is 16% - (1 in 6)
          •    Data courtesy of MTN - Market Performance Report Q2 2016
COUPLED WITH MOBILE
BROADBAND EXPLOSION…

                           The number of
                                mobile
                             broadband
                           connections in
                          Africa will climb
                          from 147 million
                           in 2014 to one
                           billion in 2020!

PWC, Ovum November 2015
THE INEVITABLE…
ONLY A QUESTION OF WHEN
                Broadcast   Online

  2016   2018       When?            When?   When?
PROJECTED ADSPEND GROWTH IS ASTOUNDING
• Internet spending expects a 21.7% CAGR until 2019 in SA. (Nigeria 31.6%, Kenya 16.8%)
• TV at 6.2% and Radio 5.9% (CAGR)
• TV spend now 5x Internet spend, down to 3.5x in 2019
Source: PWC – Entertainment and media outlook 2015-2019KEEPING PACE WITH CONSUMERS:
INDUSTRY IMPLICATIONS
Media owners Media buyers
• TV audience attrition, especially • Also under threat, especially with
younger viewers programmatic buying
• Proliferation of music streaming • Innovation to keep pace with digital
challenges radio channel buying as part of mix
• Advertising revenue share declines • Media currency beyond reach and
• Challenge to keep format relevant frequency (e.g. CTR – click through
• Challenge to keep content relevant rates)KEEPING PACE WITH CONSUMERS:
INDUSTRY IMPLICATIONS
Advertisers Researchers
• Cross-platform challenges for
consistent messaging
• ROI metrics – easier in digital, and
• How do we keep up with these
changing with click through rates
challenges?
and other metrics
• AR (augmented reality) is a game
changer – allowing consumers to
interact with ads
• BUT – still quite reliant on traditional
mediaRATIONALE FOR THIS PAPER
• Clear that media consumption is changing
• Advertisers, media owners and researchers need to keep up with the market
• Much talk of “second screen” at PAMRO 2015
• In Africa, this is often the first or only screen
• How can we measure this consumption accurately?
AND
• How can this be used to augment existing traditional media data?CASE STUDY: ZAMBIA Objective: To measure and track mobile behaviour, with a specific media focus
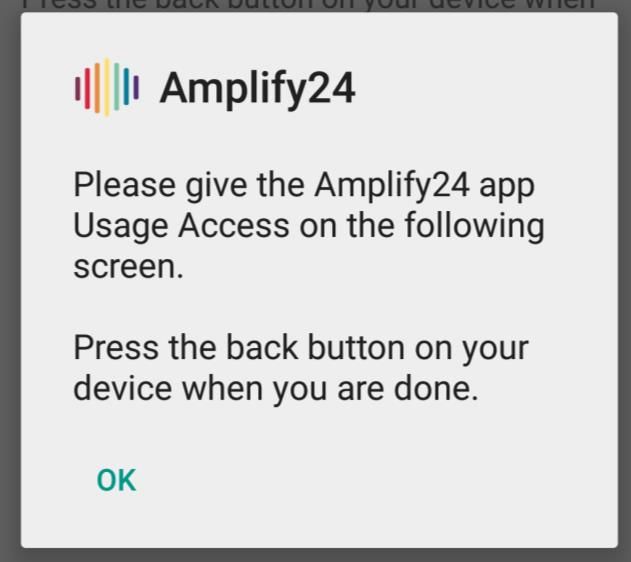
CASE STUDY

• We built an App that records all activity on mobile
  phones / tablets
      • Android only at this stage
                                                        Presented as proof
                                                        of concept, not
      • Very little iOS in Africa
                                                        definitive results
• Respondents recruited using our existing panel in     due to small sample
  Zambia (Amplify 24 brand)                             size.
• In return for an incentive, they downloaded the App
  and gave us permission to track their device usage
METHODOLOGY • A total of 60 respondents participated • Once installed, the App collected usage data all the time • Data uploaded to our servers 3 times a day – in efficient packages • Data was collated, cleaned and analysed • No user requirement other than installing App (and giving permission) • If out of airtime (data) and Wi-Fi range, the App waits for signal to upload the data
KEY METRICS COLLECTED
• Device usage:
     •   Websites visited (including time visited and number of times)
     •   Apps (including when used and time in foreground)
     •   Wi-Fi vs GSM data usage (uploads and downloads)
     •   SMS – sent and received
     •   Calls – made and received
     •   Other phone functions like settings, calendar etc.
• Demographics – from panel

               Critical to clean and code this very complex data
RESULTS – MAKING SENSE OF THE BIG DATA
Probability distributions of
diffraction in a crystalline
structure…
Or a representation of data we
received from our respondents.
Analysis requires sophisticated
protocols to extract the mass of
complex data
• 242 926 website visits
• 402 295 App usage occasions
© 1999-2005 Randy J Read, University of CambridgeSAMPLE PROFILE 53%
37%
Female,
24%
10%
Male,
76%
19-25 26 – 35 36+
Strong male bias Light in over 36 years
Starting off with a small sample of 60 respondents, declining over time.
Data collected from Sep ‘15-July ’16.
While the results are not significant, the system and outputs are potent and versatile.WEEKLY BASIC PHONE USAGE PATTERNS
% of total volume Calls and SMS by Day of week
20%
Calls SMS
19%
18%
17%
16%
15%
14%
13%
12%
11%
10%
Monday Tuesday Wednesday Thursday Friday Saturday Sunday
• Distribution during the week is the same for both genders – lowest on weekends.
• But… women do speak longer than men. Average female call duration is 129 seconds compared to
men who average 84 seconds a call.
• Interestingly, men make more calls than women, around 3 more calls per day on average.THE IMPORTANCE OF WI-FI - ACCESSIBILITY
GSM download • Currently GSM accounts
48% for 54% of data usage
• Women use Wi-Fi much
more than men for
downloading
GSM upload
Wifi upload 6%
16%
• Cheaper data or more
Wifi download prevalent Wi-Fi will
30% accelerate usage, especially
VOD / streaming
• Wi-Fi hotspots are gaining
Total data usage traction at a rapid rate
• Critical to track how this
develops over timeWEBSITE REACH - BY CATEGORY
Female Male
*
*
*
*
*
*
• Social, search and sports news are most widely accessed
• * Women seeking activism, tech / device news and adult more than men
• * Men looking out for careers and sports / sports betting more
242 926 website visits in totalWEBSITES: NEWS CATEGORY DRILL DOWN REACH & FREQUENCY • While The Mirror has the highest reach, Zambia Watchdog has higher frequency • Lusaka Times also has high frequency
MIRROR EXTRACTS….MOSTLY FOOTBALL
http://www.mirror.co.uk/sport/row-zed/fifa-16-player-ratings-announced-6382404?ICID=FB_mirror_MF
http://www.mirror.co.uk/sport/football/match-reports/man-united-3-1-liverpool-6429329?ICID_mirror_MF
http://www.mirror.co.uk/sport/football/news/liverpool-fans-launch-funding-page-6442163
http://www.mirror.co.uk/sport/football/news/louis-van-gaal-warns-anthony-6527366?ICID=FB_mirror_MF
http://www.mirror.co.uk/sport/football/news/rafa-benitez-labels-cristiano-ronaldo-6441759?ICID_mirror_MF
http://www.mirror.co.uk/3am/celebrity-news/liverpool-legend-steven-gerrard-admits-6394585
http://www.mirror.co.uk/sport/row-zed/man-united-transfer-tool-choose-6310707
http://www.mirror.co.uk/sport/row-zed/gareth-bale-scores-cheeky-goal-6374051?ICID=FB_mirror_MF
http://www.mirror.co.uk/sport/football/match-reports/man-united-3-1-liverpool-6429329?ICID_mirror_MF
http://www.mirror.co.uk/sport/football/news/louis-van-gaal-warns-anthony-6527366?ICID=FB_mirror_MF
http://www.mirror.co.uk/sport/football/news/cristiano-ronaldo-told-real-madrid-6439575?ICID=FB_mirror_MF
http://www.mirror.co.uk/3am/celebrity-news/liverpool-legend-steven-gerrard-admits-6394585#
http://www.mirror.co.uk/sport/row-zed/man-uniteds-memphis-depay-dresses-6527564?ICID=FB_mirror_MF
http://www.mirror.co.uk/3am/celebrity-news/heidi-klum-flashes-pert-bum-6395401
http://www.mirror.co.uk/sport/football/news/manchester-united-striker-anthony-martial-
6482080?ICID=mirror_MF
http://www.mirror.co.uk/sport/football/news/luke-shaw-returns-manchester-united-6582607
http://www.mirror.co.uk/sport/football/news/brendan-rodgers-cant-afford-liverpool-6352119
http://diply.com/visual-architecture/article/wife-insult-husband-depression-wrote-mirror-love-list

                                                                     …and Heidi Klum’s bum
SOCIAL MEDIA WEBSITES REACH
Female Male
*
*
*
*
• Everyone is on Facebook
• Rate n Date and Bb Dating are more popular among women, while Slut finder and Date hot dolls
are exclusively male
• Waplog has the highest combined reach among dating sitesFACEBOOK DRILL DOWN – SUNDAY ONLY
Don’t post
Female here!
Male
Versatile data and analysis enables detailed profiling by time of day / day of week
• Very similar gender usage
• Peaks before and after lunch, and around dinner timeFACEBOOK DRILLDOWN – WEEK VS WEEKEND
% of visits
20%
Sunday Weekdays
18%
16%
14%
12%
10%
8%
6%
4%
2%
0%
0 1 2 3 4 5 6 7 8 9 10 11 12 13 14 15 16 17 18 19 20 21 22 23
Time of day
• 10am is good for weekday Facebook uses about 100 000 weighting factors for ranking posts!
placements, but not on Sunday, Simplified:
where 3pm (or 8pm) is better! 1. User affinity – relationship / connection to source
2. Weight – shares, comments, likes
3. Time decayAPP: REACH BY GENRE
• No surprise that Communication Apps are most widely used
• High usage of media, music and video
• Shopping Apps at 20% reach
402 295 App usage occasions in totalAPP DRILLDOWN – COMMUNICATION GENRE
Under 25 yrs
25+ yrs
• WhatsApp is the platform of choice, followed by Gmail
• Comparing the age groups, over 25’s use Messenger and Chrome more,
while the youth prefer Opera Mini and Internet for Samsung GalaxyAPP DRILLDOWN:
USAGE FREQUENCY & PATTERNS BY TIME OF DAY
• Simply compare Apps / website daily usage patterns
• Compare different demographicsTRACK USAGE AND SHARE OVER TIME…
65% Chrome Browser - Google
55% Opera Mini web browser
45% UC Browser Browsers
35%
25%
15%
80% VLC for Android Shazam
Google Play YouTube
60%
Sony Ericsson Album Music services
40%
20%
0%
September October November December January February March April
100% Blue Stacks
80% Candy Crush Saga
Plants vs. Zombies 2
60%
Temple Run 2
40%
Games….etc.
20%
0%
September October November December January February March
Please don’t send me Candy Crush invites anymore!!A DAY IN THE LIFE…..
Individual / group daily usage patterns
Aggregated mobile perspectiveWIDE VARIETY OF DAILY USAGE…..
Great for segmentation!DATA VERSATILITY •Multiple time scales available: by hour, day, week, month (or minute if really needed) •Full usage of mobile device in perspective •Websites and apps grouped by type / genre for full competitve profiling •Detailed analysis of reach and frequency by any demographic at a very granular level
KEY ADVANTAGES OF OUR APPROACH
• Tracks individuals – not specific websites / apps
    • Customer centric vs website centric
• Accurate, complete permission based record of actual behaviour - not diary
  / recall / interview based
    •Truly longitudinal data
    •No surveys required to get data – just continuous passive data collection
• Data available almost immediately – no diaries to process
• Covers all websites and apps, not just the large ones
  • No registration required / no tags from site owners
• Does not rely on cookies (which can be deleted and don’t work on all
  browsers / Apps)
• Seamlessly supplemented with survey data
• Scalable

• Merges easily with existing media data
SOME APPLICATIONS
Media Owners Media Buyers
• Repertoire analysis – competitive context • Accurate planning tool
• Profile of users • Ability to buy across the board media
• Inclusion in measurement whether site is • Data in familiar format
tagged or not, or not in Top 100
• Track market share
Marketers
• Better targeting
• Lifestyle segmentation profiling based on
behaviour
• Own customer panelsDEVELOPMENTS • Live reporting • Multi-devices for respondents who use them – aggregated • Geo-location (also enhance OOH measurement) • User dashboards / utility to monitor their own mobile behaviour • Links to social media profiles • Multi-dimensional segmentation • Survey data for uncovering motivation and customer journey mapping • Predictive analytics
IN A NUTSHELL…
    Tip-offs        Interrogation                Spying
  (feedback)     (traditional research)        (observation)

               − Existing media data      − App data

                  Offline                   Online
AUGMENTING TRADITIONAL MEDIA DATA
• There are many tools that conduct detailed website analytics of users and
audiences, but..
• these don’t necessarily show which other sites users visit
• or App usage
• Our App data can be stand-alone or easily added to existing media sets –
(matched on demographics)
• Next step is recruiting broad enough samples to ensure market coverage
• Provides a holistic and consolidated view across all websites and apps
Combined with traditional media data to provide
complete media consumption:
TV, radio, print, internet and App usageStudio C11, Mainstream
Centre, Hout Bay, 7806,
Cape Town, South Africa
Tel +27 (0)21 790 1801
www.dashboard.co.za
Thank you!You can also read