Automated segmentation of endometriosis using transfer learning technique version 1; peer review: awaiting peer review
←
→
Page content transcription
If your browser does not render page correctly, please read the page content below
F1000Research 2022, 11:360 Last updated: 23 JUN 2022

RESEARCH ARTICLE

Automated segmentation of endometriosis using transfer
learning technique [version 1; peer review: awaiting peer
review]
S. Visalaxi       , T. Sudalaimuthu
Department of Computer Science and Engineering, Hindustan Institute of Technology and Science, Chennai, Tamilnadu, 603103,
India

v1   First published: 28 Mar 2022, 11:360                                     Open Peer Review
     https://doi.org/10.12688/f1000research.110283.1
     Latest published: 28 Mar 2022, 11:360
     https://doi.org/10.12688/f1000research.110283.1                          Approval Status AWAITING PEER REVIEW

                                                                              Any reports and responses or comments on the

Abstract                                                                      article can be found at the end of the article.
Background: This paper focuses on segmenting the exact location of
endometriosis using the state-of-art technique known as U-Net.
Endometriosis is a progressive disorder that has a significant impact
on women. The lesion-like appearance that grows inside the uterus
and sheds for every periodical cycle is known as endometriosis. If the
lesion exists and is transferred to other locations in the women’s
reproductive system, it may lead to a serious problem. Besides
radiologists deep learning techniques exist for recognizing the
presence and aggravation of endometriosis.
Methods: The proposed method known as structural similarity
analysis of endometriosis (SSAE) identifies the similarity between
pathologically identified and annotated images obtained from
standardized dataset known as GLENDA v1.5 by implementing two
systematic approaches. The first approach is based on semantic
segmentation and the second approach uses statistical analysis.
Semantic segmentation is a cutting-edge technology for identifying
exact locations by performing pixel-level classification. In semantic
segmentation, U-Net is a transfer-learning architecture that works
effectively for biomedical image classification. The SSAE implements
the U-Net architecture for segmenting endometriosis based on the
region of occurrence. The second approach proves the similarity
between pathologically identified images and the corresponding
annotated images using a statistical evaluation. Statistical analysis
was performed using calculation of both the mean and standard
deviation of all four regions by implementing systematic sampling
procedure.
Results: The SSAE obtains the intersection over union value of 0.72
and the F1 score of 0.74 for the trained dataset. The means of both
the laparoscopic and annotated images for all regions were similar.
Consequently, the SSAE facilitated the presence of abnormalities in a
specific region.

                                                                                                                        Page 1 of 16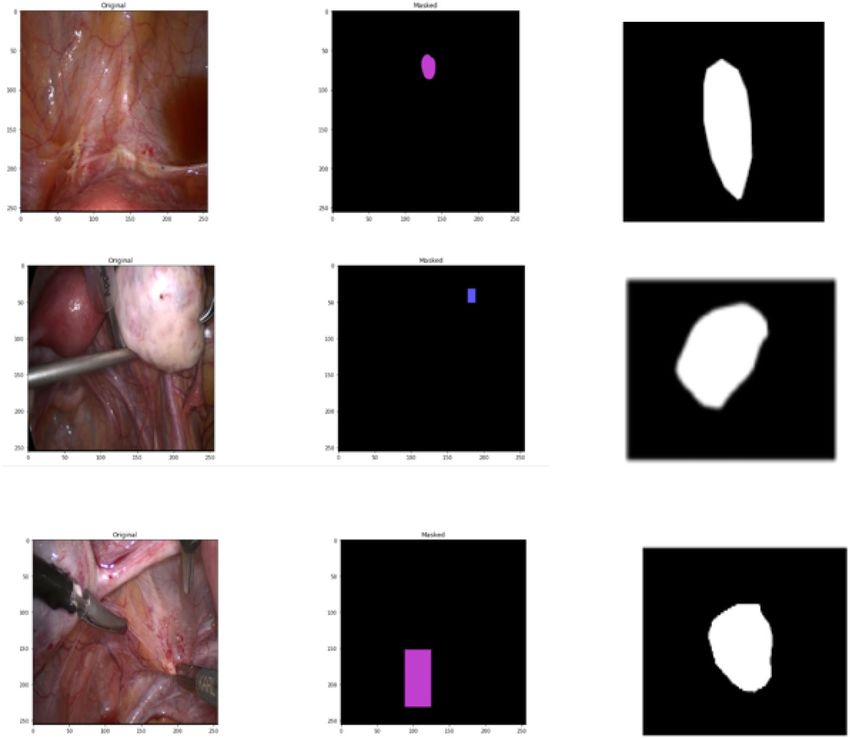
F1000Research 2022, 11:360 Last updated: 23 JUN 2022

Conclusions: The proposed SSAE approach identifies the affected
region using U-Net architecture and systematic sampling procedure.

Keywords
F1 Score, Intersection over Union, Segmentation, Systematic
Sampling, U-Net

                This article is included in the IIARP Publications
                gateway.

 Corresponding author: S. Visalaxi (sakthi6visa@gmail.com)
 Author roles: Visalaxi S: Conceptualization, Data Curation, Formal Analysis, Methodology, Validation, Visualization, Writing – Original
 Draft Preparation; Sudalaimuthu T: Conceptualization, Supervision, Writing – Review & Editing
 Competing interests: No competing interests were disclosed.
 Grant information: The author(s) declared that no grants were involved in supporting this work.
 Copyright: © 2022 Visalaxi S and Sudalaimuthu T. This is an open access article distributed under the terms of the Creative Commons
 Attribution License, which permits unrestricted use, distribution, and reproduction in any medium, provided the original work is properly
 cited.
 How to cite this article: Visalaxi S and Sudalaimuthu T. Automated segmentation of endometriosis using transfer learning
 technique [version 1; peer review: awaiting peer review] F1000Research 2022, 11:360
 https://doi.org/10.12688/f1000research.110283.1
 First published: 28 Mar 2022, 11:360 https://doi.org/10.12688/f1000research.110283.1

                                                                                                                                  Page 2 of 16
F1000Research 2022, 11:360 Last updated: 23 JUN 2022

Introduction
Endometriosis is a common gynecological problem that occurs in women of aged 18 to 50 years.1 The lesion-like
structure that underlines the uterus and other surrounding regions is referred to as endometriosis. Endometriosis along
with the uterus affects other regions, including ovaries, peritoneum, and multiple locations known as deep infiltrating
endometriosis.2 The most common practice for recognizing endometriosis is laparoscopy.

Deep infiltrating endometriosis (DIE) is a serious concern among women of reproductive age. The DIE affects multiple
regions including the uterus, ovaries, gall bladder, liver, and other abdominal regions. DIE also penetrates approximately
4 to 5 mm into the tissues.3,4 DIE is unpredictable at earlier stages and poses a great challenge for gynecologists.

The greatest problem with endometriosis is unbearable abdominal pain and infertility, which in turn leads to psycho-
logical depression and serious health issues includes dysmenorrhea, severe pelvic pain, dyspareunia, frequent urination.5
The advanced stages of endometriosis may lead to endometrial cancer, leading to further complications.6 Computerized
diagnosis helps radiologists in identifying the exact location and also precisely recognize abnormalities. Various methods
exist for identifying endometriosis including magnetic resonance imaging (MRI), transvaginal scanning (TVUS), and
laparoscopic surgery. Among all laparoscopic surgery is considered the best practice to identify the exact location of
endometriosis.7 The staging depends on the location and aggravation of the lesion spread across multiple locations.
According to the stages of endometriosis, endometriosis is classified as (a) minimal endometriosis, (b) mild endome-
triosis, (c) advanced or deep endometriosis.

The proposed work implements the segmentation process using predicted pathological images from earlier work and
the corresponding annotated images from the dataset. The proposed work known as structural similarity analysis of
endometriosis was validated using two approaches. The first approach was semantic segmentation using U-Net and the
second approach used statistical evaluation.

Deep learning serves as a decision support system for radiologists. Deep learning is a state-of-the-art technique for
recognizing the affected areas. Among the various deep learning networks, convolution neural networks (CNNs) play a
vital role in processing biomedical images. CNNs perform various tasks including classification, prediction, localization,
and segmentation. The CNN implements the segmentation process to recognize the pattern and identify the object.
Segmentation analyzes the super pixel of each image and classifies them based on various criteria.

Segmentation can be classified majorly into two types: a) instance segmentation, b) semantic segmentation. The
combination of these two segmentations is known as panoptic Segmentation.8 Instance segmentation considers multiple
objects in the same class in various instances. Semantic segmentation treats multiple objects in a single class as a single
instance. Medical images invoke a semantic segmentation. Image segmentation can be implemented effectively using
transfer learning architectures including Mask R-CNN, fully convolution neural network (F-CNN), and U-Net archi-
tecture.9 In this study, segmentation was used to predict the exact location of the endometriosis by implementing pixel
classification.

Semantic segmentation using the U-Net architecture was identified as a prominent segmentation process for biomedical
images. U-Net is a transfer learning architecture that invokes CNN for implementing pixel classification. The U-Net
architecture applies down sampling to extract more features from an image.10 Statistical analysis plays a predominant role
in the validation and verification of medical datasets. The mean and standard deviation were used to analyze each value in
the dataset and evaluate the difference in values.

Related studies
Literature studies used to analyze the similarity between two datasets based on deep learning techniques are discussed
below.

Segmentation plays a vital role in recognizing abnormalities. Suggested gonadotrophin releasing hormone is used
to improve pregnancy rates in women with and without endometriosis.11 Endometriosis was predicted using the transfer-
learning approach. ResNet50 classifies pathological and non-pathological endometriosis with an accuracy rate of
91%.12 Attribute description was developed through “pattern recognition and image processing techniques”. Ultrasonic
images are used for extracting features, segmentation of images and so on.13 The segmentation of medical images was
implemented using deep-learning techniques. A comparison was performed using supervised and weakly supervised
learning techniques.14 Semantic segmentation in biomedical images was analyzed. Traditional segmentation loses pixel
quality, whereas semantic segmentation processes preserve pixel quality through down-sampling process. Semantic
segmentation invokes a CNN to maintain the pixel quality.15 The process known as automatic augmentation was
implemented. The process involves the following steps: a) preprocessing of images b) detection of features c) mask
                                                                                                                          Page 3 of 16
F1000Research 2022, 11:360 Last updated: 23 JUN 2022

generation d) mask processing and e) segmentation.16 Introduced image segmentation with discriminant analysis of
dental radiographs. Because annotation was performed manually, the similarity between the overlapped region and the
corresponding samples is preserved.17 The image segmentation was implemented on gastrointestinal images and later
applied Machine learning algorithms for transparency.18 Hybrid segmentation known as a 3D residual network was used
for identifying tumors in the kidney and liver. The Squeeze-excitation block along with the 3D RN, was used for
segmenting the tumors.19 A convolution neural network (CNN) was used to segment skull regions from computed
tomography (CT) images. The automated CNN outperforms well with a mean F1 score of 0.92 and a mean deviation of
1.2 mm1.75 mm.20

Various architectures exist for semantic segmentation to identify abnormalities. Various learning architectures exist for
implementing segmentation. The U-Net architecture plays a predominant role in medical imaging. The U-Net module
was implemented for segmenting lung nodules. CT scan images of the lung were used for segmentation with an F1 score
of 0.82 and an intersection over union (IOU) value of 0.752.21 A novel method was introduced known as the U-NET
transformer that encodes the sequence of input and captures global multiscale information. Performance was evaluated
using brain tumor and spleen segmentation tasks.22 The ensemble machine learning model was implemented for
evaluating endometriosis. CA-CNN, DFKZnet, and 3D U-Net was adopted to validate the performance of the ensemble
learning model.23 The ovaries were classified automatically based on K-means clustering and an artificial neural network
using texture features. Three features autocorrelation, average of sum, variance of sum were used for ovarian detection.24
U-Net segmentation was implemented to identify uterine diseases using the MRI images. The mean F1 coefficient was
0.84 and the mean absolute distance was 18.5.25 Mi U-Net is a state-of-art technique that helps segment kidney stones
from medical images. The Mi U-Net outperformed well in terms of qualitative and quantitative metrics.26 U-Net and
DeeplabV3 segmentations were implemented to identify abnormalities in fetal echocardiograph. Among the two types of
segmentation DeeplabV3 performs well and evaluation was performed based on the IOU, F1 Score.27 Docker-based deep
learning outperforms other methods for segmenting biomedical images. DDeep3M works effectively on smaller and
larger datasets.28 Mask RCNN segmentation was implemented for laparoscopic gynecological images. The model
performed well with an accuracy of 95%.29

From the literature review, various segmentation processes have been identified to recognize the aggravation of
endometriosis. Segmentation was implemented by detecting features, K-means clustering, supervised machine learning
algorithms, and neural network algorithms. Manually annotated images were also used to identify the overlapping
regions, where pixel classification was not clear. A gap exists in the selection of annotated images and implementation of
a suitable segmentation process. Hence the SSAE was implemented using two approaches to analyze the similarity
between pathological images from earlier studies and their corresponding annotated images. Semantic segmentation
along with U-Net plays a vital role in identifying abnormalities.

SSAE implements a semantic segmentation process to recognize the location and aggravation of endometriosis. The
SSAE uses both pathologically proven endometriosis images from an earlier work and the corresponding annotated
images to perform the segmentation process.30 The statistical method was adopted as yet another validation procedure for
analyzing similarities.

Methods
This study took place in Jan 2022. Endometriosis was predicted in four regions of the reproductive system including
ovary, uterus, peritoneum, deep infiltrating endometriosis (rectum, gall bladder). Laparoscopic images and annotated
images of endometriosis were obtained from the standardized GLENDA v1.531 dataset. The dataset contains Laparo-
scopic images of both pathological and non-pathological identified endometriosis regions. Pathological lesions identified
in laparoscopic images were used for segmentation process. In the proposed method 373 laparoscopic images and
628 corresponding annotated images were used for segmentation process.

A recognized pathological report of endometriosis was selected for segmentation. The images were classified as
pathological images and their corresponding annotated images. Table 1 shows the number of endometriosis images
by affected region.

Endometriosis is recognized at different location in a single pathological image. The pathologically affected images were
identified from the dataset12 where the uterus is 17, Peritoneum is 257, Ovary is 53 and Deep infiltrating endometriosis is
55. These different locations were distributed into various annotated images for precise pixel classification. The
endometriosis-affected uterus regions consisted of 17 raw images, and the lesions identified at multiple locations
are distributed as 25 annotated images. Similarly, endometriosis affected peritoneum regions consist of 257 raw
images in which the lesions identified at multiple locations are distributed as 489 annotated images. In addition, the

                                                                                                                          Page 4 of 16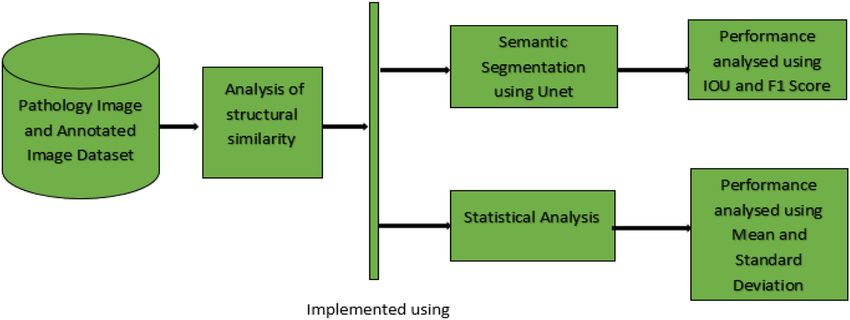
F1000Research 2022, 11:360 Last updated: 23 JUN 2022

Table 1. Endometriosis affected region.

 Affected region                                        Pathological images                        Annotated images
 Uterus                                                 17                                         25
 Peritoneum                                             257                                        489
 Ovary                                                  53                                         54
 Deep infiltrating endometriosis                        55                                         59

Figure 1. Methodology of implementing structural similarity analysis of endometriosis. IOU=intersection over
union.

endometriosis-affected ovary regions consisted of 53 raw images where the lesion identified at multiple locations is
distributed as 54 annotated images.

Finally, endometriosis affected deep infiltrating endometriosis (rectum, sigmoid) regions consisting of 55 raw images,
where the lesions identified at multiple locations were distributed as 59 annotated images. The Structural similarity
analysis of Endometriosis (SSAE) methodology is illustrated in the Figure 1.

The identified pathological and annotated image datasets were given as input for SSAE. SSAE was effectively
implemented using semantic segmentation and statistical analysis. The performance of semantic segmentation was
validated using Intersection over union (IOU) and F1 score. Similarly, the statistical performance was evaluated using the
mean and standard deviation.

Semantic segmentation of endometriosis
The semantic segmentation process ascertains the spread of endometriosis at multiple locations identified from
pathologically proven images and mapped with annotated images. U-Net is a state-of-art technique for semantic
segmentation to identify the images based on pixel classification.32 Semantic segmentation is a cutting-edge technology
for recognizing the exact location of biomedical images. The steps involved in segmenting the laparoscopic images were
as follows:

    1) Collection of Endometriosis Laparoscopic Image Dataset

    2) Identified Pathological Endometriosis Laparoscopic Images

    3) Identified Pathological Endometriosis Annotated Images

    4) Pre-processing of Images includes Augmentation.

    5) Applying Semantic Segmentation using U-Net Architecture.

    6) Performance validation of pixel classification using IOU, F1 score, IOU threshold, Jacard-Coefficient.

The steps are illustrated in Figure 2 as follows:
                                                                                                                         Page 5 of 16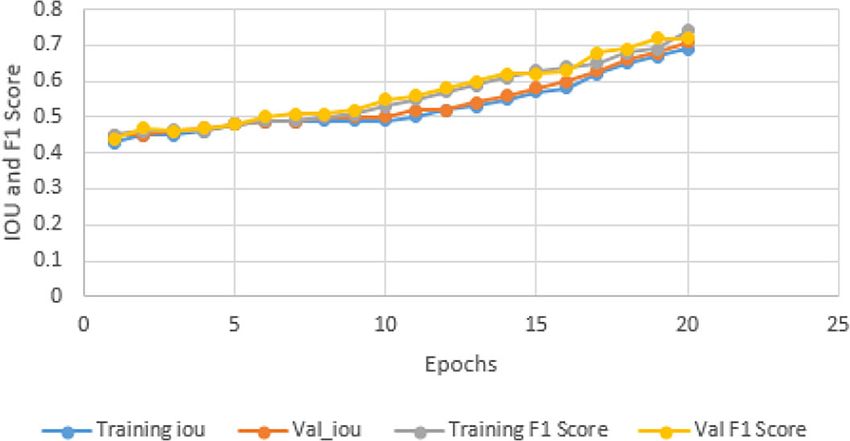
F1000Research 2022, 11:360 Last updated: 23 JUN 2022

Figure 2. Steps involved in image segmentation.

The obtained raw images and equivalent annotated images were preprocessed as follows. Preprocessing was performed
effectively through augmentation. Preprocessing includes (a) rotation (b) horizontal shift (c) vertical shift (d) shear range,
(e) zoom range. These augmentation processes increased the size of the training dataset. The various augmentation
process performed for training data are as follows: a) rotation range as 15, b) shift range in width wise as 0.05, c) shift
range in height wise as 0.05, d) shear range as 50, e) zoom range as 0.02 respectively. The training and test data was split as
70% and 30% for training and testing data. The segmentation process was implemented on the preprocessed images. The
segmentation process implements pixel classification to ensure the aggravation of endometriosis at various locations.
Various segmentation architecture processes have been proposed. The most effective U-Net architecture was imple-
mented. U-Net is a convolution neural network architecture that was mainly developed to identify the precise location of
the infected area.

The U-Net model was implemented with the following parameters: a) filter size as 64, b) Adam optimizer, c) loss function
as binary cross entropy d) softmax as activation function. The training model was implemented with 20 epochs with
50 steps per epochs. From the targeted output, it was possible to identify the intensity of endometriosis in every region
using pixel classification.33 Table 2 lists the various hyper parameters identified for execution. The model is available
from GitHub and is archived with Zenodo.47

The performance of the proposed system was evaluated using various metrics as follows:

Intersection over union (IoU)
The IoU34 is calculated as the ratio of the overlapped area between the predicted and ground truth to the overall area
between the predicted and targeted areas.
                                                                  ∝∩
                                                          IoU ¼                                                            (1)
                                                                  ∝∪

Where ∝∩ indicates the overlapped area and ∝∪ indicates the overall area.

F1 Score
The F1 Score35 is calculated as the ratio of the overlapped area multiplied by two to the total number of pixels in both
images.

                                                                                                                              Page 6 of 16
F1000Research 2022, 11:360 Last updated: 23 JUN 2022

Table 2. Hyper parameters with values identified for execution. IOU=intersection over union.

 Parameter                                                                     Value
 Number of classes                                                             4
 Number of layers                                                              4
 Filters                                                                       64
 Pooling                                                                       Maxpooling
 Output activation                                                             Softmax
 Activation                                                                    Relu
 Optimizer                                                                     Adam
 Learning rate                                                                 0.001
 Loss                                                                          Binary_crossentrophy
 Epochs                                                                        20
 Steps per epoch                                                               50
 Metrics                                                                       IoU, IoU threshold, F1 Score, Jacard_Coeff

                                                                  2∗∝∩
                                                     F1 Score ¼                                                           (2)
                                                                   ρI

Where ∝∩ indicates the overlapped area and ρI denotes pixel of both the images.

Statistical analysis of endometriosis
The pathologically identified datasets and annotated datasets were used as inputs for statistical analysis.46 The statistical
analysis was performed in Excel 2013. Systematic random sampling was performed to validate the pathologically
identified images with annotated images. The pixel intensity of endometriosis affected four regions namely the uterus,
ovary, peritoneum, and deep infiltrating (rectum) were calculated as follows:

To perform systematic sampling, population size, sample size, and starting point were calculated as follows:

                                                                N
                                                           K¼                                                             (3)
                                                                n

Where K is the systematic sampling value, N is the number of images and n is the sample size taken. The starting point (Ø)
was calculated based on the systematic sample value.

The random weight value is calculated using starting point value as follows:

                                                     γ ¼ modð∅,k Þ þ 1                                                    (4)

where γ represents the random weight value calculated for both pathological and the annotated images.

By multiplying the random weight value with the corresponding identified pixel value (ρlÞ of laparoscopic images, the
desired sampling value was obtained as follows.

                                                δL ¼ ρli ∗ γli ∀ i < 1 to x                                              (5)

Similarly, for annotated images, the sampling value was calculated as follows:

                                                δA ¼ ρAi ∗ γAi ∀ i < 1 to x                                              (6)

where (ρAÞ represents the pixel value of annotated images. δL and δA represent the sampling values of pathologically
identified and annotated images for the uterus, ovary, peritoneum, and deep infiltrating.

The mean and standard deviation of the sampling values30 for both pathologically identified and annotated images that
included all four regions were calculated as follows:
                                                                                                                            Page 7 of 16
F1000Research 2022, 11:360 Last updated: 23 JUN 2022
P
δL
λLi ¼ (7)
n
sffiffiffiffiffiffiffiffiffiffiffiffiffiffiffiffiffiffiffiffiffiffiffiffiffiffiffiffi
P
ðρli λLiÞ2
μLi ¼ (8)
n1
Where λLi and μLi represent the mean and standard deviation for laparoscopic images of all four regions. Similarly for
annotated images,
P
δA
λAi ¼ (9)
n
sffiffiffiffiffiffiffiffiffiffiffiffiffiffiffiffiffiffiffiffiffiffiffiffiffiffiffiffiffiffi
P
ðρAi λAiÞ2
μAi ¼ (10)
n1
Where λAi and μAi represent the mean and standard deviation for annotated images of all four regions.
Results
The pathologically identified images and their corresponding annotated images of endometriosis were considered as
inputs for segmentation. The four regions including the ovary, uterus, peritoneum, and deep infiltrating endometriosis are
involved in pixel classification. The pathologically identified images and annotated images were pre-processed. These
preprocessing include rotation and shifting to increase the training size of the images. As a result, the pre-processed
images were fed as input to the segmentation.
Segmentation analyzes the pre-processed images pixel-by-pixel level. Semantic segmentation involves the classification
of each pixel of an image into all classes. The U-Net architecture36 implements a down sampling technique to encode the
input images to attribute representation at multiple levels.
The pathological37 and annotated images were provided as input for semantic segmentation using U-Net architecture. As
a result of the segmentation process involving various parameters the ground truth area was identified which predicts the
region of occurrence as a segmented output as illustrated in Figure 3.
The hyper parameters as mentioned were executed in the colab environment and the total number of parameters executed
was 31,055,492 with trainable parameters as 31,043,716 and non-trainable parameters as 11,776.
A careful investigation was performed by selecting the network parameters. Trials were carried out to identify the
optimized parametric value. The filter size was identified based on trials with sizes as 16, 32 and 64 and it was found that a
filter size 64 was the most optimized parameter values. The overlapping region was not sufficient for the lower bound
values of filter sizes38 16 and 32. Similarly, the optimizers used for U-Net architectures were RMSprop, SGD, and
Adam.39 Also the epoch sizes were chosen based on empirical analysis. The epoch size identified was 10, 20 and 30.The
results obtained are illustrated in Figures 4-6.
The prediction area was evaluated using the following performance metrics: a) IOU b) F1 Score) with a filter size of
64, epochs of 20, and Adam optimizer was selected. Based on the execution with the identified hyper parameters the
ground truth was predicted and the output image obtained was depicted in Figure 7.
A comparison was made between the training IOU and validation IOU along with the epochs. The best identified
parameters were executed and graph was illustrated in Figure 8.
The proposed methodology for segmenting the endometriosis to identify the similarity of pixels between pathological and
annotated images was compared with other architectures. The various architectures used for analyzing the pathological
and annotated images were fully conventional network and Mask RCNN. These architectures were compared based on
their performance using overlapping regions. Table 3 presents the comparison was based on various metrics and
comparison was illustrated in Figure 9.
Page 8 of 16F1000Research 2022, 11:360 Last updated: 23 JUN 2022
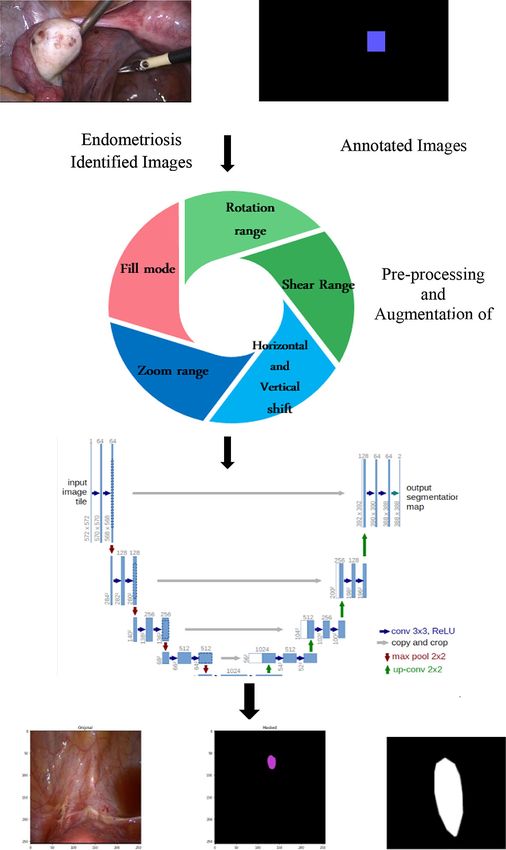
Figure 3. Segmentation of laparoscopic images for pixel classification using U-Net. The laparscopic images are
taken from the GLENDA dataset under CC BY 4.0.31
The proposed SSAE method was compared with other existing methods, where the SSAE method performs well in terms
of Intersection over Union and F1 Score. The comparison is illustrated in Table 4.
In addition to the segmentation process, the intensity of endometriosis was identified using statistical analysis.40,41
The pixel intensity of affected regions was identified for both pathological and annotated images. Random sampling
was applied to both the pathological images and annotated image pixel values. From the obtained values, the mean and
standard deviation were calculated for both the pathological and annotated images for all four regions was listed in
Table 4.
Page 9 of 16F1000Research 2022, 11:360 Last updated: 23 JUN 2022
Figure 4. Filter size vs metrics. IOU=intersection over union.
Figure 5. Epoch’s vs metrics. IOU=intersection over union.
Figure 6. Optimizer vs metrics. IOU=intersection over union.
Page 10 of 16F1000Research 2022, 11:360 Last updated: 23 JUN 2022
Figure 7. Predicted ground truth images. The laparscopic images are taken from the GLENDA dataset under CC BY
4.0.31
Figure 8. F1 Score and IOU vs epochs.
Table 3. Metrics measured for various architectures. IOU=intersection over union.
Architectures IOU F1 Score
UNET 0.72 0.74
Fully conventional network 0. 68 0.74
Mask RCNN 0.71 0.73
Page 11 of 16F1000Research 2022, 11:360 Last updated: 23 JUN 2022
Figure 9. Performance of various architectures.
Table 4. Comparison of Existing methods with proposed SSAE method. SSAE=structural similarity analysis of
endometriosis; IOU=intersection over union; MRI=magnetic resonance imaging.
Images used Metrics
43
Leibetseder Laparoscopic images IoU-0.7, F1 Score- 0.73
Giusti44 MRI images IoU-0.68, F1 Score- 0.7
Ma45 MRI images IoU-0.66, F1 Score- 0.68
Proposed (SSAE) Laparoscopic images IoU-0.72, F1 Score- 0.74
Discussion
The empirical analysis was performed to identify the hyper parameters for segmenting the exact location. Based on
analysis, the Adam optimizer performs well for overlapping regions based on the performance of intersection over union.
The next parameter was the loss function. The loss functions used in U-Net architectures are cross-entropy loss, focal loss,
and IoU Loss.42 Cross-entropy performs well based on the overlapping region. The sizes of the epochs were 10, 20 and
30. It was identified that intersection over Union was obtained when the epoch size was 20. When the epoch size was
10, the performance of the IOU was not up to the level, whereas when the epoch size was 30, outliers were found to be
detected.
The filter size was analyzed based on the performance of the SSAE method. When the filter size was 16, the obtained IOU
was 0.48 and the F1 Score was 0.56. In addition, when the filter size was 32, the IOU was 0.65 and the F1 Score was 0.68.
Finally, the best overlapping occurs when the filter size as 32 with IOU of 0.72 and F1 Score of 0.74 (Figure 4).
The optimizer plays an important role in identifying the segmented regions. Various optimizer were analyzed based on
the performance of the SSAE method. First the U-Net optimizer known as RMSprop was used where the overlapping
region was not clear with an IOU of 0.3 and a F1 Score of 0.35. The second optimizer identified was SGD (stochastic
gradient descent), where the IOU was 0.48 and the F1 Score was 0.58. Finally, the best overlap occurs when the Adam
optimizer was executed with an IOU of 0.72 and the F1 Score of 0.74 (Figure 5).
An epoch trains the data with the specified parameters with forward and backward passes. An epoch improves the quality
of the metrics. In the given model, epoch size was determined based on the metric value obtained at the end of each pass.
Initially 10 epochs were used where the model obtained an IOU of 0.58, F1 Score of 0.55. To fine tune the parameters, the
epoch size was increased to 20 where the IOU was 0.72 and the F1 Score was 0.74. Finally, epoch size was tuned to
30, leading to overfitting. The epoch size of 20 outperformed well for the given model and all comparisons are illustrated
in Figure 6.
The F1 Score is another method used to evaluate the pixel classification performance. The training and validation F1
Score was compared with those of epochs and graphical illustrations are presented in Figure 8.
Page 12 of 16F1000Research 2022, 11:360 Last updated: 23 JUN 2022
Table 5. Mean and standard deviation for pathological and annotated images. DIE=Deep infiltrating
endometriosis.
Pathological proven images Annotated images
Affected region Mean and Standard Deviation Mean and Standard Deviation
Uterus 0.5590.0404 0.5660.0532
Peritoneum 1.1880.0773 1.21420.0770
Ovary 0.86130.0566 1.09210.0806
DIE 0.8590.054 1.00400.0606
Among all other architecture, structural similarity between pathological and annotated images was implemented with
higher performance using U-Net with an IOU of 0.72 and F1 score of 0.74, where the fully conventional network contains
an IOU of 0.68 and an F1 score of 0.74. In addition, the performance of Mask RCNN obtains an IOU of 0.71 and an F1
score of 0.73. A graphical representation of performance analysis of the various architectures is illustrated in Figure 9.
The proposed SSAE method was compared with existing methods that invoke segmentation process for identifying
various disorder. The first method was proposed by Leibetseder.43 In this approach laparoscopic images of endometriosis
was segmented using FCNN and Mask RCNN. This method obtained an IoU of 0.7 and F1 score of 0.73. Similarly,
Giusti44 uses Magnetic resonance images for segmenting deep infiltrating endometriosis. The method obtains an IoU of
0.68 and F1 score of 0.7. Next method Ma45 uses Magnetic resonance images for segmenting gall bladder where the IoU
obtained was 0.66 and F1 Score was 0.68. The SSAE method outperforms well as listed in Table 4.
The calculated values for the four regions are listed in Table 5. In the pathological images, the mean value for the uterus
was 0.559 which was closer to the mean value of the uterus in the annotated images. In addition, the mean value of the
peritoneum in the pathological images was 1.188 which was closer to the annotated image mean value of the peritoneum.
The next region’s ovary mean value in the pathological image is 0.861 which is closer to the mean value of Ovary in the
annotated images. Finally, the DIE mean value is 0.85 was closer to the mean value of DIE in the annotated images.
Similarly, the standard deviation of the uterus in a pathological image is 0.040, which is closer to the standard deviation of
uterus in annotated images is 0.056. In addition, the standard deviation of the peritoneum in the pathological image is
0.0770 which was closer to annotated image standard deviation of peritoneum is 0.077. The standard deviation of the next
region of the ovary in the pathological image is 0.056 which is closer to the standard deviation of ovary in the annotated
images as 0.080. Finally, the standard deviation of DIE is 0.0544 which was closer to the standard deviation of DIE in
annotated image of 0.060. Among the four regions, peritoneum has the major impact that was identified from the mean
value obtained.
Conclusion
Endometriosis is a disease that affects 1/15th of women in the reproductive age groups. The proposed SSAE system
evaluates the aggravation of endometriosis at distinct locations namely the uterus, ovary, peritoneum, and rectum
from pathologically proven and corresponding annotated images. The proposed work invokes the U-Net architecture
for segmenting the endometriosis-affected regions for pixel-level classification. In addition to the segmentation
process, system sampling was performed using the intensity of the pixel values from both the pathological and annotated
images. Means and standard deviations were calculated as a result of the sampling process. The mean and standard
deviation obtained for each region in the pathological images were similar to the mean and standard deviation of the
annotated images. The statistical value obtained for the peritoneum was 1.1880.0773 for pathological images which
was similar to the value obtained for annotated images 1.21420.0770. Similarly, for the uterus the statistical value was
0.5590.0404 in the pathological images as 0.5660.0532 in the annotated images. Ovary the value in pathological
images as 0.86130.0566 was identical to the statistical value of annotated ovarian images as 1.09210.0806. Finally,
the peritoneum obtained the statistical value of 0.8590.054 in the pathological images which was similar to annotated
image value of 1.00400.0606. The proposed system obtains the IOU of 0.72 and an F1 score of 0.74.
Data availability
Source data
The standardized Endometriosis dataset was obtained from Glenda V1.5.31 The dataset holds around 25000 both
pathological, non-pathological images, and annotated images. The dataset consists of four labels: Ovary, Peritoneum,
Uterus and Deep Infiltrating Endometriosis.
Page 13 of 16F1000Research 2022, 11:360 Last updated: 23 JUN 2022
Underlying data
Figshare: Endometriosis Dataset Description and Mean Standard Calculation. https://doi.org/10.6084/m9.figshare.
19330682.v1.46
This project contains the following underlying data:
- DIE_Mean and Standard Deviation.csv
- Ovary_ Mean and Standard Deviation.csv
- Peritoneum_Mean and Standard Deviation.csv
- Uterus_ Mean and Standard Deviation.csv
Data are available under the terms of the Creative Commons Zero “No rights reserved” data waiver (CC0 1.0 Public
domain dedication).
Software availability
Source code available from: https://github.com/visalaxi/Automated-segmentation-of-Endometriosis-using-Transfer-
Learning
Archived source code at time of publication: https://doi.org/10.5281/zenodo.6324521.47
License: Creative Commons Zero “No rights reserved” data waiver (CC0 1.0 Public domain dedication).
References
1. Gruber TM, Mechsner S: Pathogenesis of endometriosis: Biomed. 2021; 207: 106141.
The origin of pain and subfertility. Cells. 2021; 10(6): 1381. PubMed Abstract|Publisher Full Text
PubMed Abstract|Publisher Full Text 10. Yan X, Tang H, Sun S, et al.: After-unet: Axial fusion transformer
2. Marcellin L, Goffinet F, Azria E, et al.: Association between unet for medical image segmentation. Proceedings of the IEEE/CVF
Endometriosis Phenotype and Preterm Birth in France. JAMA Winter Conference on Applications of Computer Vision. 2022;
Netw. Open. 2022; 5(2): e2147788–e2147788. (pp. 3971–3981).
PubMed Abstract|Publisher Full Text 11. Güngör ND, Gürbüz T, Yurci A: Does Depot Analog Suppression
3. Koppolu A, Maksym RB, Paskal W, et al.: Epithelial cells of deep Have Positive Effects on All Other Frozen-thawed Embryo
infiltrating endometriosis harbor mutations in cancer driver Transfer Cycles in Addition to Endometriosis?. Ulutas Med. J. 2021;
genes. Cells. 2021; 10(4): 749. 7(1): 22–30.
PubMed Abstract|Publisher Full Text Publisher Full Text
4. D’Alterio MN, D’Ancona G, Raslan M, et al.: Management 12. Visalaxi S, Muthu TS: Automated prediction of endometriosis
challenges of deep infiltrating endometriosis. Int. J. Fertil. Steril. using deep learning. Int. J. Nonlinear Anal. Appl. 2021; 12(2):
2021; 15(2): 88–94. 2403–2416.
PubMed Abstract|Publisher Full Text 13. Ismail WZW: Automatic feature description of Endometrioma in
5. Delanerolle G, Ramakrishnan R, Hapangama D, et al.: A systematic Ultrasonic images of the ovary. Int. J. Integr. Eng. 2018; 10(1).
review and meta-analysis of the Endometriosis and Mental- 14. López-Linares Román K, García Ocaña MI, Lete Urzelai N, et al.:
Health Sequelae; The ELEMI Project. Womens Health. 2021; 17: Medical image segmentation using deep learning. Deep Learning
174550652110197. in Healthcare. Cham: Springer; 2020; (pp. 17–31).
Publisher Full Text
15. Bindhu V: Biomedical image analysis using semantic
6. Kiisholts K, Kurrikoff K, Arukuusk P, et al.: Cell-Penetrating Peptide segmentation. Journal of Innovative Image Processing (JIIP). 2019;
and siRNA-Mediated Therapeutic Effects on Endometriosis and 1(02): 91–101.
Cancer in vitro Models. Pharmaceutics. 2021; 13(10): 1618. Publisher Full Text
PubMed Abstract|Publisher Full Text
16. Yang Y, Ren H, Hou X: Level set framework based on local scalable
7. Martínez-Zamora MA, Coloma JL, Gracia M, et al.: Long-term Follow- Gaussian distribution and adaptive-scale operator for accurate
up of Sexual Quality of Life after Laparoscopic Surgery in image segmentation and correction. Signal Process. Image
Patients with Deep Infiltrating Endometriosis. J. Minim. Invasive Commun. 2022; 104: 116653.
Gynecol. 2021; 28(11): 1912–1919. Publisher Full Text
PubMed Abstract|Publisher Full Text
17. Arifin AZ, Indraswari R, Suciati N, et al.: Region merging strategy
8. Sultana F, Sufian A, Dutta P: Evolution of image segmentation using statistical analysis for interactive image segmentation on
using deep convolutional neural network: a survey. Knowl.-Based dental panoramic radiographs. International Review on Computers
Syst. 2020; 201-202: 106062. and Software (I. RE. CO. S.). 2017; 12(1): 63–74.
Publisher Full Text Publisher Full Text
9. Dogan RO, Dogan H, Bayrak C, et al.: A two-phase approach using 18. Hicks S, Jha D, Thambawita V, et al.: MedAI: Transparency in
mask R-CNN and 3D U-Net for high-accuracy automatic Medical Image Segmentation. Nordic Machine Intelligence. 2021;
segmentation of pancreas in CT imaging. Comput. Methods Prog.
Page 14 of 16F1000Research 2022, 11:360 Last updated: 23 JUN 2022
1(1): 1–4. 33. Yuan D, Shu X, Fan N, et al.: Accurate bounding-box regression
Publisher Full Text with distance-IoU loss for visual tracking. J. Vis. Commun. Image
19. Qayyum A, Lalande A, Meriaudeau F: Automatic segmentation of Represent. 2022; 103428.
tumors and affected organs in the abdomen using a 3D hybrid 34. Ghosal S, Xie A, Shah P: Uncertainty quantified deep learning for
model for computed tomography imaging. Comput. Biol. Med. predicting dice coefficient of digital histopathology image
2020; 127: 104097. segmentation. arXiv preprint arXiv:2109.00115. 2021.
PubMed Abstract|Publisher Full Text 35. Andrade C: Understanding the difference between standard
20. Minnema J, van Eijnatten M, Kouw W, et al.: CT image segmentation deviation and standard error of the mean, and knowing when to
of bone for medical additive manufacturing using a use which. Indian J. Psychol. Med. 2020; 42(4): 409–410.
convolutional neural network. Comput. Biol. Med. 2018; 103: PubMed Abstract|Publisher Full Text
130–139. 36. Hammernik K, Knoll F, Rueckert D: Deep Learning for Parallel MRI
PubMed Abstract|Publisher Full Text Reconstruction: Overview, Challenges, and Opportunities.
21. Kumar SN, Bruntha PM, Daniel SI, et al.; Lung Nodule MAGNETOM Flash. 2019; 4: 10–15.
Segmentation Using UNet. 2021 7th International Conference on 37. Sankaravadivel V, Thalavaipillai S: Symptoms based endometriosis
Advanced Computing and Communication Systems (ICACCS). 2021, prediction using machine learning. Bull. Electr. Eng. Inform. 2021;
March; Vol. 1: (pp. 420–424). IEEE. 10(6): 3102–3109.
22. Hatamizadeh A, Tang Y, Nath V, et al.: Unetr: Transformers for 3d Publisher Full Text
medical image segmentation. Proceedings of the IEEE/CVF Winter 38. Lu Y, Lu G, Zhou Y, et al.: Highly shared convolutional neural
Conference on Applications of Computer Vision. 2022; (pp. 574–584). networks. Expert Syst. Appl. 2021; 175: 114782.
23. Kiranmai TS, Lakshmi PV: 3D Convolution Neural Network Based Publisher Full Text
Ensemble Model to Detect Endometrium Issues at Early Stages 39. Mela CA, Liu Y: Application of convolutional neural networks
and Enhance Fertility Chances in Women. Des. Eng. 2021; towards nuclei segmentation in localization-based super-
1032–1044. resolution fluorescence microscopy images. BMC Bioinform.
24. Kiruthika V, Sathiya S, Ramya MM: Machine learning based 2021; 22(1): 1–30.
ovarian detection in ultrasound images. Int. J. Adv. Mechatron. Publisher Full Text
Syst. 2020; 8(2-3): 75–85. 40. Wang Y, Zheng C, Peng H: Covariance Mean-to-Standard-
Publisher Full Text Deviation Factor for Ultrasound Imaging. 2020 IEEE International
25. Kurata Y, Nishio M, Kido A, et al. : Automatic segmentation of the Ultrasonics Symposium (IUS). 2020, September; (pp. 1–4).IEEE.
uterus on MRI using a convolutional neural network. Comput. 41. Sudalaimuthu T: Endometrium Phase prediction using K-means
Biol. Med. 2019; 114: 103438. Clustering through the link of Diagnosis and procedure. 2021 8th
PubMed Abstract|Publisher Full Text International Conference on Signal Processing and Integrated Networks
26. Gupta S, Ali S, Goldsmith L, et al.: Mi-unet: Improved segmentation (SPIN). 2021, August; (pp. 1178–1181). IEEE.
in ureteroscopy. 2020 IEEE 17th International Symposium on 42. Zhao B, Zhang X, Li Z, et al.: A multi-scale strategy for deep
Biomedical Imaging (ISBI). 2020, April; (pp. 212–216). IEEE. semantic segmentation with convolutional neural networks.
27. Yang T, Han J, Zhu H, et al.: Segmentation of five components in Neurocomputing. 2019; 365: 273–284.
four chamber view of fetal echocardiography. 2020 IEEE 17th Publisher Full Text
International Symposium on Biomedical Imaging (ISBI). 2020, April; 43. Leibetseder A, Schoeffmann K, Keckstein J, et al.: Endometriosis
(pp. 1962–1965). IEEE. detection and localization in laparoscopic gynecology. Multimed.
28. Wu X, Chen S, Huang J, et al.: DDeep3M: Docker-powered deep Tools Appl. 2022; 81: 6191–6215.
learning for biomedical image segmentation. J. Neurosci. Publisher Full Text
Methods. 2020; 342: 108804. 44. Giusti S, Forasassi F, Bastiani L, et al.: Anatomical localization of
PubMed Abstract|Publisher Full Text deep infiltrating endometriosis: 3D MRI reconstructions.
29. Souza CA, Menegatti JE, Pazello RT, et al.: Neural Network Image Abdom. Imaging. 2012; 37(6): 1110–1121.
Segmentation Model for Laparoscopic Gynecological Surgeries. PubMed Abstract|Publisher Full Text
J. Minim. Invasive Gynecol. 2021; 28(11): S18. 45. Ma Z, Jorge RNM, Tavares JMR: Bladder wall segmentation in MR
Publisher Full Text images. USNCCM-11-11th US National Congress of Computational
30. Simpson AL, Antonelli M, Bakas S, et al.: A large annotated medical Mechanics. 2011.
image dataset for the development and evaluation of 46. Visalaxi S, Sudalaimuthu T: Endometriosis Dataset Description
segmentation algorithms. arXiv preprint arXiv:1902.09063. 2019. and Mean Standard Calculation. figshare. Dataset. 2022.
31. Leibetseder A, Kletz S, Schoeffmann K, et al.: GLENDA: gynecologic Publisher Full Text
laparoscopy endometriosis dataset. International Conference on 47. Visalaxi S, Sudalaimuthu T: Automated Segmentation of
Multimedia Modeling. Cham: Springer; 2020, January; (pp. 439–450). Endometriosis using Transfer Learning. 2022.
32. Zhao X, Vemulapalli R, Mansfield PA, et al.: Contrastive Learning for Publisher Full Text
Label Efficient Semantic Segmentation. Proceedings of the IEEE/
CVF International Conference on Computer Vision. 2021;
(pp. 10623–10633).
Page 15 of 16F1000Research 2022, 11:360 Last updated: 23 JUN 2022
The benefits of publishing with F1000Research:
• Your article is published within days, with no editorial bias
• You can publish traditional articles, null/negative results, case reports, data notes and more
• The peer review process is transparent and collaborative
• Your article is indexed in PubMed after passing peer review
• Dedicated customer support at every stage
For pre-submission enquiries, contact research@f1000.com
Page 16 of 16You can also read