Automatic Facial Expression Recognition in Standardized and Non-standardized Emotional Expressions
←
→
Page content transcription
If your browser does not render page correctly, please read the page content below
ORIGINAL RESEARCH
                                                                                                                                                   published: 05 May 2021
                                                                                                                                          doi: 10.3389/fpsyg.2021.627561

                                                Automatic Facial Expression
                                                Recognition in Standardized and
                                                Non-standardized Emotional
                                                Expressions
                                                Theresa Küntzler 1*† , T. Tim A. Höfling 2† and Georg W. Alpers 2
                                                1
                                                 Department of Politics and Public Administration, Center for Image Analysis in the Social Sciences, Graduate School of
                                                Decision Science, University of Konstanz, Konstanz, Germany, 2 Department of Psychology, School of Social Sciences,
                                                University of Mannheim, Mannheim, Germany

                                                Emotional facial expressions can inform researchers about an individual’s emotional state.
                                                Recent technological advances open up new avenues to automatic Facial Expression
                                                Recognition (FER). Based on machine learning, such technology can tremendously
                                                increase the amount of processed data. FER is now easily accessible and has been
                                                validated for the classification of standardized prototypical facial expressions. However,
                                                applicability to more naturalistic facial expressions still remains uncertain. Hence, we
                                                test and compare performance of three different FER systems (Azure Face API,
                                                Microsoft; Face++, Megvii Technology; FaceReader, Noldus Information Technology)
                            Edited by:
                                                with human emotion recognition (A) for standardized posed facial expressions (from
                        Yizhang Jiang,
              Jiangnan University, China        prototypical inventories) and (B) for non-standardized acted facial expressions (extracted
                       Reviewed by:             from emotional movie scenes). For the standardized images, all three systems classify
                    Yuanpeng Zhang,             basic emotions accurately (FaceReader is most accurate) and they are mostly on par
          Nantong University, China
                         Hillel Aviezer,
                                                with human raters. For the non-standardized stimuli, performance drops remarkably
Hebrew University of Jerusalem, Israel          for all three systems, but Azure still performs similarly to humans. In addition,
                 *Correspondence:               all systems and humans alike tend to misclassify some of the non-standardized
                     Theresa Küntzler
                                                emotional facial expressions as neutral. In sum, emotion recognition by automated facial
   theresa.kuentzler@uni-konstanz.de
                                                expression recognition can be an attractive alternative to human emotion recognition
 † These   authors share first authorship
                                                for standardized and non-standardized emotional facial expressions. However, we also
                     Specialty section:
                                                found limitations in accuracy for specific facial expressions; clearly there is need for
           This article was submitted to        thorough empirical evaluation to guide future developments in computer vision of
                        Emotion Science,        emotional facial expressions.
                 a section of the journal
                 Frontiers in Psychology        Keywords: recognition of emotional facial expressions, software evaluation, human emotion recognition,
       Received: 11 November 2020               standardized inventories, naturalistic expressions, automatic facial coding, facial expression recognition, specific
          Accepted: 11 March 2021               emotions
           Published: 05 May 2021

                              Citation:
           Küntzler T, Höfling TTA and
                                                1. INTRODUCTION
   Alpers GW (2021) Automatic Facial
             Expression Recognition in
                                                Detecting emotional processes in humans is important in many research fields such as psychology,
  Standardized and Non-standardized             affective neuroscience, or political science. Emotions influence information processing (e.g.,
               Emotional Expressions.           Marcus et al., 2000; Meffert et al., 2006; Fraser et al., 2012; Soroka and McAdams, 2015), attitude
           Front. Psychol. 12:627561.           formation (e.g., Lerner and Keltner, 2000; Marcus, 2000; Brader, 2005), and decision making (Clore
     doi: 10.3389/fpsyg.2021.627561             et al., 2001; Slovic et al., 2007; Pittig et al., 2014). One well-established strategy to measure emotional

Frontiers in Psychology | www.frontiersin.org                                          1                                             May 2021 | Volume 12 | Article 627561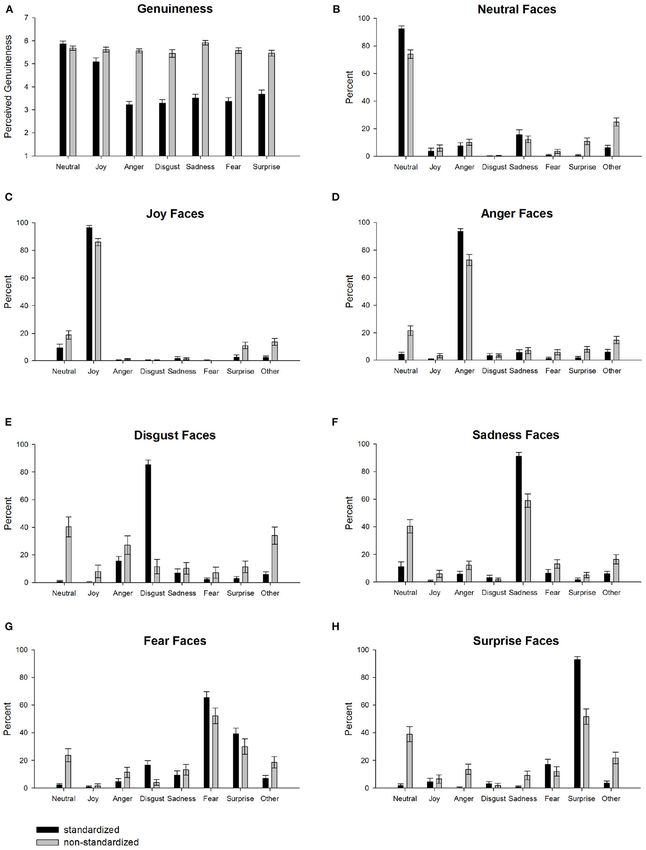
Küntzler et al.                                                                                                         Comparison of FER Systems

reactions of individuals is to track their facial expressions             and good lighting condition (Stöckli et al., 2018; Beringer et al.,
(Scherer and Ellgring, 2007; Keltner and Cordaro, 2017). The              2019; Sato et al., 2019; Kulke et al., 2020). However, all of these
classic approach to analyse emotional facial responses is either          studies present their participants prototypical facial expression
an expert observation such as the Facial Action Coding System             and instruct them to mimic these visual cues. This might result
(FACS) (Sullivan and Masters, 1988; Ekman and Rosenberg,                  in an overestimation of FER performance in comparison to non-
1997; Cohn et al., 2007) or direct measurement of facial muscle           standardized facial expressions and moreover truly naturalistic
activity with electromyography (EMG) (Cohn et al., 2007). Both            emotional facial expressions.
are, however, time-consuming with respect to both, application                Previous research also documents systematic misclassification
and analysis.                                                             of different FER systems and emotion categories. For fear,
   A potential alternative to facilitate, standardize, and scale          studies find a consistently lower accuracy compared to other
research on facial expressions is automatic image-based Facial            emotion categories (Lewinski et al., 2014; Stöckli et al., 2018;
Expression Recognition (FER), which has recently emerged from             Skiendziel et al., 2019). Some studies also report a substantial
computer vision technology. Using machine learning, algorithms            decrease in accuracy for anger (Lewinski et al., 2014; Stöckli
are being developed that extract emotion scores from observed             et al., 2018; Dupré et al., 2020), whereas Skiendziel et al.
facial expressions (Goodfellow et al., 2015; Arriaga et al., 2017;        (2019) report an improvement of this measurement in their
Quinn et al., 2017), which is considerably more time and                  study. Less consistently, sadness (Lewinski et al., 2014; Skiendziel
cost efficient compared to classical approaches (Bartlett et al.,         et al., 2019) and disgust are also found to be error prone
1999). FER is easily accessible to researchers of all fields and is       (Skiendziel et al., 2019). In contrast, the facial expression of joy is
increasingly used by the scientific community. Applications can           systematically classified with the highest accuracy (Stöckli et al.,
be found, for example, in psychology, where such algorithms are           2018; Skiendziel et al., 2019; Dupré et al., 2020). When looking
used to predict mental health from social media images (Yazdavar          at confusion between emotions in prior studies, FaceReader
et al., 2020), to validate interventions for autism (Wu et al.,           shows a tendency toward increased neutral measures for all other
2019), or to screen for Parkinson’s disease (Jin et al., 2020). A         emotions (Lewinski et al., 2014) and a tendency to misclassify
sociological example is the assessment of collective happiness            fearful faces as surprise (Stöckli et al., 2018; Skiendziel et al.,
in society from social media images (Abdullah et al., 2015).              2019). Studies that compared different FER systems consistently
In political science, one example is the study of representation          find a large variation in performance between systems (Stöckli
of politicians in the media using FER (Boxell, 2018; Peng,                et al., 2018; Dupré et al., 2020) which underlines the need for
2018; Haim and Jungblut, 2020). Furthermore, the technology is            comparatives studies.
used in consumer and market research, for example to predict                  Besides a general lack of studies, that directly compare
advertisement efficiency (Lewinski et al., 2014; Teixeira et al.,         different FER systems, empirical validation of FER to recognize
2014; Bartkiene et al., 2019).                                            emotional facial expressions is limited to intensely posed
                                                                          expressions. In contrast to those images, naturalistic or
                                                                          spontaneous facial expressions show stronger variations and
1.1. Prototypical vs. Naturalistic Facial                                 are often less intense in comparison to standardized facial
Expressions                                                               expressions (Calvo and Nummenmaa, 2016; Barrett et al.,
Training and testing of FER tools is typically conducted on               2019). For example Sato et al. (2019) find a strong decrease
data sets, which contain prototypical and potentially exaggerated         in FER performance if participants respond spontaneously to
expressions (Dhall et al., 2012). The images of these inventories         imagined emotional episodes. Höfling et al. (2020) report strong
are created under standardized (detailed instructions for the             correlations of FER parameters and participants’ emotion ratings
actors) and well-controlled conditions (e.g., lighting, frontal           that spontaneously respond to pleasant emotional scenes, but
face angle; Lewinski et al., 2014; Calvo et al., 2018; Stöckli            find no evidence for a valid FER detection of spontaneous
et al., 2018; Beringer et al., 2019; Skiendziel et al., 2019). As         unpleasant facial reactions. Other studies report a decrease in
a result, the classification performance of FER systems and its           FER emotion recognition for more subtle and naturalistic facial
generalizability to non-standardized and more naturalistic facial         expressions (Höfling et al., 2021) and find a superiority of
expressions is uncertain.                                                 humans to decode such emotional facial responses (Yitzhak et al.,
   For prototypical facial expressions, FER also corresponds well         2017; Dupré et al., 2020). However, the data sets applied are
to human FACS coding (Bartlett et al., 1999; Tian et al., 2001;           still comprised of images collected in a controlled lab setting,
Skiendziel et al., 2019) and non-expert human classification              with little variation on lighting, camera angle, or age of the
(Bartlett et al., 1999; Lewinski, 2015; Calvo et al., 2018; Stöckli       subject which might further decrease FER performance under
et al., 2018). Accuracy is high for static images (Lewinski et al.,       less restricted recording conditions.
2014; Lewinski, 2015; Stöckli et al., 2018; Beringer et al., 2019)
as well as for dynamic facial expressions from standardized               1.2. Aims, Overview, and Expectations
inventories (Mavadati et al., 2013; Zhang et al., 2014; Yitzhak           In summary, FER offers several advantages in terms of
et al., 2017; Calvo et al., 2018). There is also growing evidence         efficiency and we already know that it performs well on
that FER provides valid measures for most emotion categories if           standardized, prototypical emotional facial expressions. Despite
naive participants are instructed to pose intense emotional facial        many advantages of FER application and their validity to decode
expressions in a typical lab setting with frontal face recording          prototypical facial expression, the quality of the expression

Frontiers in Psychology | www.frontiersin.org                         2                                        May 2021 | Volume 12 | Article 627561
Küntzler et al.                                                                                                       Comparison of FER Systems

measurement and its generalizability to less standardized facial          actors who were instructed to display prototypical emotional
expressions is uncertain. Because the underlying algorithms               expressions and, in addition, an inventory of actors displaying
remain unclear to the research community, including the applied           more naturalistic emotional facial expressions in movie stills.
machine-learning and its specific training procedure, empirical           We extract probability parameters for facial expressions
performance evaluation is urgently needed. Hence, this paper has          corresponding to six basic emotions (i.e., joy, anger, sadness,
two main aims: First, we provide an evaluation and a comparison           disgust, fear, surprise, and neutral) from all tools. As a
of three widely used systems that are trained to recognize                benchmark, we collect data from human raters who rated subsets
emotional facial expressions (FaceReader, Face++, and the Azure           of the same images.
Face API) and compare them with human emotion recognition
data as a benchmark. Second, we evaluate the systems on acted             2.1. Images of Facial Expressions
standardized and non-standardized emotional facial expressions:           We test the different FER tools as well as human facial recognition
The standardized facial expressions are a collection of four              data on standardized and non-standardized emotional facial
facial expression inventories created in a lab setting displaying         expressions displayed in still images. All selected inventories
intense prototypical facial expressions [The Karolinska Directed          are publicly available for research and contain emotional facial
Emotional Faces (Lundqvist et al., 1998), the Radboud Faces               expression images of the basic emotion categories. Table 1
Database (Langer et al., 2010), the Amsterdam Dynamic Facial              displays the emotion categories and image distributions for both
Expression Set (Van der Schalk et al., 2011), and the Warsaw Set          data sets (i.e., standardized and non-standardized) including
of Emotional Facial Expression (Olszanowski et al., 2015)]. To            drop out rates specifically for the three FER tools.
approximate more naturalistic emotional expressions, we use a                Standardized facial expressions are a collection of images
data set of non-standardized facial expressions: The Static Facial        created in the lab with controlled conditions (i.e., good lighting,
Expressions in the Wild data set (Dhall et al., 2018), which is           frontal head positions, directed view) displaying prototypical
built from movie scenes and covers a larger variety of facial             expressions of clearly defined emotions. In order to maximize
expressions, lighting, camera position, and actor ages.                   image quantity and introduce more variability, the prototypical
    FER systems provide estimations for the intensity of specific         images consist of four databases: (1) The Karolinska Directed
emotional facial expressions through two subsequent steps: The            Emotional Faces contains images of 35 males and 35 females
first step is face detection including facial feature detection and       between 20 and 30 years old (Lundqvist et al., 1998). The
the second step is face classification into an emotion category.          present study uses all frontal images (resolution: 562 × 762). (2)
For face detection, we expect that different camera angles, but           The Radboud Faces Database, which contains images of facial
also characteristics of the face such as glasses or beards will           expressions of 20 male and 19 female Caucasian Dutch adults
increase FER face detection failures resulting in higher rates of         (Langer et al., 2010). We used the subset of adult models looking
drop out. We expect the standardized expressions to result in             straight into the camera with images taken frontal (resolution:
less drop out due to failures in face detection, since the camera         681 × 1,024). (3) The Amsterdam Dynamic Facial Expression
angle is constantly frontal, and no other objects such as glasses         Set, from which we used the still image set (resolution: 720 ×
obstruct the faces. Correspondingly, we expect more drop out              576). The models are distinguished between being Northern-
in the non-standardized data set, which means there are more              European (12 models, 5 females) and Mediterranean (10 models,
images where faces are not detected, since the variability of the         5 of them female; Van der Schalk et al., 2011). (4) The Warsaw
facial expressions is higher. For the second step (i.e., emotion          Set of Emotional Facial Expression offers images of 40 models
classification), we expect strong variation between emotion               (16 females, 14 males) displaying emotional facial expressions
categories (e.g., increased performance for joy faces, decreased          (Olszanowski et al., 2015). Images are taken frontal and the
performance on fear faces). We further expect a tendency toward           complete set is used in this study (resolution: 1,725 × 1,168). This
the neutral category and a misclassification of fear as surprise.         results in an overall of 1,246 images evenly distributed over the
As explained for the drop outs, we assume the non-standardized            relevant emotion categories.
images to be more variable and therefore more difficult to                   Non-standardized facial expressions stem from a data set that
classify. The overall performance on the non-standardized                 was developed as a benchmark test for computer vision research
data is therefore expected to be lower. This research provides            for more naturalistic settings. The Static Facial Expressions
important information about the generalizability of FER to more           in the Wild (SFEW) data set consists of stills from movie
naturalistic, non-standardized emotional facial expressions and           scenes that display emotions in the actors’ faces. Examples of
moreover the performance comparison of specific FER systems.              movies are “Harry Potter” or “Hangover” (Dhall et al., 2018).
                                                                          This study uses the updated version (Dhall et al., 2018). The
                                                                          data set was compiled using the subtitles for the deaf and
2. MATERIALS AND METHODS                                                  hearing impaired and closed caption subtitles. These subtitles
                                                                          contain not only the spoken text, but additional information
We use three different facial expression recognition tools and            about surrounding sounds, such as laughter. The subtitles were
human emotion recognition data to analyze emotional facial                automatically searched for words suggesting emotional content.
expressions in more or less standardized facial expressions.              Scenes resulting from this search were then suggested to trained
As an approximation to standardized and non-standardized                  human coders, who classified and validated the final selection
facial expressions we analyze static image inventories of                 of emotional facial expressions for this inventory (Dhall et al.,

Frontiers in Psychology | www.frontiersin.org                         3                                      May 2021 | Volume 12 | Article 627561
Küntzler et al. Comparison of FER Systems
TABLE 1 | Category distributions of test data and drop outs of Azure, Face++, and FaceReader.
Standardized data
Neutral Happy Sad Fear Angry Surprise Disgust Overall
Absolute frequency of images 178 178 178 178 178 178 178 1246
Relative frequency of images 14.3 14.3 14.3 14.3 14.3 14.2 14.2 100
Drop out rates (percent per category)
Face++ 0.0 0.0 0.0 0.0 0.0 0.0 0.0 0.0
Azure 0.0 0.0 0.0 0.0 0.0 0.0 0.0 0.0
FaceReader 0.6 0.0 0.0 1.1 1.1 2.2 1.2 0.88
Non-standardized data
Neutral Happy Sad Fear Angry Surprise Disgust Overall
Absolute frequency of images 236 270 245 143 254 151 88 1387
Relative frequency of images 17.0 19.5 17.7 10.3 18.3 10.9 6.3 100
Drop out rates (percent per category)
Face++ 0.0 0.7 0.8 0.7 0.4 0.0 1.1 0.5
Azure 16.9 11.1 25.3 26.6 25.2 17.9 23.9 20.3
FaceReader 73.3 70.0 75.1 79.0 76.8 74.8 69.3 74.2
Percentages are rounded to the first decimal. The base of the percentage is the respective total of each category. Reading example: Azure did not find a face in 16.9% of the 236 neutral
images of the non-standardized data and a total of 20.3% of the 1387 images dropped out because of no face detection.
2012). We use these images to rigorously test how well the further analyses (17 participants rated between 20 and 126
systems perform on images that are not prototypical and not pictures). This results in 101 participants (58 female, 42 male,
taken under standardized conditions (variable lighting and head 1 diverse, Mage = 29.2, SDage = 9.1) who rated on average
positions). The inventory consists of 1,387 images (resolution: 116.1 (SD = 28.1) images. Twenty-five images were randomly not
720 × 576) which are unevenly distributed across emotion rated by any participants (< 1%). Participants were instructed to
categories (minimum of 88 images for disgust and a maximum classify facial expression as neutral, joy, sadness, anger, disgust,
of 270 images for joy). fear, surprise, or another emotion. Multiple choices were possible.
In addition, the perceived genuineness of the expressed emotion
2.2. Facial Expression Recognition Tools was rated on a 7-point Likert scale (1 -very in-genuine, 7 -
We test three FER tools: The Microsoft Azure Face API (Version very genuine). All ratings are averaged per image to improve
1.0, Microsoft), Face++ (Version 3.0, Megvii Technology) and comparability to the metric provided by the FER tools. This
FaceReader (Version 8.0, Noldus Information Technology). The results in percentages of emotion ratings and average values per
first two are easily accessible APIs, which also offer a free image for the genuineness ratings.
subscription. FaceReader is a software to be installed locally on
a computer and is well-established in the research community.
Each of the systems allow to analyse faces in images, with 2.4. Analyses
functions such as face detection, face verification, and emotion First, we analyze the human raters’ scores for perceived
recognition. They all provide probability scores for neutral, joy, genuineness and emotion classification as a manipulation
sadness, anger, disgust, fear, and surprise. While scores of Azure check for the two data sets of facial expressions. Differences
and FaceReader are between 0 and 1, Face++ uses a scale from between the genuineness of non-standardized vs. standardized
1 to 100. We thus rescale Face++ scores to 0 to 1. FaceReader facial expressions are tested statistically for all images
specifically provides an additional quality parameter and it is as well as separately for all emotion categories utilizing
suggested to remove images, if the quality of face detection is too independent t-tests. Correspondingly, we analyze the
low. Therefore, we remove all images with a quality parameter human emotion recognition data to provide a benchmark
below 70%. for the FER comparison. Again we statistically test for
differences between non-standardized vs. standardized
2.3. Human Emotion Recognition facial expressions for all emotion categories utilizing
As a benchmark for the FER results we collected emotion independent t-tests. In addition, we calculate one-sample
recognition data of humans who each rate a random subsample t-tests against zero to estimate patterns of misclassification
of up to 127 of the 2,633 images each in an online study. within human emotion recognition. Cohen’s d is reported
Participants who rated less than 20 images are excluded for for all t-tests.
Frontiers in Psychology | www.frontiersin.org 4 May 2021 | Volume 12 | Article 627561Küntzler et al. Comparison of FER Systems
Second, we test the performance of face detection. As 3. RESULTS
described above, FER is a two step process of first face detection
and second emotion classification. To test performances on face 3.1. Human Raters: Genuineness of Facial
detection, we check for how many images a specific tool gives no Expressions
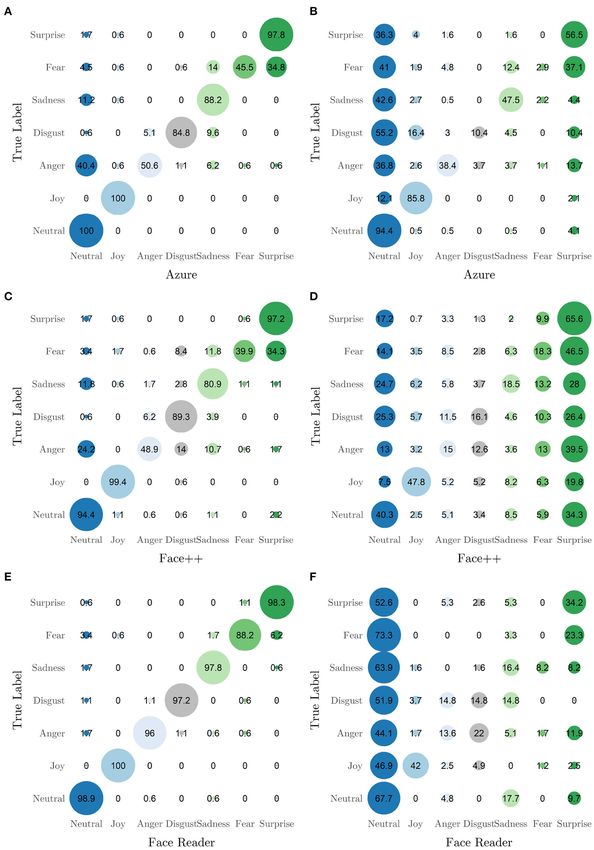
result (drop out rate). We test for differences between standardized and non-
Third, we calculate several indices of emotion classification standardized facial expression inventories regarding their
(i.e., accuracy, sensitivity, and precision) for the three FER perceived genuineness (see Figure 1A). Analysis shows that
tools to report performance differences descriptively. In order the non-standardized facial expressions are perceived as much
to evaluate emotion classification, each algorithm’s output is more genuine compared to the standardized facial expressions
compared to the original coding of the intended emotional facial [standardized inventories: M = 4.00, SD = 1.43; non-
expression category (i.e., ground truth). The different tools return standardized inventory: M = 5.64, SD = 0.79; t(2606) = 36.58,
values for each emotion category. We define the category with the p < 0.001, d = 1.44]. In particular, non-standardized facial
highest certainty as the chosen one, corresponding to a winner– expressions are rated as more genuine for anger, t(426) = 27.97,
takes–all principle1 . A general indication of FER performance is p < 0.001, d = 2.75, sadness, t(418) = 25.55, p < 0.001, d =
the accuracy, which is the share of correctly identified images 2.43, fear, t(317) = 21.10, p < 0.001, d = 2.38, disgust, t(263)
out of all images, where a face is processed (thus, excluding = 18.10, p < 0.001, d = 2.36, surprise, t(322) = 16.02, p < 0.001,
drop out)2 . Other excellent measures to evaluate emotion d = 1.79, and joy, t(441) = 5.58, p < 0.001, d = 0.54, whereas
classification are category specific sensitivity and precision. among the standardized inventories neutral facial expressions are
Sensitivity describes the share of correctly predicted images out rated more genuine, t(407) = 2.36, p = 0.019, d = 0.24. These
of all images truly in the respective category. It is a measure of results support the validity of the selection of image test data—
how well the tool does in detecting a certain category. Precision the standardized facial expressions are perceived less genuine
is the share of correctly predicted images out of all images compared to the non-standardized facial expressions.
predicted as one category. In other words, precision is a measure
of how much we can trust the categorization of the tool. In 3.2. Human Raters: Emotion Recognition
order to identify patterns of classifications, we additionally build Next, we analyze the human emotion ratings (see Figures 1B–H).
confusion matrices for the FER measurement and true categories. Comparisons against zero show that for most emotion categories,
Fourth, we report differences in emotion recognition classifications are highest for the correct category. The only
performance between the three systems and human data with exception are non-standardized disgust faces that are more often
Receiver Operating Characteristic (ROC) analysis and statistical categorized as angry, t(87) = 7.99, p < 0.001, d = 0.85, than
testing of the corresponding Area Under the Curve (AUC). ROC disgusted, t(87) = 4.40, p < 0.001, d = 0.47. In addition,
analysis is initially a two-class classification strategy. In order fearful faces are also misclassified (or at least co-classified) as
to apply the ROC rationale to a multi-class classification, we surprise for standardized, t(175) = 18.22, p < 0.001, d = 1.37,
consider each probability given to a category as one observation. and non-standardized facial expressions, t(142) = 10.69, p <
In other words, each image makes up for seven observations for 0.001, d = 0.89. A comparison between standardized and non-
each tool. The ROC curve plots a true positive share against standardized data reveals a strong increase in neutral ratings for
a false positive share for varying probability thresholds above non-standardized emotion categories [disgust: t(263) = 15.03, p
which a category is considered correct. A good classifier gives < 0.001, d = 1.96; surprise: t(322) = 14.33, p < 0.001, d =
low probabilities to wrong classifications and high probabilities 1.60; fear: t(317) = 9.54, p < 0.001, d = 1.07; sadness: t(418) =
to correct classifications. This is measured by the AUC. Better 9.01, p < 0.001, d = 0.89; anger: t(426) = 7.96, p < 0.001, d =
classifiers give larger AUCs. We compare AUCs of the different 0.78; joy: t(441) = 4.26, p < 0.001, d = 0.41]. Correspondingly,
algorithms pairwise, using a bootstrapping method with 2,000 non-standardized facial expressions show a strong decrease in
draws (Robin et al., 2011). the correct emotion category compared to standardized facial
Analyses are conducted in R (R Core Team, 2019), using expressions for some categories [disgust: t(263) = 24.63, p <
the following packages (alphabetical order): caret (Kuhn, 2020), 0.001, d = 3.21; surprise: t(322) = 14.35, p < 0.001, d = 1.60;
data.table (Dowle and Srinivasan, 2020), dplyr (Wickham et al., sadness: t(418) = 10.28, p < 0.001, d = 1.02; neutral: t(407) =
2020), extrafont (Chang, 2014), ggplot2 (Wickham, 2016), httr 8.99, p < 0.001, d = 0.90; anger: t(426) = 8.03, p < 0.001, d =
(Wickham, 2020), jsonlite (Ooms, 2014), patchwork (Pedersen, 0.79; joy: t(441) = 5.83, p < 0.001, d = 0.57; fear: t(317) = 3.79, p
2020), plotROC (Sachs, 2017), pROC (Robin et al., 2011), purrr < 0.001, d = 0.43]. Taken together, non-standardized compared
(Henry and Wickham, 2020), RColorBrewer (Neuwirth, 2014), to standardized facial expressions are perceived more often as
stringr (Wickham, 2019), tidyverse (Wickham et al., 2019). neutral and less emotionally intense on average.
1 We also test different thresholds, but there is no reasonable performance 3.3. FER Systems: Drop Out
improvement to be gained (see Supplementary Figure 1). To evaluate the step of face detection, we report drop out
2 Since this procedure leads to different samples for each algorithm, especially
rates separately for each FER tool in Table 1. Drop out for
among the non-standardized data, we also compute the analysis for the subsample
of non-standard images, which are recognized by all algorithms. The results are
the standardized data is nearly non-existent, however, strong
reported in Supplementary Table 3. Differences are minor, qualitatively the results differences can be reported for the non-standardized data set.
remain the same. Azure returns no face detection for around 20% of the images.
Frontiers in Psychology | www.frontiersin.org 5 May 2021 | Volume 12 | Article 627561Küntzler et al. Comparison of FER Systems FIGURE 1 | Averaged human ratings separately for basic emotion categories for standardized (black bars) and non-standardized facial expressions (gray bars). (A) Depicts mean genuineness ratings ranging from 1 (very in-genuine) to 7 (very genuine). (B–H) Depict mean emotion ratings (percent) for (B) neutral, (C) joy, (D) anger, (E) disgust, (F) sadness, (G) fear, and (H) surprise expressions. Error bars are 95% confidence intervals. Frontiers in Psychology | www.frontiersin.org 6 May 2021 | Volume 12 | Article 627561
Küntzler et al.                                                                                                                                       Comparison of FER Systems

TABLE 2 | Sensitivity, precision, and accuracy of Azure, Face++, and FaceReader separately for emotion categories.

                                          Azure                                                   Face++                                             FaceReader

                          Stand.                    Non-Stand.                      Stand.                   Non-Stand.                    Stand.                 Non-Stand.

                  Sens             Prec           Sens          Prec        Sens             Prec         Sens           Prec       Sens            Prec      Sens           Prec

Neutral            1.00            0.63           0.94          0.38         0.94            0.70          0.40          0.34       0.99            0.92       0.68          0.2
Joy                1.00            0.98           0.85          0.88         0.99            0.96          0.48          0.76       1.00            0.99       0.42          0.92
Anger              0.51            0.91           0.38          0.87         0.49            0.84          0.15          0.36       0.96            0.99       0.14          0.42
Disgust            0.85            0.98           0.10          0.50         0.89            0.77          0.16          0.17       0.97            0.99       0.15          0.17
Sadness            0.88            0.75           0.48          0.77         0.81            0.75          0.19          0.40       0.98            0.97       0.16          0.32
Fear               0.46            0.99           0.03          0.33         0.40            0.95          0.18          0.18       0.88            0.97       0.00          0.00
Surprise           0.98            0.73           0.56          0.43         0.97            0.71          0.66          0.20       0.98            0.93       0.34          0.33
Average            0.81            0.85           0.48          0.59         0.79            0.81          0.32          0.35       0.97            0.97       0.27          0.34
Accuracy                   0.81                          0.57                        0.79                         0.32                      0.97                      0.31

Stand., standardized data; Non-Stand., non-standardized data; Sens., sensitivity; Prec., precision.

For FaceReader, the drop out is even higher with 74%3 . This                                     category, only Azure’s precision is acceptable. Face++, and
result partially confirms our expectations, as for Azure and                                     FaceReader do not perform reliably. Performance on the other
FaceReader the drop out in the non-standardized data is much                                     categories on the standardized data resembles each other:
higher than among the standardized data. In contrast, Face++                                     FaceReader clearly outperforms the other tools. In contrast, for
shows superior face detection with nearly no drop out for the                                    the non-standardized facial expressions, Azure performs best,
non-standardized data. See Supplementary Table 1 for statistical                                 although the values are substantially decreased in comparison to
comparison of the drop out rates.                                                                standardized facial expressions.
                                                                                                    To study confusion rates between categories, Figure 2 depicts
3.4. FER Systems: Emotion Recognition                                                            confusion matrices between the true labels and the highest
To descriptively compare classification performance, we report                                   rated emotion by each software. In the standardized data, all
accuracies for each tool on each data set, along with category                                   three tools show the pattern of classifying fearful expressions as
specific sensitivity and precision (Table 2). Details on the                                     surprise or sadness. The confusion between fear and surprise
statistical comparisons can be found in Supplementary Table 24 .                                 is expected, whereas the confusion of fear with sadness is
As expected, accuracy is better for all tools on the standardized                                new. Additionally, Azure and Face++ show a tendency to
data. FaceReader performs best, with 97% of the images classified                                misclassify anger, sadness and fear as neutral. For FaceReader,
correctly. The difference to both Azure and Face++ is significant                                this tendency is observable to a smaller extent. This reflects
(p < 0.001). Azure and Face++ perform similarly, p =                                             partially the expected tendency toward a neutral expression.
0.148, both put around 80% of the images in the correct                                          In the non-standardized data set, all applications show a
category. For the non-standardized data, accuracy is much                                        pronounced tendency toward the neutral category. Additionally,
lower. Azure performs best, still correctly classifying 56% of the                               Face++ shows a trend toward surprise, sadness and fear. To a
images. FaceReader and Face++ both correctly classify only about                                 smaller extend, the misclassification to surprise and sadness is
one third of the non-standardized images which constitutes a                                     problematic in Azure and FaceReader alike.
significant decrease of accuracy compared to Azure (p < 0.001).
   Looking at the specific emotion categories and their
                                                                                                 3.5. Humans vs. FER: Comparison of
performance indices, joy expressions are classified best. For
the standardized data, both sensitivity and precision are or                                     Emotion Recognition
nearly are all 1. Also for the non-standardized data, the joy                                    To directly compare all sources of emotion recognition, we
category is classified best. However, Azure is the only software                                 calculate ROC curves and report them in Figure 3 along with the
with overall acceptable performance. In the standardized angry                                   corresponding AUCs. ROC curves for specific emotion categories
category, all tools show high precision, however Azure and                                       are shown in Supplementary Figure 2 and corresponding
Face++ lack in sensitivity. For the non-standardized angry                                       statistical comparisons are reported in Supplementary Table 55 .
                                                                                                    For the standardized facial expressions (see Figure 3A),
3 Twenty  percent of the images have a quality that is too low for FaceReader to                 humans, overall, recognize them significantly better than Azure,
reliably detect emotions and we therefore exclude these from the analysis, in 54%                p = 0.035, and Face++, p < 0.001. However, FaceReader
no face is found by FaceReader.                                                                  performs significantly better than humans on such facial
4 Since drop out rates differ strongly between the algorithms, especially among the
                                                                                                 expressions, p < 0.001. While the same pattern holds true for
naturalistic data, we also compute the analysis for the subset of naturalistic images,
which are recognized by all algorithms. Differences are minor with corresponding
patterns (see also Supplementary Table 4). Additionally, we report the shares of                 5 AUC analysis for the subset of non-standardized data passed by all algorithms

correctly identified images based on all images in Supplementary Table 3.                        yields the same results.

Frontiers in Psychology | www.frontiersin.org                                                7                                             May 2021 | Volume 12 | Article 627561
Küntzler et al. Comparison of FER Systems FIGURE 2 | Confusion matrices indicating classification performance on standardized (left panels) and non-standaridzed data (right panels): (A) standardized data by Azure, (B) non-standardized data by Azure, (C) standardized data by Face++, (D) non-standardized data by Face++, (E) standardized data by FaceReader and (F) non-standardized data by FaceReader. Numbers indicate percentages to the base of the true category. Reading example: From the standardized data Azure classifies 4.5% of the truly fearful expressions as neutral. The 45.5% of the fearful images are classified correctly. Frontiers in Psychology | www.frontiersin.org 8 May 2021 | Volume 12 | Article 627561
Küntzler et al.                                                                                                                   Comparison of FER Systems

                                                                                      < 0.001), humans outperform all algorithms in the detection of
                                                                                      anger (Azure: p < 0.001; FaceReader: p < 0.001, Face++: p <
                                                                                      0.001) and fear facial expressions (Azure: p < 0.001; FaceReader:
                                                                                      p < 0.001, Face++: p < 0.001). In contrast, Azure performs better
                                                                                      than humans regarding neutral, p < 0.001, and disgust faces, p <
                                                                                      0.001, while FaceReader (neutral: p < 0.001; disgust: p = 0.002)
                                                                                      and Face++ (neutral: p = 0.001; disgust: p = 0.023) show equal
                                                                                      or worse performance compared to humans. Finally, Azure, p
                                                                                      = 0.006, and Face++, p < 0.001, performs better than humans
                                                                                      in the detection of non-standardized surprise facial expressions
                                                                                      where FaceReader performs similar to humans, p = 0.535.
                                                                                         Taken together, for most emotion categories there is at least
                                                                                      one FER system that performs equally well or better compared to
                                                                                      humans. The only exceptions are non-standardized expressions
                                                                                      of fear and anger, where humans clearly outperform all FER
                                                                                      systems. FaceReader shows particularly good performance for
                                                                                      standardized facial expressions and Azure performs better on
                                                                                      non-standardized facial expressions.

                                                                                      4. DISCUSSION
                                                                                      In this paper, we evaluate and compare three widely used FER
                                                                                      systems, namely Azure, Face++ and FaceReader, and human
                                                                                      emotion recognition data. For the performance comparison, we
                                                                                      use two different kinds of emotional facial expression data sets:
                                                                                      First, a standardized data set comprised of lab generated images
                                                                                      displaying intense, prototypical facial expressions of emotions
                                                                                      under very good recording conditions (i.e., lighting, camera
                                                                                      angle). Second, we test a non-standardized set, which contains
 FIGURE 3 | Classification performance depicted as Receiver Operating                 facial expressions from movie scenes depicting emotional faces
 Characteristic (ROC) curves and corresponding Area under the Curve (AUC)             as an approximation for more naturalistic, spontaneous facial
 for overall emotion recognition performance for the three FER systems (Azure,        expressions (Dhall et al., 2018). The non-standardized facial
 Face++, and FaceReader) and human raters. Separately for (A) standardized
 facial expressions and (B) non-standardized facial expressions separately. The
                                                                                      expressions constitute an especially difficult test case, since it
 white diagonal line indicates classification performance by chance.                  contains large variation in the expressions itself, the surrounding
                                                                                      circumstances and the displayed person’s characteristics.
                                                                                         Overall, the three classifiers as well as humans perform
                                                                                      well on standardized facial expressions. However, we observe
fear faces (Azure: p = 0.003; FaceReader: p < 0.001, Face++:                          large variation and a general decrease in performance for the
p < 0.001), all algorithms perform significantly better than                          non-standardized data, in line with previous work (Yitzhak
humans for neutral (Azure: p < 0.001; FaceReader: p < 0.001,                          et al., 2017; Dupré et al., 2020). Although emotion recognition
Face++: p < 0.001), joy (Azure: p = 0.023; FaceReader: p =                            performance is generally lower for such facial expressions,
0.024, Face++: p = 0.027), and surprise expressions (Azure: p                         FER tools perform similarly or better than humans for most
= 0.012; FaceReader: p = 0.012, Face++: p = 0.013). Also, for                         emotion categories of non-standardized (except for anger and
standardized facial expressions of disgust, FaceReader, p = 0.002,                    fear) and standardized facial expressions. Facial expressions
and Face++, p = 0.023, perform better compared to humans                              of joy are detected best among the emotion categories in
while Azure is comparable to humans, p = 0.450. Regarding                             both standardized and non-standardized facial expressions,
anger, FaceReader, and humans perform comparably, p = 0.353,                          which also replicates existing findings (Stöckli et al., 2018;
and both outperform Azure and Face++, p < 0.001. Finally,                             Höfling et al., 2021). However, FER performance varies strongly
FaceReader shows better classification of sad faces compared to                       between systems and emotion categories. Depending on the
Azure, p = 0.078, Face++, p < 0.001, and humans, p = 0.021.                           data and on which emotions one aims at classifying, one
   For the non-standardized facial expressions (see Figure 3B),                       algorithm might be better suited than the other: Face++ shows
humans overall show similar performance to Azure, p = 0.058,                          almost no drop out in face detection even under the non-
and both perform better than FaceReader, p < 0.001, and                               standardized condition, FaceReader shows excellent performance
Face++, p < 0.001. While this pattern is the same for joy (Azure:                     for standardized prototypical facial expressions and outperforms
p = 0.554; FaceReader: p < 0.001, Face++: p < 0.001) and                              humans, and Azure shows superior overall performance on non-
sadness (Azure: p = 0.448; FaceReader: p < 0.001, Face++: p                           standardized facial expressions among all FER tools.

Frontiers in Psychology | www.frontiersin.org                                     9                                      May 2021 | Volume 12 | Article 627561
Küntzler et al. Comparison of FER Systems
4.1. Implications for Application disgust is among the lowest for all classifiers which corresponds
From our data, we can derive three broad implications. First, all to human recognition data in the present study. In line with
FER tools perform much better on the standardized, prototypical previous research, the pronounced performance drop for many
data, than on the non-standardized, more naturalistic data. This non-standardized images compared to standardized emotion
might indicate over fitting on standardized data. Second, FER categories (Yitzhak et al., 2017; Dupré et al., 2020) might indicate
systems and human coders can detect some emotion categories that the FER systems are not trained on detecting the full
better than others, resulting in asymmetries in classification variability of emotional facial expressions. Importantly, these
performance between emotion categories. This indicates results reflect that FER simulates human perception and also
that the detection of certain emotional facial expressions is shows similar classification errors.
generally more error prone than others. Third, we can identify Third, we make a series of observations, that specific FER
performance problems that are specific to FER tools. systems misclassify certain emotion categories, which is not
First, as expected, all FER systems perform better on shared by human coders. In our data, fear is also misclassified
the standardized compared to non-standardized and more as sadness by Azure in standardized and non-standardized facial
naturalistic facial expressions. This is the case for both face expressions. For the non-standardized data, we also report a
detection and emotion classification. Within the standardized general tendency to misclassify surprise expressions, that is not
data, face detection is near to prefect for all systems and shows evident in other studies. Especially the misclassification toward
almost no drop out based on face detection failures. Regarding surprise in the non-standardized data might be explained by
the emotion classification, FaceReader outperforms Face++, an open mouth due to speaking in movies, for which the
Azure, and even human coders. Within the non-standardized applications do not account. In addition, Face++ misclassifies
data, face detection is observed to be problematic for Azure and any emotion in the non-standardized data as fear and to a
FaceReader. Judging the classification performance on the non- lesser extend as sadness. Regarding FaceReader, we observe a
standardized data set, all three classifiers show a large overall pronounced misclassification of naturalistic facial expressions as
decrease in accuracy, whereby Azure is most accurate compared neutral. These findings indicate misclassification pattern specific
to Face++ and FaceReader. In particular, all FER systems, and less for the three investigated FER systems which possibly reflect
pronounced in humans, show a misclassification of emotional differences in their machine-learning architecture, training
facial expressions as neutral facial expressions for the non- material and validation procedure.
standardized data. This is an important observation not shown
by Dupré et al. (2020), since they have not reported confusions
with the neutral category. We suspect the neutral classification 4.2. Limitations and Outlook
due to the expressions in acted films being less intense compared This study has some limitations. Most obviously, we compare
to standardized, lab generated data. Hence, the vastly better three representative and not all available software systems on
performance on standardized, prototypical facial expressions the market. While we choose software that is widely used,
which were generated under controlled conditions may indicate other algorithms will need to be examined in a similar fashion.
limitations of FER systems to more naturalistic and more subtle For example, Beringer et al. (2019) find that FACET shows a
emotional facial expressions. certain resilience to changes in lighting and camera angle on lab
Second, we observe that FER and human performance reflect generated data. We could not see in this study if this resilience
varying underlying difficulties in the classification of different transfers to an even harder task.
emotions. In other words, certain emotions are harder to detect To approximate more naturalistic facial expressions, we
than others, for example because of more subtle expressions utilize images from movie stills as the non-standardized data
or less distinct patterns. This evolves from shared classification set. While this is convenient and emotional expressions are
error patterns between the three algorithms which corresponds already classified and evaluated, these images are of course also
to prior research on other algorithms and human recognition posed by actors. However, good acting is generally thought
performance. In our data, joy is recognized best and fear is of as a realistic portrayal of true affect. Our ratings of
among the most difficult to classify which is in line with prior genuineness appear to support our distinction of standardized
FER (Stöckli et al., 2018; Skiendziel et al., 2019; Dupré et al., and non-standardized facial expressions. In addition, our
2020) and human emotion recognition research (Nummenmaa human recognition data provide further validation of emotion
and Calvo, 2015; Calvo and Nummenmaa, 2016). Anger has been categorization of this particular facial expression inventory. Even
found to be difficult to classify in some studies (Stöckli et al., though acted portrays of emotional facial expressions differ
2018; Dupré et al., 2020), but not in others (Skiendziel et al., between prototypical inventories and movies, which is in line
2019). With regards to our findings, angry faces can be classified with previous research (Carroll and Russell, 1997), these acted
with low sensitivity, but high precision. Sadness and disgust are facial expressions are only approximations for true emotional
reported to be difficult to detect in other studies (Lewinski et al., expressions. Moreover, movie stimuli may be rated as more
2014; Skiendziel et al., 2019). Fear is regularly misclassified as authentic compared to the prototypical data, due to many reasons
surprise, as found in other studies with FER (Stöckli et al., 2018; like the variation in head orientations, lighting, backgrounds,
Skiendziel et al., 2019) and humans alike (Palermo and Coltheart, and familiarity with the actors or movie plot. Hence, facial
2004; Calvo and Lundqvist, 2008; Tottenham et al., 2009; Calvo expressions of true emotion require an additional criterion of
et al., 2018). For the non-standardized data, FER performance on emotional responding like ratings of currently elicited emotions.
Frontiers in Psychology | www.frontiersin.org 10 May 2021 | Volume 12 | Article 627561Küntzler et al. Comparison of FER Systems
Furthermore, we argue that FER would be most useful in from non-prototypical expressions in non-restrictive settings
categorizing spontaneous and naturalistic facial expressions in (e.g., strong head movement) carefully.
different contexts. The SFEW data set serves as an approximation
for this. However, it is unclear whether the displayed emotional DATA AVAILABILITY STATEMENT
facial expressions are grounded in emotional processing or just
simulated. For example, Höfling et al. (2020) elicited spontaneous The raw data supporting the conclusions of this article will be
emotional responses by presenting emotional scenes to their made available by the authors, without undue reservation.
participants and found FER detects changes in facial expressions
only for pleasant emotional material. Hence, more data sets ETHICS STATEMENT
are needed to test different naturalistic settings and foster
development in this area. Ethical review and approval was not required for the study on
Beyond the bias in FER toward prototypical expressions under human participants in accordance with the local legislation
good condition, there are other sources of systemic error that and institutional requirements. The patients/participants
we did not address, such as biases against race, gender, age, provided their written informed consent to participate in
or culture (Zou and Schiebinger, 2018; Aggarwal et al., 2019; this study.
Wellner and Rothman, 2020). For example, it has been shown
that automated facial analysis to classify gender works less well AUTHOR CONTRIBUTIONS
for people with a darker skin tone (Buolamwini and Gebru,
2018). Many training data sets are concentrated on Northern TK conceived and designed the study, contributed Face++ and
America and Europe (Shankar et al., 2017), which partially Azure data, conducted the analysis and interpretation of the
causes the biases and at the same time makes it difficult to results, and also drafted the work. TH contributed FaceReader
detect them. Future research should take these variables into data and collected data from human raters. TH and GA
account to evaluate measurement fairness independent of specific contributed to the interpretation of the results and writing of the
person characteristics. manuscript. All authors contributed to the article and approved
the submitted version.
5. CONCLUSION
FUNDING
This study contributes to the literature by comparing the
accuracy of three state-of-the-art FER systems to classify This publication was funded by the open access publication fund
emotional facial expressions (i.e., FaceReader, Azure, Face++). of the University of Konstanz.
We show that all systems and human coders perform well for
standardized, prototypical facial expressions. When challenged ACKNOWLEDGMENTS
with non-standardized images, used to approximate more
naturalistic expressions collected outside of the lab, performance We would like to express our gratitude to those, who commented
of all systems as well as human coders drops considerably. on earlier version of this paper, especially Susumu Shikano,
Reasons for this are substantial drop out rates and a decrease Karsten Donnay, Sandra Morgenstern, Kiela Crabtree, Sarah
in classification accuracy specific to FER systems and emotion Shugars, and the participants of the Image Processing for
categories. With only a short history, FER is already a Political Research workshop at APSA 2020. We also would like
valid research tool for intense and prototypical emotional to thank Timo Kienzler for technical support. We thank the
facial expressions. However, limitations are apparent in the two reviewers for their constructive suggestions, which further
detection of non-standardized facial expressions as they may improved the paper.
be displayed in more naturalistic scenarios. Hence, further
research is urgently needed to increase the potential of FER SUPPLEMENTARY MATERIAL
as a research tool for the classification of non-prototypical and
more subtle facial expressions. While the technology is, thus, a The Supplementary Material for this article can be found
promising candidate to assess emotional facial expressions on online at: https://www.frontiersin.org/articles/10.3389/fpsyg.
a non-contact basis, researchers are advised to interpret data 2021.627561/full#supplementary-material
REFERENCES Aggarwal, A., Lohia, P., Nagar, S., Dey, K., and Saha, D. (2019). “Black box fairness
testing of machine learning models,” in ESEC/FSE 2019: Proceedings of the
Abdullah, S., Murnane, E. L., Costa, J. M. R., and Choudhury, T. (2015). “Collective 2019 27th ACM Joint Meeting on European Software Engineering Conference
smile: measuring societal happiness from geolocated images,” in CSCW ’15: and Symposium on the Foundations of Software Engineering, Tallinn, Estonia.
Proceedings of the 18th ACM Conference on Computer Supported Cooperative 625–635. doi: 10.1145/3338906.3338937
Work & Social Computing, Tallinn, Estonia. 361–374. doi: 10.1145/2675133.26 Arriaga, O., Valdenegro-Toro, M., and Plöger, P. (2017). Real-time convolutional
75186 neural networks for emotion and gender classification. CoRR, abs/1710.07557.
Frontiers in Psychology | www.frontiersin.org 11 May 2021 | Volume 12 | Article 627561Küntzler et al. Comparison of FER Systems Barrett, L. F., Adolphs, R., Marsella, S., Martinez, A. M., and Pollak, S. Henry, L., and Wickham, H. (2020). purrr: Functional Programming Tools. R D. (2019). Emotional expressions reconsidered: challenges to inferring package version 0.3.4. emotion from human facial movements. Psychol. Sci. Publ. Interest 20, 1–68. Höfling, T. T. A., Alpers G. W., Gerdes, A. B. M., and Föhl, U. (2021). doi: 10.1177/1529100619832930 Automatic facial coding versus electromyography of mimicked, Bartkiene, E., Steibliene, V., Adomaitiene, V., Juodeikiene, G., Cernauskas, D., Lele, passive, and inhibited facial response to emotional faces. Cogn. Emot. V., et al. (2019). Factors affecting consumer food preferences: food taste and doi: 10.1080/02699931.2021.1902786 depression-based evoked emotional expressions with the use of face reading Höfling, T. T. A., Gerdes, A. B. M., Föhl, U., and Alpers, G. W. (2020). Read technology. BioMed Res. Int. 2019:2097415. doi: 10.1155/2019/2097415 my face: automatic facial coding versus psychophysiological indicators of Bartlett, M., Hager, J. C., Ekman, P., and Sejnowski, T. J. (1999). Measuring emotional valence and arousal. Front. Psychol. doi: 10.3389/fpsyg.2020.01388 facial expressions by computer image analysis. Psychophysiology 36, 253–263. Jin, B., Qu, Y., Zhang, L., and Gao, Z. (2020). Diagnosing Parkinson disease doi: 10.1017/S0048577299971664 through facial expression recognition: video analysis. J. Med. Intern. Res. Beringer, M., Spohn, F., Hildebrandt, A., Wacker, J., and Recio, G. (2019). 22:e18697. doi: 10.2196/18697 Reliability and validity of machine vision for the assessment of facial Keltner, D., and Cordaro, D. T. (2017). “Understanding multimodal emotional expressions. Cogn. Syst. Res. 56, 119–132. doi: 10.1016/j.cogsys.2019.03.009 expressions,” in The Science of Facial Expression, eds J. Russel and Boxell, L. (2018). Slanted Images: Measuring Nonverbal Media Bias. Munich J. Fernandez Dols (New York, NY:Oxford University Press), 57–76. Personal RePEc Archive Paper No. 89047. Munich: Ludwig Maximilian doi: 10.1093/acprof:oso/9780190613501.003.0004 University of Munich. Kuhn, M. (2020). caret: Classification and Regression Training. R package version Brader, T. (2005). Striking a responsive chord: how political ads motivate and 6.0-86. persuade voters by appealing to emotions. Am. J. Polit. Sci. 49, 388–405. Kulke, L., Feyerabend, D., and Schacht, A. (2020). A comparison of the affectiva doi: 10.1111/j.0092-5853.2005.00130.x imotions facial expression analysis software with EMG for identifying facial Buolamwini, J., and Gebru, T. (2018). Gender shades: intersectional accuracy expressions of emotion. Front. Psychol. 11:329. doi: 10.3389/fpsyg.2020.00329 disparities in commercial gender classification. Proc. Mach. Learn. Res. 81, 1–15. Langer, O., Dotsch, R., Bijlstra, G., Wigboldus, D. H. J., Hawk, S. T., and van Calvo, M., and Lundqvist, D. (2008). Facial expressions of emotion (kdef): Knippenberg, A. (2010). Presentation and validation of the radboud faces identification under different display-duration conditions. Behav. Res. Methods database. Cogn. Emot. 24, 1377–1388. doi: 10.1080/02699930903485076 40, 109–115. doi: 10.3758/BRM.40.1.109 Lerner, J. S., and Keltner, D. (2000). Beyondvvalence: Toward a model of Calvo, M. G., Fernández-Martín, A., Recio, G., and Lundqvist, D. (2018). emotion-specific influences on judgement and choice. Cogn. Emot. 14, 473–493. Human observers and automated assessment of dynamic emotional doi: 10.1080/026999300402763 facial expressions: Kdef-dyn database validation. Front. Psychol. 9:2052. Lewinski, P. (2015). Automated facial coding software outperforms people in doi: 10.3389/fpsyg.2018.02052 recognizing neutral faces as neutral from standardized datasets. Front. Psychol. Calvo, M. G., and Nummenmaa, L. (2016). Perceptual and affective mechanisms in 6:1386. doi: 10.3389/fpsyg.2015.01386 facial expression recognition: an integrative review. Cogn. Emot. 30, 1081–1106. Lewinski, P., den Uyl, T., and Butler, C. (2014). Automated facial coding: validation doi: 10.1080/02699931.2015.1049124 of basic emotions and facs aus in facereader. J. Neurosci. Psychol. Econ. 7, Carroll, J. M., and Russell, J. A. (1997). Facial expressions in hollywood’s portrayal 227–236. doi: 10.1037/npe0000028 of emotion. J. Pers. Soc. Psychol. 72, 164–176. doi: 10.1037/0022-3514.72.1.164 Lundqvist, D., Flykt, A., and Öhman, A. (1998). The Karolinska Directed Chang, W. (2014). extrafont: Tools for Using Fonts. R package version 0.17. Emotional Faces - KDEF. CD ROM from Department of Clinical Clore, G. L., Gasper, K., and Garvin, E. (2001). “Affect as information,” in Neuroscience, Psychology section, Karolinska Institutet. ISBN 91-630-7164-9. Handbook of Affect and Social Cognition, ed J. Forgas (Mahwah, New doi: 10.1037/t27732-000 Yersey:Psychology Press), 121–144. Marcus, G. E. (2000). Emotions in politics. Annu. Rev. Polit. Sci. Chicago. 3, Cohn, J. F., Ambadar, Z., and Ekman, P. (2007). “Observer-based measurement of 221–250. doi: 10.1146/annurev.polisci.3.1.221 facial expression with the facial action coding system,” in Handbook of Emotion Marcus, G. E., Neuman, W. R., and MacKuen, M. (2000). Affective Intelligence and Elicitation and Assessment, eds J. Coan and J. Allen (Oxford:Oxford University Political Judgement. The University of Chicago Press. Press), 222–238. Mavadati, M. S., Mahoor, M. H., Bartlett, K., Trinh, P., and Cohn, J. F. (2013). Disfa: Dhall, A., Goecke, R., Lucey, S., and Gedeon, T. (2012). Collecting large, richly A spontaneous facial action intensity database. IEEE Trans. Affect. Comput. 4, annotated facial-expression database from movies. IEEE MultiMed. 19, 34–41. 151–160. doi: 10.1109/T-AFFC.2013.4 doi: 10.1109/MMUL.2012.26 Meffert, M. F., Chung, S., Joiner, A. J., Waks, L., and Garst, J. (2006). The effects of Dhall, A., Kaur, A., Goecke, R., and Gedeon, T. (2018). “Emotiw 2018: audio-video, negativity and motivated information processing during a political campaign. student engagement and group-level affect prediction,” in ICMI’ 18 Boulder, J. Commun. 56, 27–51. doi: 10.1111/j.1460-2466.2006.00003.x CO, 653–656. doi: 10.1145/3242969.3264993 Neuwirth, E. (2014). RColorBrewer: ColorBrewer Palettes. Long Beach, CA:R Dowle, M., and Srinivasan, A. (2020). data.table: Extension of ’data.frame’. R package version 1.1-2. Package Version 1.13.2. Nummenmaa, L., and Calvo, M. G. (2015). Dissociation between recognition Dupré, D., Krumhuber, E. G., Küster, D., and McKeown, G. J. (2020). A and detection advantage for facial expressions: a meta-analysis. Emotion 15, performance comparison of eight commercially available automatic 243–256. doi: 10.1037/emo0000042 classifiers for facial affect recognition. PLoS ONE 15:e231968. Olszanowski, M., Pochwatko, G., Kuklinski, K., Scibor-Rylski, M., Lewinski, P., doi: 10.1371/journal.pone.0231968 and Ohme, R. (2015). Warsaw set of emotional facial expression pictures: Ekman, P., and Rosenberg, E. L. (1997). What the Face Reveals: Basic and Applied a validation study of facial display photographs. Front. Psychol. 5:1516. Studies of Spontaneous Expression Using the Facial Action Coding System doi: 10.3389/fpsyg.2014.01516 (FACS). New York, NY:Oxford University Press. Ooms, J. (2014). The jsonlite package: a practical and consistent mapping between Fraser, K., Ma, I., Teteris, E., Baxter, H., Wright, B., and McLaughlin, K. JSON data and R objects. arXIv [Preprint] arXiv:1403.2805 [stat.CO]. (2012). Emotion, cognitive load and learning outcomes during simulation Palermo, R., and Coltheart, M. (2004). Photographs of facial expression: accuracy, training. Med. Educ. 46, 1055–1026. doi: 10.1111/j.1365-2923.2012. response times, and ratings of intensity. Behav. Res. Methods Instrum. Comput. 04355.x 36, 634–638. doi: 10.3758/BF03206544 Goodfellow, I. J., Erhan, D., Carrier, P., Courville, A., Mirza, M., Hamner, Pedersen, T. (2020). patchwork: The Composer of Plots. R package version 1.1.0. B., et al. (2015). Challenges in representation learning: a report on three Peng, Y. (2018). Same candidates, different faces: uncovering media bias in visual machine learning contests. Neural Netw. 64, 59–63. doi: 10.1016/j.neunet.2014. portrayals of presidential candidates with computer vision. J. Commun. 65, 09.005 920–941. doi: 10.1093/joc/jqy041 Haim, M., and Jungblut, M. (2020). Politicians’ self-depiction and their news Pittig, A., Schulz, A. R., Craske, M. G., and Alpers, G. W. (2014). Acquisition portrayal: Evidence from 28 countries using visual computational analysis. of behavioral avoidance: task-irrelevant conditioned stimuli trigger costly Polit. Commun. doi: 10.1080/10584609.2020.1753869 decisions. J. Abnorm. Psychol. 123, 314–329. doi: 10.1037/a0036136 Frontiers in Psychology | www.frontiersin.org 12 May 2021 | Volume 12 | Article 627561
You can also read