Bacterial distribution on the ocular surface of patients with primary Sjögren's syndrome - Nature
←
→
Page content transcription
If your browser does not render page correctly, please read the page content below
www.nature.com/scientificreports
OPEN Bacterial distribution on the ocular
surface of patients with primary
Sjögren’s syndrome
Yong Chan Kim1,4, Baknoon Ham2,4, Kui Dong Kang1, Jun Myeong Yun1, Man Jae Kwon2,
Hyun Seung Kim3 & Hyung Bin Hwang1*
Many studies have shown that gut microbial dysbiosis is a major factor in the etiology of autoimmune
diseases but none have suggested that the ocular surface (OS) microbiome is associated with Sjögren’s
syndrome (SS). In this prospective study, we analyzed bacterial distribution on the OS in patients
with primary SS. Among the 120 subjects included in this study, 48 patients (group A) had primary
SS, whereas 72 subjects (group B) had dry eye symptoms that were unrelated to SS. We evaluated
clinical dry eye parameters such as the OS disease index, ocular staining score (OSS), Schirmer’s I test,
and tear break-up time (TBUT). Conjunctival swabs were used to analyze the microbial communities
from the two groups. Bacterial 16S rRNA genes were sequenced using the Illumina MiSeq platform,
and the data were analyzed using the QIIME 1.9.1 program. The Shannon index was significantly
lower in group A than in group B microbiota (p < 0.05). An analysis of similarity using the Bray–
Curtis distance method found no difference in beta-diversity between the two groups (p > 0.05). In
group A, Actinobacteria at the phylum level and Corynebacteria at the genus level exhibited low
abundance than group B, but the differences were not statistically significant (p > 0.05). SS apparently
decreases the diversity of the OS microbial community. These observations may be related to the
pathophysiology of SS and should be investigated in future studies.
Sjögren’s syndrome (SS) is an autoimmune disease that is characterized by lymphocytic infiltration of exocrine
glands such as salivary and lacrimal glands, resulting in dry eye disease and dry m outh1. Patients with SS and
dry eyes exhibit particular glandular and mucosal immunopathological changes. C D4+ T cells and dendritic cells
infiltrate conjunctival tissue, and inflammatory cytokines such as interferon gamma and interleukin (IL)-17,
secreted from these T cells, induce apoptosis of epithelial and goblet cells, exacerbating dryness of the ocular
surface (OS)2,3. In addition, C D8+ T cells are known to play an important role in the pathophysiology of SS,
such as salivary gland d amage4. Therefore, SS changes the immunological characteristics of the corneal and
conjunctival surfaces.
Commensal microorganisms are present on the uninfected human OS, and several studies have used tradi-
tional microbiological culture techniques to study the microbiota of the O S5–7. Furthermore, deep sequencing of
bacterial DNA has shown that various species of commensal microorganisms are present on the OS8.
However, it is unclear whether the species distribution of commensal microorganisms on the OS is altered
in patients with SS. Unusual microbial flora distribution patterns are associated with some immunological
diseases, and normalizing these distribution patterns is one approach to treatment. Crohn’s disease is a chronic
inflammatory disorder of the gastrointestinal tract that results from an excessive innate and adaptive immune
response to environmental factors in genetically susceptible s ubjects9. Crohn’s disease suppresses the function
of regulatory T cells, which play an important role in immunological homeostasis10. Importantly, bacterial dys-
biosis may be an important pathological consequence of Crohn’s disease, and restoring the microbial balance
is one method of treating the d isease11,12. In fact, patients with Crohn’s disease have more pathogenic bacterial
species and fewer normal commensal bacterial s pecies13. Zaheer et al. attempted to demonstrate an association
between gut dysbiosis and SS in a CD25 knockout mouse model. The study revealed that lack of commensal
gut bacteria aggravated dacryoadenitis and generated autoreactive C D4+ T cells, increasing pathogenicity in the
1
Department of Ophthalmology, Incheon St. Mary’s Hospital, College of Medicine, The Catholic University of
Korea, #56 Dongsu‑ro, Incheon 21431, Republic of Korea. 2Department of Earth and Environmental Sciences,
Korea University, Seoul, Republic of Korea. 3Department of Ophthalmology, Seoul St. Mary’s Hospital, College
of Medicine, The Catholic University of Korea, Seoul, Republic of Korea. 4These authors contributed equally: Yong
Chan Kim and Baknoon Ham. *email: leoanzel@catholic.ac.kr
Scientific Reports | (2022) 12:1715 | https://doi.org/10.1038/s41598-022-05625-w 1
Vol.:(0123456789)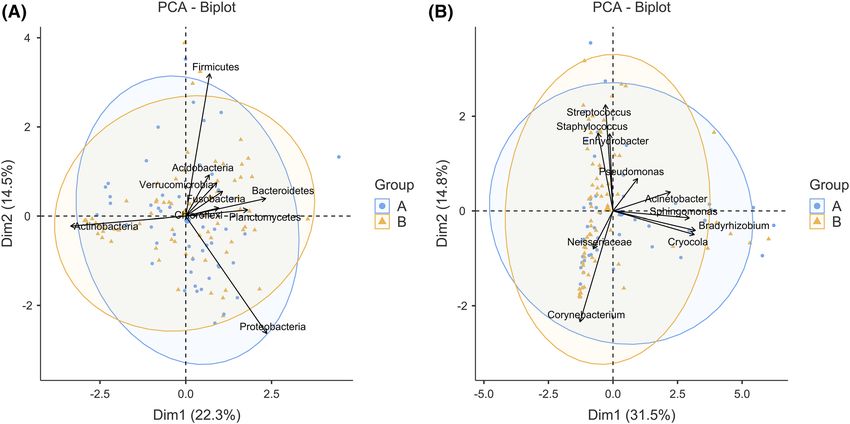
www.nature.com/scientificreports/
Age (years) OSDI TBUT (sec) Schirmer value (mm) OSS
Group A (M:F = 11:37)) 51.71 ± 9.46 36.53 ± 25.24 4.90 ± 2.04 7.88 ± 7.67 3.10 ± 1.88
Group B (M:F = 4:68) 54.50 ± 13.60 41.94 ± 24.48 4.92 ± 1.77 8.43 ± 8.08 3.40 ± 2.02
p value 0.235 0.244 0.953 0.707 0.417
Table 1. Ages and dry eye clinical parameters of the two groups. Independent t-test. OSDI Ocular Surface
Disease Index, TBUT tear break up time, OSS ocular staining score.
Figure 1. Rarefaction plots of observed species (A) and phylogenetic diversity of the whole tree (B).
knockout mice. Therefore, in this SS mouse model, the commensal gut bacteria and their metabolites may have
an immunoregulatory function that protects the exocrine g lands14.
However, it is difficult to establish a clear link between gut dysbiosis and pathology of the OS in patients with
SS. Therefore, it is necessary to study the OS microbiota. Unfortunately, as Zaheer et al. reported, OS microbiota
are sparse and difficult to analyze. Therefore, we used next-generation sequencing (NGS) to analyze numerous
microbial populations distributed across the OS, similar to a previous study15. Here, we assess the composition of
the OS microbial communities and evaluate the significance of the diversity and abundance of bacterial strains.
Results
Basic characteristics and dry eye parameters. Of the 120 subjects included in this study, 48 subjects
(group A) were diagnosed with SS according to American College of Rheumatology/European League Against
Rheumatism diagnostic criteria; the remaining 72 subjects (group B) did not have SS. Basic characteristics of all
subjects are described in Table 1. In both groups, there were more females than males. Kolmogorov–Smirnov
tests were used to confirm that the data were normally distributed (p > 0.05). The mean ages of groups A and
B were 51.71 ± 9.46 years and 54.50 ± 13.60 years, respectively, and these ages were not significantly different
(independent t-test, p > 0.05). There were no significant differences between the two groups in terms of clini-
cal parameters for dry eyes such as ocular staining score (OSS), OS disease index (OSDI), tear break-up time
(TBUT), and Schirmer’s test (independent t-tests, all p > 0.05).
Sequencing data. The 16S rRNA V4 amplicon libraries were sequenced from 120 individual samples. We
obtained a total of 1,890,438 high-quality reads, and the number of observations (distinct operational taxonomic
units [OTUs]) was 10,668. There was a mean ± standard deviation (SD) of 15,753.7 ± 6354.1 sequences per sam-
ple, with a median of 15,928 reads (range, 5001 to 37,333). Additionally, all the raw reads were classified using a
naïve Bayesian ribosomal database project classifier for taxonomic assignment at 97% similarity. The mean (with
SD) number of OTUs was 412.27 ± 160.87, the minimum number of OTUs was 117, and the maximum number
of OTUs was 1013 (Supplementary Table 1).
We constructed rarefaction curves to check the sequencing depth16 and confirmed that these samples were
sequenced deeply enough when viewed as plots of observed species (Fig. 1A) and phylogenetic diversity (PD)
of the whole tree (Fig. 1B).
Alpha diversity of the microbial community. There were no statistically significant differences in
OTUs between the two groups (p = 0.470, Fig. 2A). However, the PD of the whole tree was significantly differ-
ent in each group (p = 0.016, Fig. 2B). In addition, we used Student’s t-tests to analyze the alpha diversity of the
OS microbiome in each group. The Chao1 index showed that the species richness between the two groups was
Scientific Reports | (2022) 12:1715 | https://doi.org/10.1038/s41598-022-05625-w 2
Vol:.(1234567890)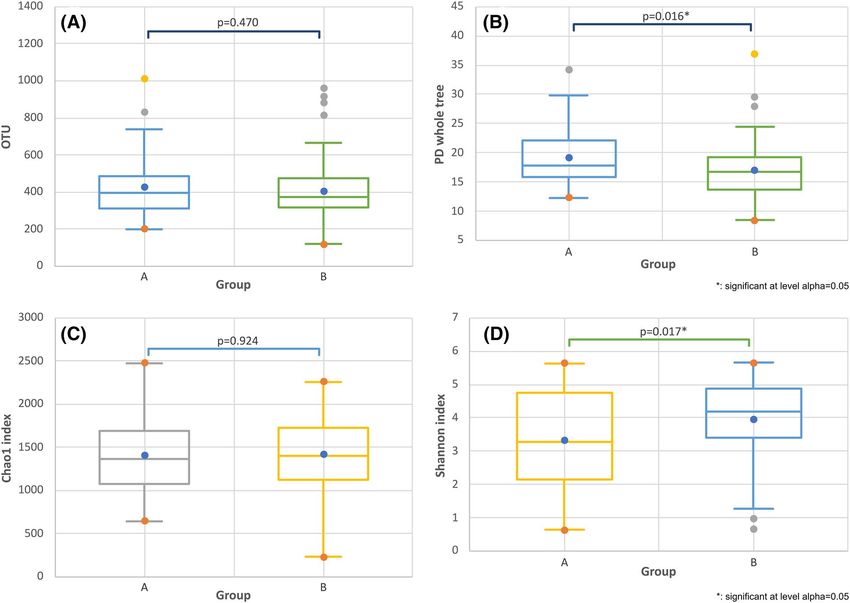
www.nature.com/scientificreports/

                                  Figure 2.  Box plots comparing the two groups in terms of OTUs (A), PD of the whole tree (B), Chao1 index
                                  (C), and Shannon index (D). OTU operational taxonomic unit, PD phylogenetic diversity. *Significant at alpha
                                  level of 0.05.

                                  not significantly different (p = 0.924, Fig. 2C). However, the Shannon index showed that there was less diversity
                                  among bacterial species in group A than in group B (p = 0.017, Fig. 2D).
                                      In addition, we analyzed the alpha diversity of the two groups in terms of controlling variables such as age,
                                  gender, and dry eye severity markers (i.e., Schirmer’s test, OSS, TBUT, and OSDI) using a general linear model
                                  (GLM). First, we confirmed that the data were normally distributed using the Q–Q plotting method. Therefore,
                                  the GLM was used to compare OTUs, PD of the whole tree, the Chao1 index, and the Shannon index in the
                                  state that all parameters such as age and dry eye parameters are entered as variables. The OTU (p = 0.158) and
                                  Chao1 index (p = 0.686) were not significantly different. However, for groups A and B, the PD of the whole tree
                                  (p = 0.002) and the Shannon index (p = 0.001) were significantly different.

                                  Taxonomic composition and dominant genera and phyla. 16S rRNA gene sequences were classified
                                  by phyla and genera to analyze the taxonomic composition of the microbial community. When the swab samples
                                  were analyzed, 32 bacterial phyla were detected and these were grouped into 14 major phyla. The most abundant
                                  four bacteria (> 1%) were listed for groups A and B. The Proteobacteria were most abundant in both groups
                                  (means with SD, 38.19% ± 24.72 and 34.24% ± 21.66, respectively), followed by the Actinobacteria (32.81% ± 23.06
                                  and 37.43% ± 29.04, respectively), the Firmicutes (16.56% ± 18.26 and 15.70% ± 18.28, respectively), and the Bac-
                                  teroidetes (5.39% ± 5.44 and 5.31% ± 5.87, respectively; Fig. 3A). However, there were no statistically significant
                                  differences in the relative abundance of these strains between the two groups (Student’s t-test, p > 0.05).
                                      A total of 698 bacterial genera were detected and these were grouped into 15 major genera. The most abundant
                                  14 bacteria (> 1%) were listed for groups A and B. The Corynebacteria were most abundant in both groups (means
                                  with SD, 24.54% ± 25.34 and 30.07% ± 31.91, respectively), followed by the Neisseriaceae (14.19% ± 24.67 and
                                  10.77% ± 20.76, respectively), the Staphylococci (10.91% ± 16.22 and 8.07% ± 16.86, respectively), the Streptococci
                                  (1.87% ± 4.29 and 3.21% ± 5.18, respectively), the Acinetobacter (3.27% ± 5.37 and 1.81% ± 2.70, respectively), the
                                  Cryocola (2.72% ± 4.73 and 1.54% ± 4.64, respectively), the Xanthomonads (0.35% ± 0.62 and 2.46% ± 6.63, respec-
                                  tively), the Bradyrhizobia (2.17% ± 4.02 and 0.95% ± 2.95, respectively), the Sphingomonads (1.60% ± 2.72 and
                                  1.25% ± 2.22, respectively), the Pseudomonads (0.98% ± 2.13 and 1.33% ± 5.05, respectively), the Enhydrobacter
                                  (0.98% ± 2.38 and 1.17% ± 1.95, respectively), the Commamonads (1.94% ± 3.78 and 0.43% ± 1.10, respectively),
                                  and the Erythrobacter (1.46% ± 3.11 and 0.65% ± 1.19, respectively; Fig. 3B). The Acinetobacter were more abun-
                                  dant in group A (Student’s t-test was borderline significant, p = 0.05), and the Xanthomonads were significantly
                                  more abundant in group B (Student’s t-test, p = 0.03).

Scientific Reports |   (2022) 12:1715 |                https://doi.org/10.1038/s41598-022-05625-w                                                  3

                                                                                                                                              Vol.:(0123456789)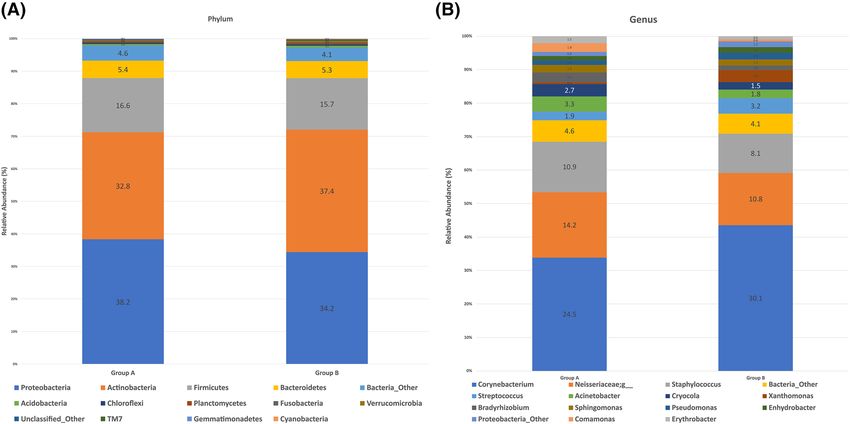
www.nature.com/scientificreports/

                                            Figure 3.  Core microbiome and taxonomic relative abundance of the two groups according to phyla (A) and
                                            genera (B).

                                            Figure 4.  Principle component analysis (PCA) bi-plot showing the beta-diversity of the two groups according
                                            to phyla (A) and genera (B). The numbers on the graphs are the sample IDs of enrolled subjects. PCA principle
                                            component analysis; dim dimension. The two ellipses in each graph represent the 95% confidence ellipse.

                                            Microbial communities on the OS. Figure 4 shows a principle component analysis (PCA) bi-plot graph
                                            of microbial communities at the phylum (Fig. 4A) and genus (Fig. 4B) levels. At both levels, the microbial com-
                                            munities in each group were different but not significantly so. An analysis of similarity (ANOSIM) using the
                                            Bray–Curtis method and 9999 permutations found that the microbial communities were not significantly sepa-
                                            rated at the phylum (p = 0.673) or genus (p = 0.637) level.

          Scientific Reports |   (2022) 12:1715 |               https://doi.org/10.1038/s41598-022-05625-w                                                  4

Vol:.(1234567890)
www.nature.com/scientificreports/
Discussion
Physiological interactions between the gut microbiota and immune system occur during human development17,
and gut dysbiosis plays an important role in the pathophysiology of autoimmune diseases such as systemic
sclerosis, rheumatoid arthritis, ankylosing spondylitis, and SS18. These autoimmune diseases are often associ-
ated with ophthalmic disorders such as uveitis and keratoconjunctivitis s icca19–21. Keratoconjunctivitis sicca is
caused by inflammatory cell infiltration of the lacrimal glands and occurs frequently in patients with SS. Many
studies have investigated the association between gut dysbiosis and OS lesions20,22. Moon et al. reported that
the gut microbiome of patients with SS differed from that of control s ubjects22, and Paiva et al. showed that the
severity of SS was inversely correlated with microbial d iversity20. However, the pathological manifestations of
keratoconjunctivitis sicca occur on the OS, and there are fewer microbes on the OS than in the gut. The cornea
and conjunctival mucosa are directly exposed to the environment. However, due to defense mechanisms such
as antimicrobial proteins in the tears, the protective corneal epithelium, and the presence of various immune
cells, few microorganisms flourish on the OS of the uninfected eye23–25. Consequently, few studies have ana-
lyzed microbial communities on the OS of patients with autoimmune diseases such as SS. Pavia et al. devised
a desiccated-stress SS animal model that exhibited significant differences in the microbiota found in the oral
mucosa compared with the gut. However, no meaningful differences were observed in conjunctival swab samples
because few microbes were present on the O S20. Therefore, as demonstrated by our previous r esearch15, NGS
may be required to analyze these microbiomes.
After controlling for age and dry eye clinical markers using the OSS, TBUT, and Schirmer’s test, we analyzed
microbial diversity on the OS of patients with SS (group A) and subjects who did not have SS (group B). The
Shannon index was significantly lower in the patients with SS. The Shannon index evaluates microbial diversity
by describing the entropy of an ecosystem or in representative samples. Therefore, patients with SS exhibited
a decrease in microbial diversity on the OS. In the animal model studied by Pavia et al., the severity of ocular
and systemic SS was inversely correlated with gut microbial d iversity20. Furthermore, Moon et al. found differ-
ences in gut microbial diversity between patients with SS and control s ubjects22. In addition, studies of the OS
microbiota in subjects with dry eyes, contact lens wearers, and patients with blepharitis or trachoma identified
characteristic differences in the abundance of some microbial s pecies26–29. Our study is the first to analyze micro-
bial communities on the OS of patients with and subjects without an autoimmune disease. In addition, we tried
to exclude subjects who had systemic or ocular diseases, as well as those who had taken systemic agents (e.g.,
hydroxychloroquine) and topical drugs that could affect the OS microbiota. Finally, we focused on differences
in the microbiota that were caused by SS by controlling for age and clinical markers for dry eyes.
We found that the alpha diversity of the microbial community decreased in OS of patients with primary SS.
Previous studies reported the presence of a gut–eye lacrimal-gland microbiome axis in patients with SS and that
commensal bacteria were involved in protecting the OS and lacrimal glands20,30. However, we suggest that protec-
tion of the OS may be compromised if the homeostasis of commensal bacteria is disrupted. Previous studies have
shown that both Gram-positive and Gram-negative bacteria use quorum sensing to regulate biofilm formation,
expression of virulence factors, and m otility31. Quorum sensing is based on the density of bacterial populations
32
within a particular e nvironment . Therefore, if the homeostasis of commensal bacterial on the OS is disrupted
and bacterial diversity decreases, pathogenicity may occur.
In addition, we analyzed species abundance. At the phylum level, Proteobacteria and Actinobacteria were
the predominant microorganisms on the OS, regardless of group. This observation is consistent with previous
research8,15,33,34. By contrast, Firmicutes are generally the predominant microorganisms present in the gut. Moon
et al. reported that Firmicutes were the predominant microorganisms in the gut of patients with SS22. At the
genus level, Corynebacteria were the predominant microorganisms on the OS. This observation is consistent
with previous research. These results suggest that a core community of commensal bacteria are present on the
OS and that the species abundance of OS bacteria differs from that of gut bacteria.
Although no statistical significance was found, the clinical meaning of changes in the species abundance of
Proteobacteria and Actinobacteria in the OS of primary SS patients can be found in the following studies. Previous
studies have suggested that increased prevalence of Proteobacteria is a marker for an unstable microbial commu-
nity and may be associated with several inflammatory metabolic disorders35,36. On the other hand, Actinobacteria
play important roles in regulating gut permeability, the immune system, metabolism, and the gut–brain a xis37.
Actinobacteria can stimulate the production of IL-4 and IL-13, thereby reducing inflammation38. In addition,
Actinobacteria prevent the formation of biofilm and the growth of pathogenic bacteria39. The findings related
to the OS microbial community of these two phylum may be related to the pathophysiology of the primary SS,
and it is thought that additional studies are needed to find a clearer significance. Interestingly, as in our previous
study on diabetic patients, genera related to the Acinetobacter were abundant on the OS of patients with SS15.
Acinetobacter strains are frequently associated with nosocomial infections, especially in intensive care units, and
particular species are reportedly associated with urinary tract infections, burn infections, and hospital acquired
pneumonia40. Acinetobacter colonies on the skin are associated with allergic r eactions41. In view of these features,
the presence of Acinetobacter strains on the OS of patients with primary SS, which is an autoimmune disease,
may be important. However, the abundance of Acinetobacter was low compared to other genera. Although not
statistically significant, we found that the abundance of Corynebacteria was lower on the OS of patients with SS.
Interestingly, Corynebacterium mastitidis, which is frequently found on the OS, plays an important role in the
local immune response of the corneal and conjunctival mucosa. St Leger et al. found that this organism elicited
a commensal-specific IL-17 response from γδ T cells in the ocular mucosa and drove neutrophil recruitment
and the release of antimicrobial agents into the tears. In addition, this Corynebacteria species was able to protect
the OS from infection by pathogenic Candida albicans and Pseudomonas aeruginosa42. Further research will be
Scientific Reports | (2022) 12:1715 | https://doi.org/10.1038/s41598-022-05625-w 5
Vol.:(0123456789)www.nature.com/scientificreports/
needed to understand how these observations may be linked and whether ocular commensal bacteria can train
cells involved in the immune response to resist pathogens.
Our study had some limitations, and our results should be interpreted with caution due to the limited sam-
ple size and the paucity of bacteria present on the OS. Although differences in the bacterial populations were
observed in the PCA bi-plots at the phylum and genus levels, significant differences in the Bray–Curtis distances
were not found. In addition, there are practical limitations inherent to analysis of bacterial species on the OS
using DNA sequencing. However, we were able to exclude the possibility of contamination of our sterile cotton
swab samples with bacterial DNA. In addition, the proportions of microorganisms that we identified on the OS
were similar to those described by previous studies. Although 16S rRNA sequencing with sparse bacteria from the
OS may generate some false positive reads and sequencing errors, NGS has many advantages over conventional
culture methods34,43. This is the first study to investigate the microbiota of the OS in patients with SS using NGS,
while controlling for dry eye clinical markers.
In conclusion, SS decreases the diversity of the microbial community on the OS of patients and affects the
abundance of particular bacterial strains at the phylum and genus levels. It is unclear whether these changes
result from or cause immunological disorders, but these possibilities may be investigated in future studies to
understand more fully the pathophysiology of SS.
Materials and methods
Study design and subjects. This prospective case–control study was conducted in accordance with the
Declaration of Helsinki, and the study protocol was approved by the Institutional Review Board of Incheon St.
Mary’s Hospital (assignment no. OC15SISI0010). In addition, written informed consent was obtained from all
participants. Patients were recruited at the Cornea Service of Incheon St. Mary’s Hospital. Patients who wore
contact lenses or had any of the following conditions or treatments that could affect eye dryness were excluded:
meibomian gland dysfunction above grade 244, allergic conjunctivitis, ocular surgery within the last 6 months,
punctal plug insertion, or topical treatments other than artificial tears in the 3 months before this study. Patients
who were taking medication for a systemic disease such as autoimmune diseases, diabetes, hypertension, thyroid
disease, allergic disease, or a depressive disorder were excluded.
G* power software (latest ver. 3.1.9.7; Heinrich-Heine-Universität Düsseldorf, Düsseldorf, Germany) was
used to calculate the number of study subjects. Effect size was set to 0.5, alpha error was 0.05, and power (1-beta
error) was set to 0.80. Since the number of SS patients was expected to be smaller than that of the control group,
the allocation ratio was set to 1.5. According to this calculation result, at least 42 SS patients and at least 64 sub-
jects as control had to be recruited. A total of 120 subjects were included in this study. In total, 15 subjects were
male and 105 subjects were female. All of the study subjects had been referred to ophthalmology departments
to investigate a diagnosis of primary SS and reported having dry eyes (e.g., dryness, itching, or the sensation of
a foreign body) and a dry mouth (e.g., frequent thirst, dry feeling in the mouth and throat, burning or tingling
sensation in the mouth and tongue, or cracked lips). All subjects had symptoms for ≥ 3 months, low TBUT (≤ 7
s), and low Schirmer I test without anesthesia value (< 10 mm/5 min). We used Sjögren’s International Collabo-
rative Clinical Alliance (SICCA) classification criteria announced in 2012 to diagnose S S45. In total, 48 patients
(group A) were diagnosed with primary SS and the remaining 72 subjects (group B) were classified as having
dry eyes and dry mouth symptoms that were unrelated to SS. Patients who had at least two of the following
three characteristics were diagnosed as having primary SS: positive serum anti-SSA/Ro and/or anti-SSB/La or
[positive rheumatoid factor and antinuclear antibodies titer ≥ 1:320], labial salivary gland biopsy exhibiting focal
lymphocytic sialadenitis with a focus score ≥ focus/4 m m2, and keratoconjunctivitis sicca with OSS ≥ 3.
Assessment of dry eye clinical parameters. OSS that included corneal and conjunctival staining scores,
Schirmer’s test, and TBUT were evaluated by the same ophthalmologist (HBH). Dry eye symptoms were graded
numerically from 0 to 4 using the OSDI, and the sum of these scores was used in the analyses. The OSDI, devel-
oped by the Outcomes Research Group at Allergan (Irvine, CA, USA), is a 12-item questionnaire that assesses
vision-related functioning. Each item is scored on a 5-point scale, resulting in a total OSDI score ranging from
0 (no symptoms) to 100 (maximal symptoms)46. To measure TBUT, fluorescein was instilled from a fluorescein
strip in a drop of saline (Haag-Streit, Koeniz, Switzerland). The fluorescein was applied to the superior-temporal
bulbar conjunctiva with participants instructed to gaze infero-nasally, and the TBUT was measured using a slit-
lamp under a cobalt blue light47. The mean value of three TBUT measurements was used in this study. The OSS
was measured in accordance with the SICCA registry ocular examination p rotocol48. Corneal punctate epithelial
erosions (PEEs) were evaluated and scored after staining with a fluorescent dye. Corneal scores were assigned as
follows: PEEs absent = 0 points; one to five PEEs = 1 point; six to 30 PEEs = 2 points; and more than 30 PEEs = 3
points. An additional point was assigned if more than one patch of confluent aggregated staining was found in
the pupillary area or if filaments present on the cornea were stained. The maximum possible score for each cor-
nea was 6 points. To assess conjunctival staining scores, fluorescein was washed out with non-preserved saline
solution, after which 1% lissamine green dye (Leiter’s Pharmacy, San Jose, CA, USA) was applied to the inferior
conjunctival fornix. After several blinks, conjunctival staining scores in the temporal and nasal bulbar conjunc-
tiva were evaluated separately as follows: up to nine dots = 0 points; 10 to 32 dots = 1 point; 33 to 100 dots = 2
points; and more than 100 dots = 3 points. The maximum possible score for the conjunctiva (i.e., temporal and
nasal regions) was 6 points. For Schirmer’s test, standard Schirmer strips (Eagle Vision, Memphis, TN, USA)
were placed in the lateral one-third of the lower eyelid, without topical anesthesia. After 5 min, the length of the
wet portion of the strip was measured.
Scientific Reports | (2022) 12:1715 | https://doi.org/10.1038/s41598-022-05625-w 6
Vol:.(1234567890)www.nature.com/scientificreports/
Sample collection and DNA extractions. The sampling and DNA extraction procedures used in this
study were the same as those used in our previous research15. In the absence of topical anesthesia, sterile dry
cotton swabs (MEDIUS Corp., Tokyo, Japan) were used to sample four different locations: left upper bulbar
conjunctiva, left lower bulbar conjunctiva, right upper bulbar conjunctiva, and the right lower bulbar conjunc-
tiva. Since the bacterial burden of OS is relatively low, in order to obtain as much burden as possible, samples
were collected after swabbing four conjunctival spaces by maximizing the contact surface using one sterile cot-
ton swab per subject. Each cotton swab was placed into a 1.5 mL sterilized Eppendorf microtube and frozen at
– 70 °C until DNA extraction. Nucleic acids were extracted from the swabs using an i-genomic Soil DNA Extrac-
tion Mini Kit (iNtRON, Seoul, South Korea) with a bead-beating apparatus, in accordance with the manufactur-
er’s instructions with the following method alterations. To enhance cell lysis, approximately 1.5 × lysis buffer was
added to the samples for 30 min. DNA concentrations were measured using a Qubit fluorometer (Invitrogen,
Gaithersburg, MD, USA).
16S rRNA gene library preparation. The hypervariable region 4 (V4) of the 16S rRNA gene was ampli-
fied from the extracted DNA using the 515F (5ʹ–GTGYCAGCMGCCGCGGTAA–3ʹ) and 806R (5ʹ–GGACTA
CNVGGGTWTCTAAT–3ʹ) primers49. The polymerase chain reaction (PCR) conditions were 94 °C for 3 min,
followed by 35 cycles of 94 °C for 45 s, 50 °C for 60 s, and 72 °C for 90 s, followed by a final extension step at 72 °C
for 10 min. Each sample was amplified in three replicate 25-µL PCR reactions, purified using the UltraClean PCR
clean-up kit (Mo Bio Laboratories, Solana Beach, CA, USA), and combined into a single tube. Purified DNA was
quantified by incorporating Picogreen (Invitrogen), in accordance with the manufacturer’s instructions.
Sequencing data analyses. Libraries for the V4 region alone were generated, and 16S rRNA-based MiSeq
sequencing was conducted using standard Earth Microbiome Project protocols (http://www.earthmicrobiome.
org/emp-standardprotocols/) at the Argonne National Laboratory (Lemont, IL, USA). QIIME version 1.9.1 was
used for processing all sequencing reads50. Sequences were de-multiplexed according to their barcodes, merged,
and quality-filtered using the default parameters. OTUs were clustered using the latest Greengenes 13_8 refer-
ence sequences at 97% similarity (approximately corresponding to species-level OTUs), using the UCLUST algo-
rithm. To remove chimera sequences, UCHIME within USEARCH was used51. Then, sequences were aligned
using PyNAST software (version 1.2, Boulder, USA)52. Representative OTU sequences were evaluated taxo-
nomically using the ribosomal database project c lassifier53, retrained on the Greengenes database (13_8)54, and
mitochondrial sequences were filtered out of the OTU table. OTU reads found in negative control samples were
removed from the OTU table.
Unlike the gut microbiome, the OS microbiome does not have much burden, so the difference in sequencing
depth between samples is relatively large. Therefore, we transformed our data to proportions by dividing the
reads for each OTU in a sample by the total number of reads in that sample for normalizing data. This method
is known as total sum normalization (TSS) m ethod55. To calculate species diversity and richness, alpha diversity
analyses using the Shannon and Chao1 indexes were processed using the QIIME script. To measure the similarity
among communities, beta diversity was calculated and PCA bi-plots were constructed.
Negative controls. All experimental procedures including sampling, DNA extraction, preparation, and
sequencing were implemented in a consistent manner. DNA extraction and PCR amplification of samples from
eyes and unused sterile cotton swabs were all performed using exactly the same procedures. When DNA was
extracted from the unused sterile cotton swabs, the quantity of DNA produced was very low (i.e., less than
0.05 ng DNA µL−1), and no DNA was amplified by the bacteria-specific primers (i.e., 27F and 1494R did not
generate a PCR band). To minimize variability from any batch effects during different sequencing runs, all sam-
ples were sequenced using the same sequencing run. Negative controls were generated in reaction mixtures con-
taining no template. During the sequence data analyses, OTU reads identified in DNA extractions of negative
controls were removed from the sequencing data using metadata-based filtering.
Diagnostic testing procedure. The testing procedure for ophthalmic examinations was as follows:
1. Subjective interview regarding symptoms of dry eyes (i.e., OSDI) and recording the patient’s medical history
(HBH and KDK).
2. Slit-lamp evaluation of the cornea, conjunctiva, eyelids, and Meibomian glands (HBH).
3. Schirmer’s test (without topical anesthesia; HBH).
4. TBUT test using fluorescein dye, repeated 3 times (HBH).
5. Fluorescein and lissamine green staining of the cornea and conjunctiva (HBH).
Thereafter, subjects returned after 2 weeks and were classified into two groups according to whether the
rheumatologist confirmed a diagnosis of SS.
6. Conjunctival swab sampling (HBH, KDK and JMY).
7. DNA extraction and sequencing analysis (BN).
Statistical analyses. All data are expressed as means ± SD. Statistical analyses were performed using
JAMOVI software (version 1.6; retrieved from http://www.jamovi.org) and XLSTAT statistical software (version
2021.3.01; Addinsoft SARL, Paris, France, http://www.xlstat.com/en/company/). Group differences in age and
Scientific Reports | (2022) 12:1715 | https://doi.org/10.1038/s41598-022-05625-w 7
Vol.:(0123456789)www.nature.com/scientificreports/
dry eye parameters were evaluated using Student’s t-test after confirming that the data were normally distributed
using the Kolmogorov–Smirnov test (p > 0.05). Group differences in alpha diversity (i.e., Shannon and Chao1
indexes) were analyzed using a GLM by controlling for age and dry eye parameters as covariates. Before per-
forming GLM and PCA, we checked the linearity of the plot using the Q-Q plotting method and checked the
normal distribution of the data in advance. PCA bi-plot was used to create a visual representation of the data,
with enrolled subjects and the various microbial strains arranged into two groups. To compare the microbial
communities associated with the two groups, an ANOSIM was performed using Bray–Curtis dissimilarities after
9999 permutations and the “vegan” package in ANOSIM. We used Student’s t-test to compare species richness
between the groups. A p-value < 0.05 was considered statistically significant.
Data availability
We declare that all experimental data are described accurately in this manuscript. For further information, please
contact the corresponding author.
Received: 13 May 2021; Accepted: 11 January 2022
References
1. Argyropoulou, O. D. et al. One year in review 2018: Sjogren’s syndrome. Clin. Exp. Rheumatol. 36(Suppl 112), 14–26 (2018).
2. De Paiva, C. S. et al. Dry eye-induced conjunctival epithelial squamous metaplasia is modulated by interferon-gamma. Invest.
Ophthalmol. Vis. Sci. 48, 2553–2560. https://doi.org/10.1167/iovs.07-0069 (2007).
3. Zhang, X. et al. Interferon-gamma exacerbates dry eye-induced apoptosis in conjunctiva through dual apoptotic pathways. Invest.
Ophthalmol. Vis. Sci. 52, 6279–6285. https://doi.org/10.1167/iovs.10-7081 (2011).
4. Zhou, H., Yang, J., Tian, J. & Wang, S. CD8(+) T lymphocytes: Crucial players in Sjogren’s syndrome. Front. Immunol. 11, 602823.
https://doi.org/10.3389/fimmu.2020.602823 (2020).
5. Fernandez-Rubio, M. E., Rebolledo-Lara, L., Martinez-Garcia, M., Alarcon-Tomas, M. & Cortes-Valdes, C. The conjunctival
bacterial pattern of diabetics undergoing cataract surgery. Eye 24, 825–834. https://doi.org/10.1038/eye.2009.218 (2010).
6. Hori, Y. et al. Bacteriologic profile of the conjunctiva in the patients with dry eye. Am. J. Ophthalmol. 146, 729–734. https://doi.
org/10.1016/j.ajo.2008.06.003 (2008).
7. Sankaridurg, P. R. et al. Lid and conjunctival micro biota during contact lens wear in children. Optom. Vis. Sci. 86, 312–317. https://
doi.org/10.1097/opx.0b013e318199d20c (2009).
8. Dong, Q. et al. Diversity of bacteria at healthy human conjunctiva. Invest. Ophthalmol. Vis. Sci. 52, 5408–5413. https://doi.org/10.
1167/iovs.10-6939 (2011).
9. Clough, J. N., Omer, O. S., Tasker, S., Lord, G. M. & Irving, P. M. Regulatory T-cell therapy in Crohn’s disease: Challenges and
advances. Gut https://doi.org/10.1136/gutjnl-2019-319850 (2020).
10. Zundler, S. & Neurath, M. F. Immunopathogenesis of inflammatory bowel diseases: Functional role of T cells and T cell homing.
Clin. Exp. Rheumatol. 33, S19-28 (2015).
11. Kostic, A. D., Xavier, R. J. & Gevers, D. The microbiome in inflammatory bowel disease: Current status and the future ahead.
Gastroenterology 146, 1489–1499. https://doi.org/10.1053/j.gastro.2014.02.009 (2014).
12. Khanna, S. & Raffals, L. E. The microbiome in Crohn’s disease: Role in pathogenesis and role of microbiome replacement therapies.
Gastroenterol. Clin. North Am. 46, 481–492. https://doi.org/10.1016/j.gtc.2017.05.004 (2017).
13. Sartor, R. B. Microbial influences in inflammatory bowel diseases. Gastroenterology 134, 577–594. https://doi.org/10.1053/j.gastro.
2007.11.059 (2008).
14. Zaheer, M. et al. Protective role of commensal bacteria in Sjogren Syndrome. J. Autoimmun. 93, 45–56. https://doi.org/10.1016/j.
jaut.2018.06.004 (2018).
15. Ham, B. et al. Distribution and diversity of ocular microbial communities in diabetic patients compared with healthy subjects.
Curr. Eye Res. 43, 314–324. https://doi.org/10.1080/02713683.2017.1406528 (2018).
16. Lozupone, C. A. & Knight, R. Species divergence and the measurement of microbial diversity. FEMS Microbiol. Rev. 32, 557–578.
https://doi.org/10.1111/j.1574-6976.2008.00111.x (2008).
17. Lynch, S. V. & Pedersen, O. The human intestinal microbiome in health and disease. N. Engl. J. Med. 375, 2369–2379. https://doi.
org/10.1056/NEJMra1600266 (2016).
18. Mao, K. et al. Innate and adaptive lymphocytes sequentially shape the gut microbiota and lipid metabolism. Nature 554, 255–259.
https://doi.org/10.1038/nature25437 (2018).
19. Horai, R. & Caspi, R. R. Microbiome and autoimmune uveitis. Front. Immunol. 10, 232. https://d oi.o rg/1 0.3 389/fi mmu.2 019.0 0232
(2019).
20. de Paiva, C. S. et al. Altered mucosal microbiome diversity and disease severity in Sjogren syndrome. Sci. Rep. 6, 23561. https://
doi.org/10.1038/srep23561 (2016).
21. Cavuoto, K. M., Banerjee, S. & Galor, A. Relationship between the microbiome and ocular health. Ocul. Surf. 17, 384–392. https://
doi.org/10.1016/j.jtos.2019.05.006 (2019).
22. Moon, J., Choi, S. H., Yoon, C. H. & Kim, M. K. Gut dysbiosis is prevailing in Sjogren’s syndrome and is related to dry eye severity.
PLoS ONE 15, e0229029. https://doi.org/10.1371/journal.pone.0229029 (2020).
23. Akpek, E. K. & Gottsch, J. D. Immune defense at the ocular surface. Eye 17, 949–956. https://d oi.o rg/1 0.1 038/s j.e ye.6 70061 7 (2003).
24. Zegans, M. E. & Van Gelder, R. N. Considerations in understanding the ocular surface microbiome. Am. J. Ophthalmol. 158,
420–422. https://doi.org/10.1016/j.ajo.2014.06.014 (2014).
25. Ozkan, J. & Willcox, M. D. The ocular microbiome: Molecular characterisation of a unique and low microbial environment. Curr.
Eye Res. 44, 685–694. https://doi.org/10.1080/02713683.2019.1570526 (2019).
26. Lee, S. H., Oh, D. H., Jung, J. Y., Kim, J. C. & Jeon, C. O. Comparative ocular microbial communities in humans with and without
blepharitis. Invest. Ophthalmol. Vis. Sci. 53, 5585–5593. https://doi.org/10.1167/iovs.12-9922 (2012).
27. Graham, J. E. et al. Ocular pathogen or commensal: A PCR-based study of surface bacterial flora in normal and dry eyes. Invest.
Ophthalmol. Vis. Sci. 48, 5616–5623. https://doi.org/10.1167/iovs.07-0588 (2007).
28. Zhou, Y. et al. The conjunctival microbiome in health and trachomatous disease: A case control study. Genome Med. 6, 99. https://
doi.org/10.1186/s13073-014-0099-x (2014).
29. Shin, H. et al. Changes in the eye microbiota associated with contact lens wearing. MBio 7, e00198. https://doi.org/10.1128/mBio.
00198-16 (2016).
30. Trujillo-Vargas, C. M. et al. The gut-eye-lacrimal gland-microbiome axis in Sjogren Syndrome. Ocul. Surf. 18, 335–344. https://
doi.org/10.1016/j.jtos.2019.10.006 (2020).
Scientific Reports | (2022) 12:1715 | https://doi.org/10.1038/s41598-022-05625-w 8
Vol:.(1234567890)www.nature.com/scientificreports/
31. Bassler, B. L. How bacteria talk to each other: Regulation of gene expression by quorum sensing. Curr. Opin. Microbiol. 2, 582–587.
https://doi.org/10.1016/s1369-5274(99)00025-9 (1999).
32. Miller, M. B. & Bassler, B. L. Quorum sensing in bacteria. Annu. Rev. Microbiol. 55, 165–199. https://doi.org/10.1146/annurev.
micro.55.1.165 (2001).
33. Ozkan, J. et al. Temporal stability and composition of the ocular surface microbiome. Sci. Rep. 7, 9880. https://doi.org/10.1038/
s41598-017-10494-9 (2017).
34. Huang, Y., Yang, B. & Li, W. Defining the normal core microbiome of conjunctival microbial communities. Clin. Microbiol. Infect.
22(643), e647–e643. https://doi.org/10.1016/j.cmi.2016.04.008 (2016).
35. Rizzatti, G., Lopetuso, L. R., Gibiino, G., Binda, C. & Gasbarrini, A. Proteobacteria: A common factor in human diseases. Biomed.
Res. Int. 2017, 9351507. https://doi.org/10.1155/2017/9351507 (2017).
36. Shin, N. R., Whon, T. W. & Bae, J. W. Proteobacteria: Microbial signature of dysbiosis in gut microbiota. Trends Biotechnol. 33,
496–503. https://doi.org/10.1016/j.tibtech.2015.06.011 (2015).
37. Binda, C. et al. Actinobacteria: A relevant minority for the maintenance of gut homeostasis. Dig. Liver Dis. 50, 421–428. https://
doi.org/10.1016/j.dld.2018.02.012 (2018).
38. Cani, P. D. et al. Changes in gut microbiota control inflammation in obese mice through a mechanism involving GLP-2-driven
improvement of gut permeability. Gut 58, 1091–1103. https://doi.org/10.1136/gut.2008.165886 (2009).
39. Azman, A. S., Mawang, C. I., Khairat, J. E. & AbuBakar, S. Actinobacteria-a promising natural source of anti-biofilm agents. Int.
Microbiol. 22, 403–409. https://doi.org/10.1007/s10123-019-00066-4 (2019).
40. Dent, L. L., Marshall, D. R., Pratap, S. & Hulette, R. B. Multidrug resistant Acinetobacter baumannii: A descriptive study in a city
hospital. BMC Infect. Dis. 10, 196. https://doi.org/10.1186/1471-2334-10-196 (2010).
41. Hanski, I. et al. Environmental biodiversity, human microbiota, and allergy are interrelated. Proc. Natl. Acad. Sci. U S A 109,
8334–8339. https://doi.org/10.1073/pnas.1205624109 (2012).
42. St Leger, A. J. et al. An ocular commensal protects against corneal infection by driving an interleukin-17 response from mucosal
gammadelta T cells. Immunity 47, 148–158. https://doi.org/10.1016/j.immuni.2017.06.014 (2017).
43. Doan, T. et al. Paucibacterial microbiome and resident DNA virome of the healthy conjunctiva. Invest. Ophthalmol. Vis. Sci. 57,
5116–5126. https://doi.org/10.1167/iovs.16-19803 (2016).
44. Tomlinson, A. et al. The international workshop on meibomian gland dysfunction: Report of the diagnosis subcommittee. Invest.
Ophthalmol. Vis. Sci. 52, 2006–2049. https://doi.org/10.1167/iovs.10-6997f (2011).
45. Shiboski, S. C. et al. American College of Rheumatology classification criteria for Sjogren’s syndrome: A data-driven, expert
consensus approach in the Sjogren’s International Collaborative Clinical Alliance cohort. Arthritis Care Res. 64, 475–487. https://
doi.org/10.1002/acr.21591 (2012).
46. Schiffman, R. M., Christianson, M. D., Jacobsen, G., Hirsch, J. D. & Reis, B. L. Reliability and validity of the Ocular Surface Disease
Index. Arch. Ophthalmol. 118, 615–621. https://doi.org/10.1001/archopht.118.5.615 (2000).
47. Korb, D. R., Greiner, J. V. & Herman, J. Comparison of fluorescein break-up time measurement reproducibility using standard
fluorescein strips versus the Dry Eye Test (DET) method. Cornea 20, 811–815. https://d oi.o
rg/1 0.1 097/0 00032 26-2 00111 000-0 0007
(2001).
48. Whitcher, J. P. et al. A simplified quantitative method for assessing keratoconjunctivitis sicca from the Sjogren’s Syndrome Inter-
national Registry. Am. J. Ophthalmol. 149, 405–415. https://doi.org/10.1016/j.ajo.2009.09.013 (2010).
49. Caporaso, J. G. et al. Ultra-high-throughput microbial community analysis on the Illumina HiSeq and MiSeq platforms. ISME J.
6, 1621–1624. https://doi.org/10.1038/ismej.2012.8 (2012).
50. Caporaso, J. G. et al. QIIME allows analysis of high-throughput community sequencing data. Nat. Methods 7, 335–336. https://
doi.org/10.1038/nmeth.f.303 (2010).
51. Edgar, R. C. Search and clustering orders of magnitude faster than BLAST. Bioinformatics 26, 2460–2461. https://doi.org/10.1093/
bioinformatics/btq461 (2010).
52. Caporaso, J. G. et al. PyNAST: A flexible tool for aligning sequences to a template alignment. Bioinformatics 26, 266–267. https://
doi.org/10.1093/bioinformatics/btp636 (2010).
53. Wang, Q., Garrity, G. M., Tiedje, J. M. & Cole, J. R. Naive Bayesian classifier for rapid assignment of rRNA sequences into the new
bacterial taxonomy. Appl. Environ. Microbiol. 73, 5261–5267. https://doi.org/10.1128/AEM.00062-07 (2007).
54. DeSantis, T. Z. et al. Greengenes, a chimera-checked 16S rRNA gene database and workbench compatible with ARB. Appl. Environ.
Microbiol. 72, 5069–5072. https://doi.org/10.1128/AEM.03006-05 (2006).
55. McKnight, D. T. et al. Methods for normalizing microbiome data: An ecological perspective. Methods Ecol. Evol. 10, 389–400.
https://doi.org/10.1111/2041-210X.13155 (2018).
Acknowledgements
We thank Dr. Dion Antonopoulos and Mr. Jason Koval from Argonne National Laboratory (Lemont, IL, USA)
for sequencing the samples. The authors acknowledge financial support from the Basic Science Research Program
through the National Research Foundation of Korea (NRF) funded by the Ministry of Science, ICT & Future
Planning (2017R1C1B5017408). This research was supported by a Grant of Translational R&D Project through
the Institute for Bio-Medical Convergence, Incheon St. Mary’s Hospital, The Catholic University of Korea. The
authors alone are responsible for the content and preparation of this article.
Author contributions
H.B.H. and K.D.K. designed the research and collected the samples. H.B.H. and H.S.K. wrote and edited the
manuscript. B.N. and M.J.K. analyzed the data. B.N., Y.C.K., H.S.K., J.M.Y. and K.D.K. performed the experi-
mental work. Y.C.K. and B.N. contributed equally to this study as first authors. All authors read and approved
the manuscript.
Competing interests
The authors declare no competing interests.
Additional information
Supplementary Information The online version contains supplementary material available at https://doi.org/
10.1038/s41598-022-05625-w.
Correspondence and requests for materials should be addressed to H.B.H.
Reprints and permissions information is available at www.nature.com/reprints.
Scientific Reports | (2022) 12:1715 | https://doi.org/10.1038/s41598-022-05625-w 9
Vol.:(0123456789)www.nature.com/scientificreports/
Publisher’s note Springer Nature remains neutral with regard to jurisdictional claims in published maps and
institutional affiliations.
Open Access This article is licensed under a Creative Commons Attribution 4.0 International
License, which permits use, sharing, adaptation, distribution and reproduction in any medium or
format, as long as you give appropriate credit to the original author(s) and the source, provide a link to the
Creative Commons licence, and indicate if changes were made. The images or other third party material in this
article are included in the article’s Creative Commons licence, unless indicated otherwise in a credit line to the
material. If material is not included in the article’s Creative Commons licence and your intended use is not
permitted by statutory regulation or exceeds the permitted use, you will need to obtain permission directly from
the copyright holder. To view a copy of this licence, visit http://creativecommons.org/licenses/by/4.0/.
© The Author(s) 2022
Scientific Reports | (2022) 12:1715 | https://doi.org/10.1038/s41598-022-05625-w 10
Vol:.(1234567890)You can also read