Big Data, Big Deal Using Data for Program Development & Operational Analysis - Paula Nissen - Iowa Department of Education - National Council for ...
←
→
Page content transcription
If your browser does not render page correctly, please read the page content below

Big Data, Big Deal
Using Data for Program Development
& Operational Analysis

Paula Nissen – Iowa Department of Education
This Session

• Understanding data sources
• Resources relating to workforce
• Connecting state and local goals
• Case scenario

Acronyms and Data

A word formed from the initial letters of groups of letters of words in a set
phrase or series of words, then pronounced as a word - or - a set of initials
representing a name or organization with each letter pronounced
separately
          A–bbreviation
          C–hallenging
          R–idiculous
          O–bscure
          N–ecessary
          Y–outh (LOL, BFF, TFTI, ROFL)
          M–ethod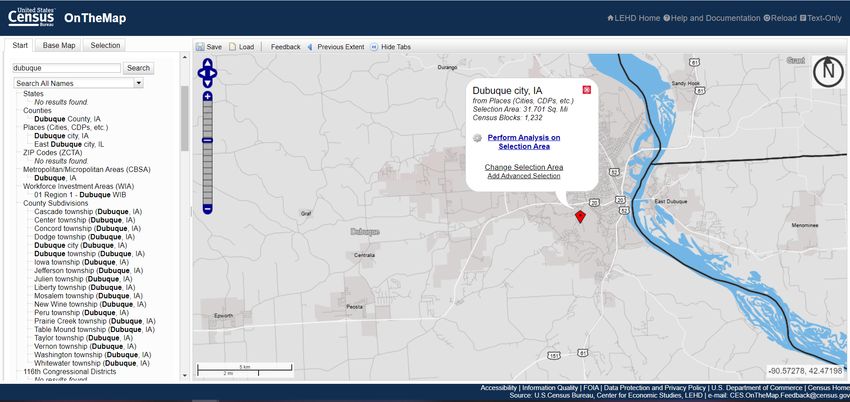
United States Department of Labor
Bureau of Labor Statistics (BLS)
Fact-finding agency
Labor Market Information (LMI)
Employment & Training Administration (ETA)
Administers Job Training & Worker Dislocation Programs
Employment services programs
Unemployment Insurance (UI) benefits
Delivered through workforce development system grants
Job training
Employment
LMI (state, local, regional)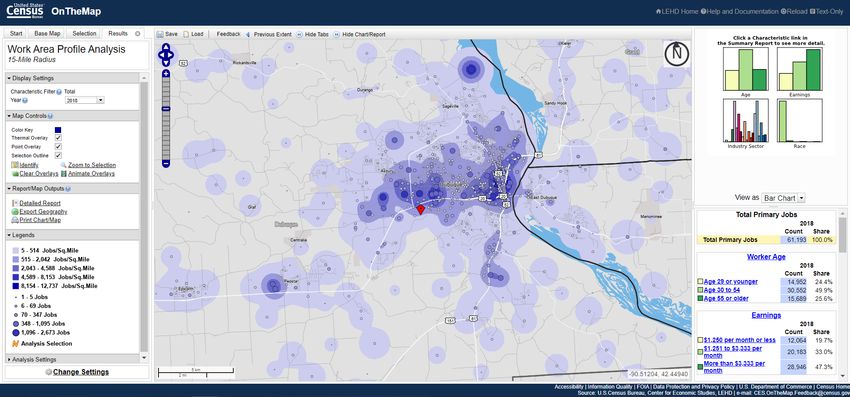
United States Department of Labor
BLS & ETA Data Contain
Current Employment Statistics (CES)
Quarterly Census of Employment & Wages (QCEW)
UI Covered Employment (Old name: ES 202)
Occupational Employment Statistics (OES)
Local Area Unemployment Statistics (LAUS)
Occupational Projections
Industry Projections
Wage & Employment Estimates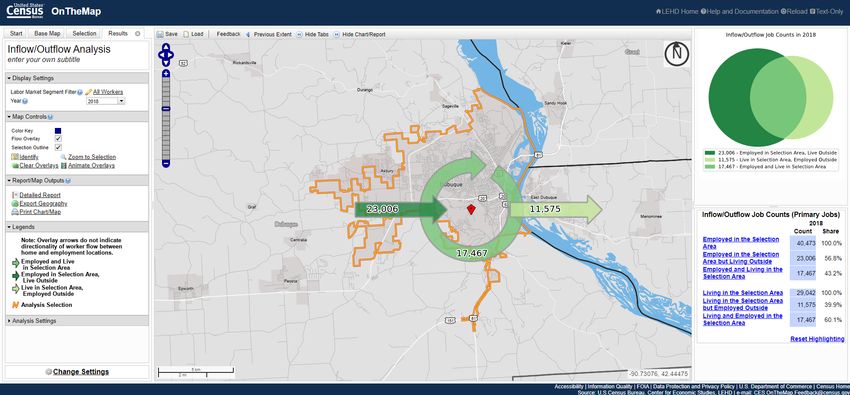
Other Very Useful Sites O*Net Online My Skills My Future Longitudinal Employer Household Dynamics (LEHD) On The Map (consists of Census & QCEW)
Current Employment Statistics (CES) Establishment Payroll Survey 150,000 employers surveyed monthly Employment by industry NAICS (North American Industry Classification System) SIC (Standard Industry Classification used prior to 1998) Total wages by industry Reported by multiple geography National State Metropolitan Statistical Area (MSA)
CES on BLS

Click/Enter the link to find any state
http://data.bls.gov/cgi-bin/surveymost?sm
Example:
Manufacturing Sector in Iowa
Employment January 2011 was 203,600
Employment January 2021 was 218,400
Increased by 14,800 or 7.3%
Occupational Employment Statistics (OES) Occupation Survey (200,000 employers every 6 mo.) Standard Occupational Classification (SOC) Code Employers who pay Unemployment Insurance (UI) taxes Estimated employment & wages State, Region, MSA, & County level Uses Analysis of occupational employment Analysis of occupational wages Development of occupational projections Vocational counseling and planning
Iowa OES Wage Tables/Data

   Search Occupation by Geography:
   • Statewide
   • Metropolitan Area
   • Workforce Region
   • Balance of State
       • Northeast
       • Northwest
       • Southeast
       • Southwest

http://www.iowaworkforcedevelopment.gov/iowa-wage-report
OES on BLS
Search Occupation Nationally:
• Occupational Category
• Occupation Specific
• Wages
• Top Industries
• Location Quotient
http://www.bls.gov/oes/current/oessrcst.htmLocal Area Unemployment Statistics (LAUS)
Current Population Survey (CPS)
50,000 households nationwide monthly
Representing 90,000 individuals
Workers 16 and above
Unemployment & employment rate
Uses
Evaluate the unemployment rate
Evaluate employment/labor force data by area (migration)LAUS on BLS
Analyzed by the following Areas:
• Census regions and divisions
• States
• Metropolitan Statistical Areas and Metropolitan NECTAS
(New England City and Town Areas)
• Metropolitan Divisions and NECTA Divisions
• Micropolitan Statistical Areas and Micropolitan NECTAs
• Combined Metropolitan Statistical Areas and Combined
NECTAs
• Small Labor Market Areas
• Counties and county equivalents
• Cities of 25,000 population or more
• Cities and towns in New England regardless of populationIowa LAUS Search by County: • Employed • Labor Force • Employed and Available for Employment • Unemployed • Unemployment Rate (%) http://www.iowaworkforcedevelopment.gov/local-area- unemployment-statistics
Occupational or Industry Projections
Occupational or Industry Projections
Long Term (2018 – 2028)
(usually updated every other year, 2 year lag)
Employment by SOC job title or NAICS Code
Employment change
(numeric, percent, and average openings)
Short Term (2020 – 2022 – updated quarterly)
Data contents, same as aboveOccupational Projections http://www.projectionscentral.com/ Projections Managing Partnership
Industry Projections

           Each state is unique for industry projections
Longitudinal Employer-Household Dynamics (LEHD) & Quarterly
Workforce Indicators (QWI)
State/Federal Partnership with the US Census Bureau
Demographic employment information
Total Employment
Net Job Flows
Job Creation
New Hires
Separations
Turnover Rate
Average Monthly Earnings
Average New Hire Earnings
By State, Metro & County and sometimes Workforce Innovation and Opportunity
Act (WIOA) RegionLEHD/QWI – Participating States
https://lehd.ces.census.gov/state_partners/Quarterly Workforce Indicators (QWI) Explorer
https://qwiexplorer.ces.census.gov/static/explore.html#x=0&g=0QWI – Workforce by Education Level & Gender
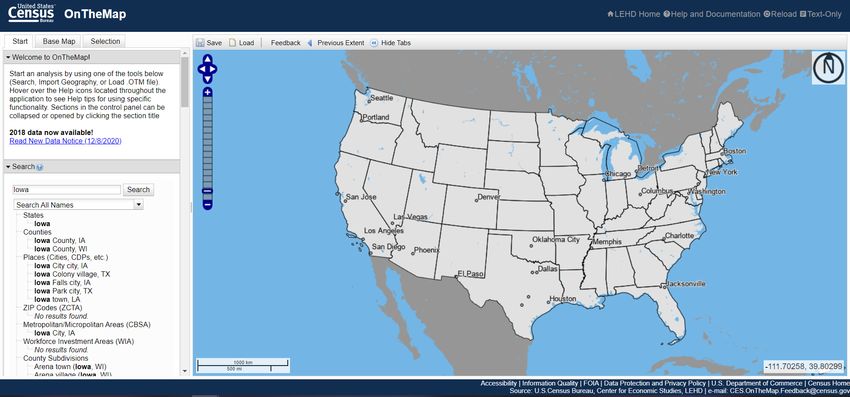
http://qwiexplorer.ces.census.gov/#x=0&g=0OnTheMap
http://onthemap.ces.census.gov/OnTheMap
http://onthemap.ces.census.gov/OnTheMap
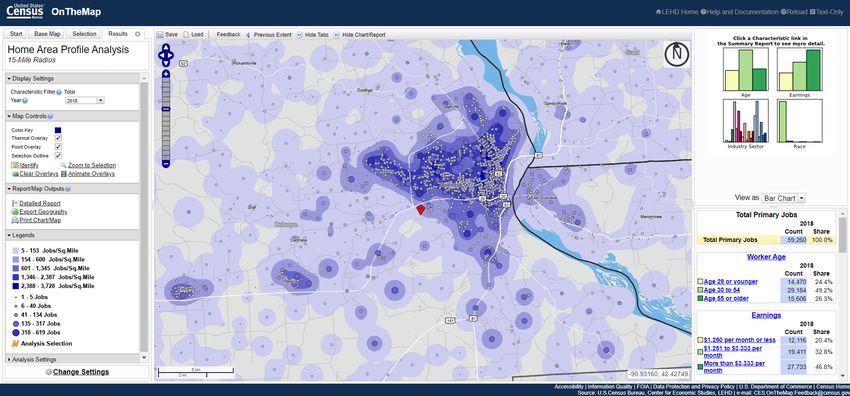
Work and Home Area Profiles
Home Area Profile

       Total Primary Jobs                                                             Jobs by Worker Race
                                                                         2018                                                                                  2018
                                                                    Count    Share                                                                        Count    Share
       Total Primary Jobs                                            59,260 100.0%    White Alone                                                          56,327   95.1%
                                                                                      Black or African American Alone                                       1,589    2.7%
       Jobs by Worker Age                                                             American Indian or Alaska Native Alone                                  116    0.2%
                                                                         2018         Asian Alone                                                             619    1.0%
                                                                    Count    Share    Native Hawaiian or Other Pacific Islander Alone                         117    0.2%
       Age 29 or younger                                             14,470   24.4%   Two or More Race Groups                                                 492    0.8%
       Age 30 to 54                                                  29,184   49.2%
       Age 55 or older                                               15,606   26.3%   Jobs by Worker Ethnicity
                                                                                                                                                               2018
       Jobs by Earnings                                                                                                                                   Count    Share
                                                                         2018         Not Hispanic or Latino                                               57,997   97.9%
                                                                    Count    Share    Hispanic or Latino                                                    1,263    2.1%
       $1,250 per month or less                                      12,116   20.4%
       $1,251 to $3,333 per month                                    19,411   32.8%   Jobs by Worker Educational Attainment
       More than $3,333 per month                                    27,733   46.8%                                                                            2018
                                                                                                                                                          Count    Share
       Jobs by NAICS Industry Sector                                                  Less than high school                                                 3,564    6.0%
                                                                         2018         High school or equivalent, no college                                14,428   24.3%
                                                                    Count    Share    Some college or Associate degree                                     15,164   25.6%
       Agriculture, Forestry, Fishing and Hunting                       416    0.7%   Bachelor's degree or advanced degree                                 11,634   19.6%
       Mining, Quarrying, and Oil and Gas Extraction                     93    0.2%   Educational attainment not available (workers aged 29 or younger)    14,470   24.4%
       Utilities                                                        212    0.4%
       Construction                                                   2,742    4.6%   Jobs by Worker Sex
       Manufacturing                                                  8,776   14.8%                                                                            2018
       Wholesale Trade                                                2,952    5.0%                                                                       Count    Share
       Retail Trade                                                   6,789   11.5%   Male                                                                 29,563   49.9%
       Transportation and Warehousing                                 2,348    4.0%   Female                                                               29,697   50.1%
       Information                                                    1,153    1.9%
       Finance and Insurance                                          4,125    7.0%
       Real Estate and Rental and Leasing                               467    0.8%
       Professional, Scientific, and Technical Services               2,332    3.9%
       Management of Companies and Enterprises                          900    1.5%
       Administration & Support, Waste Management and Remediation     2,348    4.0%
       Educational Services                                           5,736    9.7%
       Health Care and Social Assistance                              8,893   15.0%
       Arts, Entertainment, and Recreation                            1,186    2.0%
       Accommodation and Food Services                                4,325    7.3%
       Other Services (excluding Public Administration)               1,503    2.5%
       Public Administration                                          1,964    3.3%
Inflow/Outflow
NEW – Post-secondary Employment Outcomes (PSEO)
State/Federal Partnership with the
US Census Bureau
Institution
Degree Level
Graduating Cohort
Earnings by Cluster
1, 5, and 10 years post gradHelpful Occupational Information http://online.onetcenter.org/
Related Jobs

http://www.onetonline.org/find/quick?s=welder
Summary Report
Wage & Employment Trends

http://www.careeronestop.org/
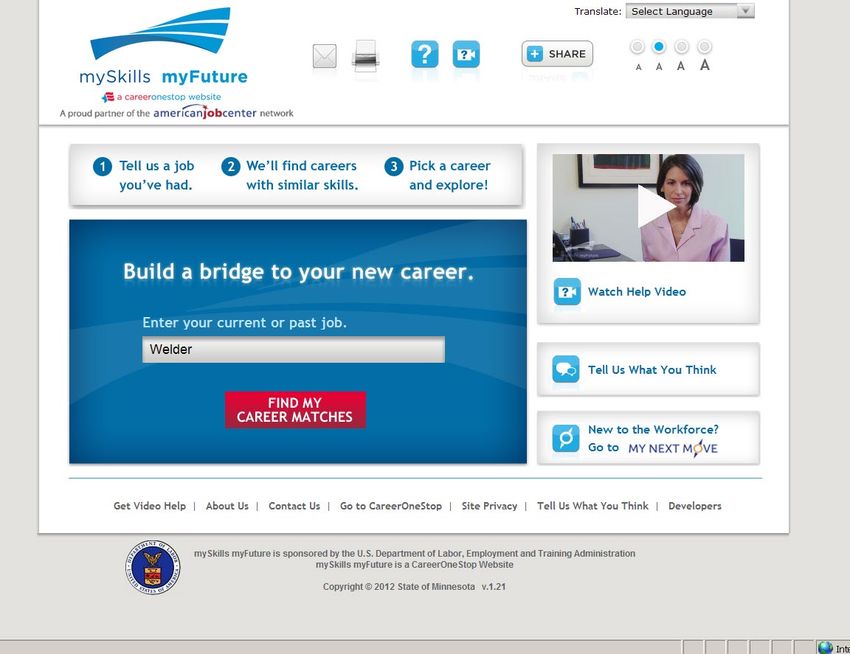
mySkills myFuture

http://www.myskillsmyfuture.org/
Listings for Related Jobs
Employer Locator (50 mile radius)
Employer search engine
By Employer Name
By Industry Title
By Industry Code
Occupation
Type in a keyword and click
“continue”
List of employers
Click on each for detail
Map the location
https://www.careeronestop.org/Toolkit/Jobs/find-businesses.aspxOccupation Locator Employer search engine By Employer Name By Industry Title By Industry Code Occupation Type in a keyword and click “continue” List of employers Click on each for detail Map the location
Connecting Workforce, Education,
  and Economic Development

    How are states bringing it all together?
Educational Attainment Goals
• Why did this come about?
₋ What % of jobs will require some postsecondary training (beyond high
school) by 2025.
₋ Where are we at as a state in meeting the needs of the employers?
₋ Types of training needed (vary state to state)?
₋ How do we connect…
People to
Training to
JobsMeasurement of Jobs
• Measurement is documented by state
• “Ranking of the States” produced by Georgetown’s Center on
Education and the Workforce
₋ Includes jobs in all industries
₋ Based on current, past, and projected job growth
https://cew.georgetown.edu/wp-content/uploads/OCLMStates_FR_3.pdfhttps://cew.georgetown.edu/states-initiative/
Measurement of People

• Measurement based on American Community Survey
  ₋ Includes people 25 to 64 years old
  ₋ Includes Associate Degree or higher
  ₋ Trend data is available
• Drawback
  ₋ Does not include all postsecondary training
    ₋ Diplomas, Certificates, Certification, Licensure
http://strongernation.luminafoundation.org/report/2018/#nation
How can I get a competitive edge?

• Develop customized surveys
• Provide results specific to the industry or cluster
• Include the most requested information
   • Wages
   • Experience/skills
   • Availability of labor
   • Commuting area you draw from
   • Training availability
• Keep it current!!!
Case Study Scenario

Example of NCWE Company
Prospect Recruitment Preparation
Case Study Scenario

• Company NCWE
 • Identify Competition
 • Identify Current Workforce
 • Identify Demand
 • What Wages
 • Identify Training Programs
What do we know about the company workforce needs?

• NCWE Company
 • Trucking Company
 • Will employ approximately 50 people
 • Management will be covered
 • Needs warehouse and truck driver workforce
• What does the
  workforce look like
  in my region
  (Dubuque, IA)?
• Demographics
• Industry
• Projected Job
  Growth
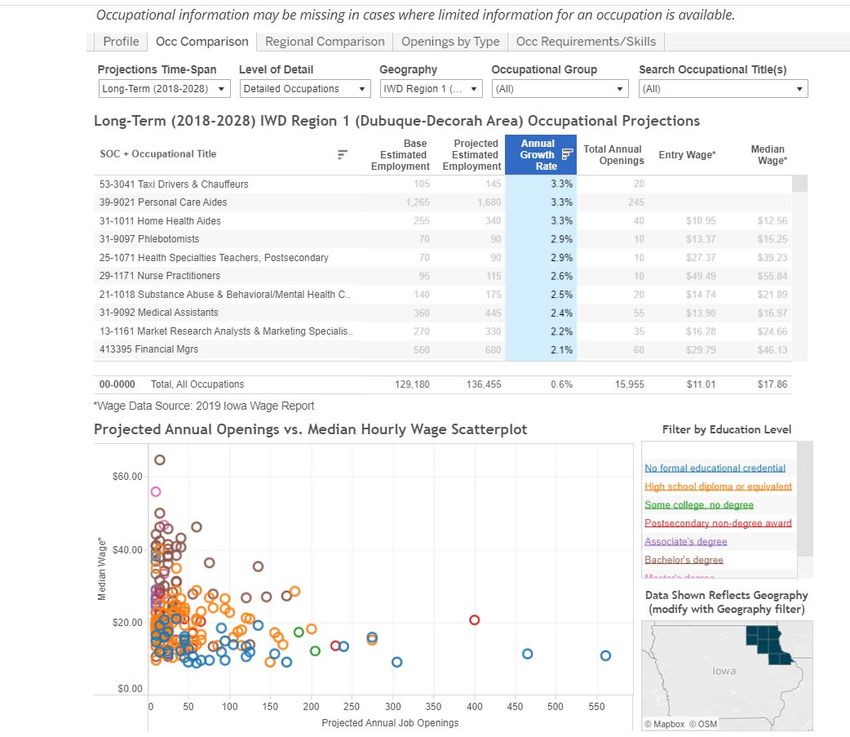
Highest Growth Jobs in Region
$15/hour or higher (median wage)

By Number                                 By Percent
• Heavy & Tractor-Trailer Truck Drivers   • Phlebotomists
• Laborers & Freight Stock                • Health Specialties Teachers, Postsecondary

• Office Clerks                           • Nurse Practitioners

• Customer Service Reps                   • Substance Abuse & Behavioral Counselors
                                          • Medical Assistants
• Bookkeeping, Accounting Clerks
                                          • Market Research Analysts
• Sales Reps, Wholesale & Manufacturing
                                          • Financial Managers
• Registered Nurses
                                          • Physical Therapists
NAICS code for company
Industry Classification
• Enter company type in
“Keyword Search” to find
the code
• Click on the code for
definition
https://www.census.gov/naics/Industry to
Occupation Matrix
• What jobs make up this
industry?
• Search for NAICS Code
previously identified
What Jobs will Be in
demand
https://www.bls.gov/emp/tables/industry-occupation-matrix-industry.htmOccupational Makeup of Industry
Top Industries for Heavy Truck Drivers – Staffing Patterns

                                                  Staffing Patterns show
                                                  what occupations are
                                                  within each industry and
                                                  the number of employed
                                                  within each industry.
                                                  Helps to determine
                                                  where the majority of
                                                  openings may be located
                                                  by business type.
Businesses by Industry
Is there competition from
current business?
Current Competition
in Region
Click on the business name
for contact information.
https://www.careeronestop.org/Toolkit/Jobs/find-businesses.aspxOccupations across industries • What other businesses in my region employ people in these jobs?
Industry Growth/Decline

                                • If other industries are
                                  declining that employ
                                  people with these skills,
                                  there may be additional
                                  trained workers available.

                          Industry growth &
                          Decline
Wages & Training Options
Summary

• This company will have jobs that are growing in my region
• I have some competition in my region from other businesses
• I also have some industries that are declining that may have workers
• Wages are great for these jobs
• There are training institutions in my region
• There are grads from the colleges in my region
• I have potential workers leaving the region
What would you do?

Is EDI company a good fitDiscussion…….
                         for you region?
Questions & Contact Information
Paula Nissen, Education Analyst
Paula.Nissen2@iowa.gov
(515) 418-8273
Iowa Department of Education
Community College Division
400 East 14th Street – Grimes Building
Des Moines, Iowa 50319You can also read