BUFFALO RIVER CORRIDOR - BROWNFIELD OPPORTUNITY AREA
←
→
Page content transcription
If your browser does not render page correctly, please read the page content below
BUFFALO RIVER CORRIDOR
               BROWNFIELD OPPORTUNITY AREA

                            NOMINATION DOCUMENT
                                        JULY 2014

                              WORKING DRAFT
                             (MAPS/GRAPHICS INCOMPLETE)

This document was prepared for the City of Buffalo and the New York State Department of State
        with state funds provided through the Brownfield Opportunity Areas Program.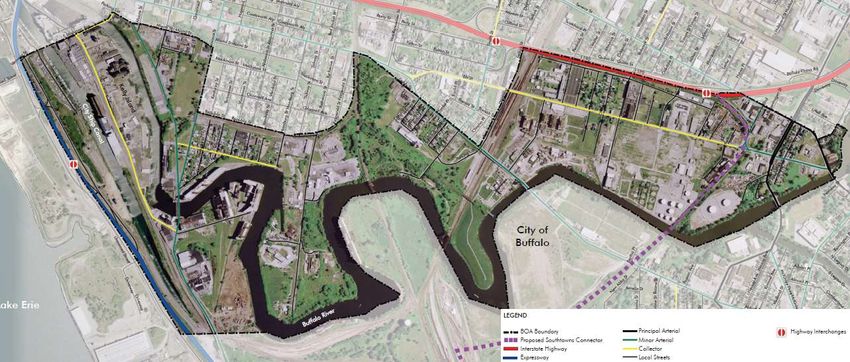
TABLE OF CONTENTS
1. Project Description ……………………………………………………… 1
2. Community Participation ………………………………………………. 5
3. Analysis ………………………………………………………..……….. 9
4. Inventory ……………………………………………………..………… 21
5. Alternative Scenarios Exercise …………………..…….……..………... 81
6. Land Use Plan ………………………………………………………….. 88
Appendix A: Place Type Definitions …………………..……..………... 91
MAPS
1. Boundaries 16. Water Access
2. Soils 17. Archeological / Historical Resources
3. Topography 18. Existing Zoning
4. Wetlands and Flood Hazard Areas 19. Existing Land Use
5. Electric Infrastructure 20. Land Ownership
6. Water Infrastructure 21. Large Parcels
7. Sewer Infrastructure 22. Key Buildings
8. Green Infrastructure 23. Major Facilities
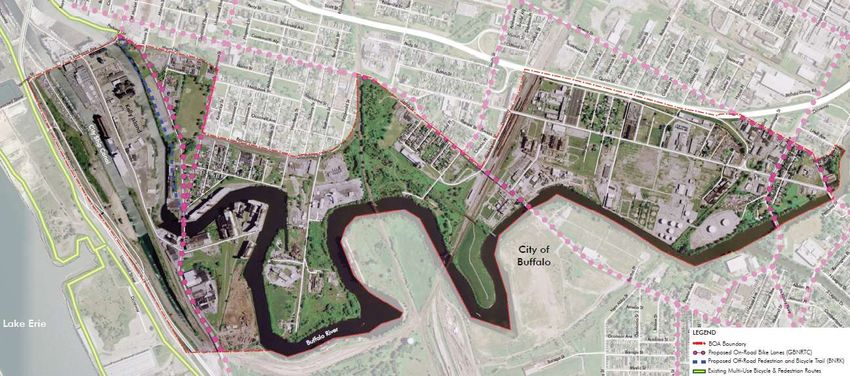
9. Pedestrian/Bicycle Infrastructure 24. Abandoned Structures
10. Public Transportation Infrastructure 25. Vacant Sites
11. Road Infrastructure 26. Potential Brownfields
12. Rail Infrastructure 27. Scenario 1
13. Navigable Waterways 28. Scenario 2
14. Parks and Open Space 29. Scenario 3
15. Trails 30. Proposed Place Types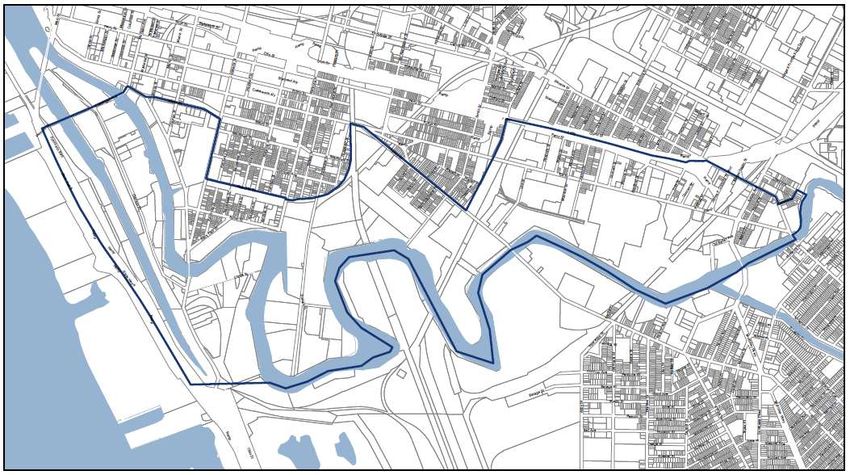
1
PROJECT DESCRIPTION

               1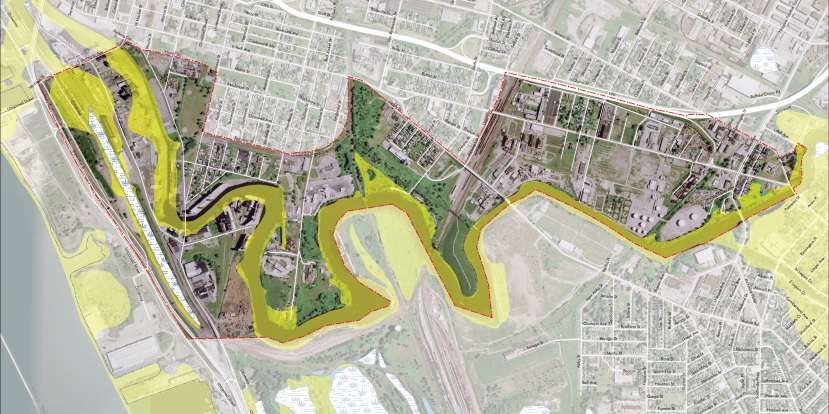
1.1 OVERVIEW

The City of Buffalo was awarded New York State Department of State funding to establish a Buffalo
River Corridor Brownfield Opportunity Area. This funding allows recipients to plan for the revitalization
of underutilized, vacant, and brownfield sites by establishing a vision for their redevelopment, and
strategies to return the sites to productive use.
The BOA covers 1,052 acres – over 1.5 square miles – to the southeast of downtown. It contains a large
number of brownfields and abandoned parcels; a legacy from the industries that were once located along
the Buffalo River.
Redevelopment of this area will be based on its strategic location, which includes highways and rail lines
that connect to destinations in both the US and Canada, as well as access to the Buffalo River and Lake
Erie. Ongoing efforts to restore waterfront lands and improve public amenities will bolster interest in the
area and create opportunities for land uses that match the needs of the community.
The Buffalo River Corridor BOA builds on the adjacent South Buffalo BOA, and represents a natural
progression from this effort by taking into account the impact of industries located along the Buffalo
River. As brownfield sites are remediated in South Buffalo, additional shovel-ready land will be needed
to continue attracting development.
The BOA is being evaluated as part of a Generic Environmental Impact Statement. The GEIS will review
the impacts of adopting all four Brownfield Opportunity Areas in the city (Buffalo Harbor, Buffalo River
Corridor, South Buffalo, and Tonawanda Street Corridor), the Local Waterfront Revitalization Program,
changes to existing urban renewal plans, and the updated land use plan and zoning code.
The Common Council was declared lead agency, and a Positive Declaration and a draft scope of work
were prepared. A public comment period will take place in 2014, and the draft GEIS will be submitted to
the Common Council for review and approval. Once the GEIS is in place, the majority of development
proposals will be able to proceed without additional environmental review.

1.2     COMMUNITY VISION, GOALS, AND OBJECTIVES
The BOA process seeks to initiate, prioritize, and guide land remediation and redevelopment by
identifying economic, social, and cultural opportunities. A vision for the future must be guided with
broad-based community, municipal, and state support; and solidly grounded in current and emerging
challenges, initiatives, and opportunities.
The long-term goal is to pursue both environmental enhancement and sustainable development by
creating a plan designed by stakeholders, including area residents, businesses, environmental advocates,
and government. Consensus building began at project inception, by ensuring that the various concerns and
goals were discussed in an open fashion. Community contributions and acceptance are vital to the success
of any redevelopment plan.

                                                     2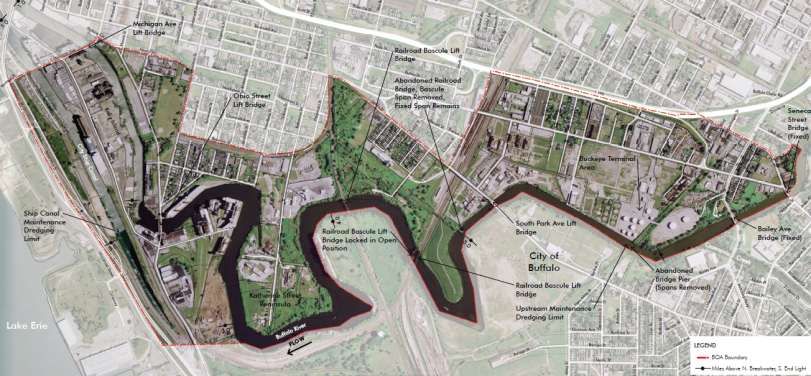
Planning is essential to ensure that future development does not compromise the health of the river; but
instead contributes to its delisting as an Area of Concern. The need to generate employment opportunities
and tax revenues must be balanced with strengthening neighborhoods, expanding recreational
opportunities, preserving industrial heritage, ensuring waterfront access, and improving habitats and
watershed ecology.

1.3 BOUNDARY DESCRIPTION AND JUSTIFICATION

The boundaries were selected to include major heavy industrial areas located along the Buffalo River, and
the mixed-use residential areas surrounding these active and former plant sites. The major industrial
parcels include Kelly Island and the City Ship Canal, Silo City, the Katherine Street Peninsula, and the
Elk Street Corridor.
The mixed-use neighborhoods surrounding these employment centers were included so that residents
most affected by the recent transitions would have a voice in future land use decisions. These areas
include the Old First Ward, Seneca-Babcock, and Valley neighborhoods. Boundaries were also based on
quality-of-life enhancements such as shorelines, so that redevelopment could take advantage of these
amenities and make connections to these resources.
The western boundary includes the terminus of the City Ship Canal and Kelly Island, so that sensitive
river environments and potential public access enhancements can be addressed. The northern boundary
includes residential areas directly affected by the adjacent industries, a major rail corridor, the New York
State Thruway, and arterials. The eastern boundary roughly coincides with the end of the navigable
portion of the Buffalo River, where it ceases to be an industrial area. The southern boundary traces the
Buffalo River, and abuts the South Buffalo BOA. [Map 1]

                                                      3
Map 1: Boundaries

                    4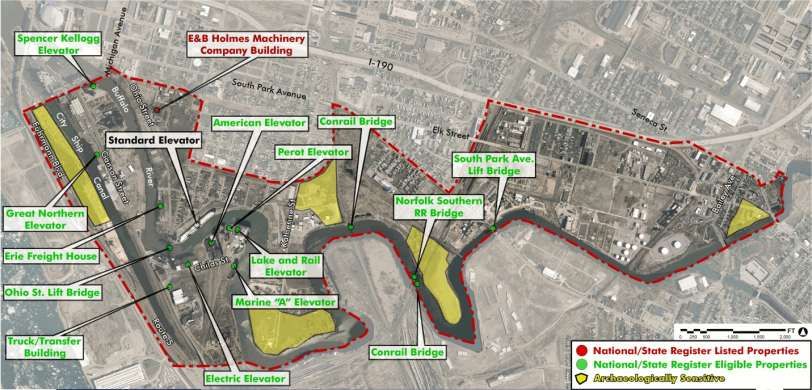
2
COMMUNITY PARTICIPATION

              5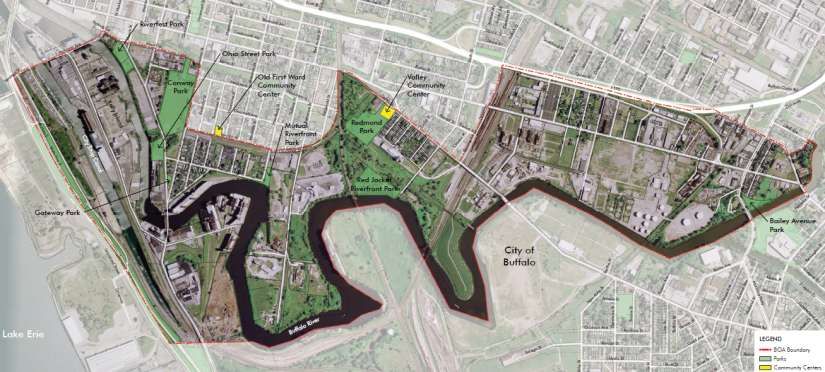
2.1 COMMUNITY PARTICIPATION PLAN
The community participation plan was designed to enable input at a variety of levels and stages during the
development of the Nomination Document. The plan was organized around project tasks to provide
timely inputs into deliverables. A range of opportunities for community involvement were identified,
from public open houses to small stakeholder sessions. The project website also provided opportunities
for interested parties to submit comments.
The following methods for engaging the community were employed:
Stakeholder sessions
Steering committee meetings
Public open houses
2.2 TECHNIQUES TO ENLIST PARTNERS
The consultation process employed numerous outreach methods to ensure robust public and private
participation. The design and production of easily accessible materials and the provision of multiple
opportunities for feedback were seen as essential to a successful communication strategy.
Several different audiences were engaged throughout the course of the planning process. In order to
effectively communicate with each group, contact lists were developed and updated with names,
addresses, phone numbers, and e-mail addresses. These lists included residents, block clubs, non-profits
and community groups; advocacy organizations, educational institutions, businesses and developers;
county, state, and federal agencies; city departments and boards; elected officials; and steering committee
members.
The opportunities for community participation included:
Stakeholder Sessions
A series of stakeholder sessions were held in November 2011 and January 2012, to assist the project team
in understanding the dynamics of the study area. These sessions included developers and investors,
businesses and large landholders, non-profits and community-based organizations, regulatory agencies,
and city departments that serve the community.
These early consultations were designed to:
Inform stakeholders about the study process and objectives;
Discuss issues and opportunities, along with policy and development concerns; and
Identify potential projects and initiatives that would benefit the community.
6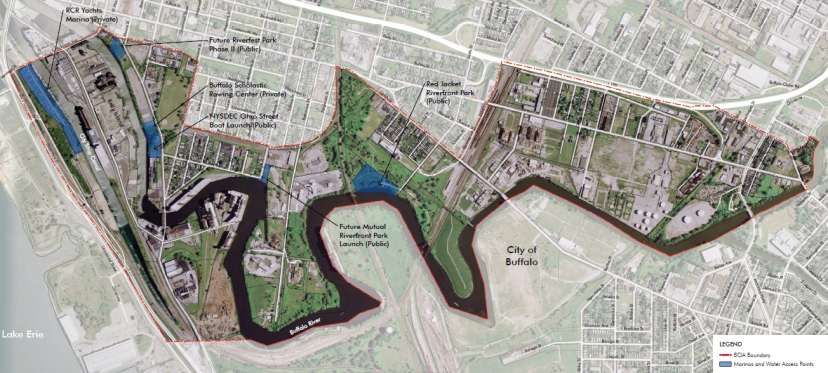
A “Business Breakfast” was also held in June 2012, to provide business owners and developers with an
opportunity to more openly discuss their objectives outside of a public forum.
Steering Committee Meetings
A 20-member steering committee was appointed to review material prepared by the consultant team,
provide input regarding project direction, and serve as liaisons to the larger community. Members
included representatives from local businesses, developers, community-based organizations and other
non-profits, institutions, and the general public. Staff from agencies providing project support were also
invited to attend steering committee meetings. A total of five meetings were held during the course of the
Step 2 process:
December 2011 – the initial meeting introduced the project team; provided overviews of the BOA
program and study process; and included breakout sessions to allow participants to brainstorm
key issues, challenges, opportunities, and goals and aspirations.
January 2012 – the second meeting reviewed consultant analysis and findings to date; introduced
the visioning process that would be employed at the first open house; and included breakout
sessions to discuss types of desired uses and locations, infrastructure needs, and phasing of
proposed improvements.
June 2012 – the third meeting reviewed and discussed three alternative scenarios for future
development.
February 2014 – the fourth meeting will review the draft Nomination Document and initial
strategic sites, discuss concerns, and propose changes.
October 2014 – the final meeting will review the revised Nomination Document and strategic
sites, discuss concerns, and propose changes.
Public Open Houses
A total of four open houses were held over the course of the planning process to share information with
the public and solicit comments and feedback:
January 2012 – the first open house introduced the project objectives, provided an overview of
the analysis conducted to date, and then broke out into visioning sessions to allow participants to
discuss emerging principles and their vision for the BOA over the next two decades.
June 2012 – the second open house started with a brief review of the community input from the
prior meeting, discussed the economic analysis for the BOA, and laid out a set of emerging
principles to guide redevelopment. The consultants provided workbooks outlining the three
alternative development scenarios, and asked participants to mark these up with their thoughts
and comments. The meeting concluded with a facilitated discussion on initial reactions to the
alternative scenarios.
7
April 2014 – the third open house will provide the community with a brief recap of project status,
and review the key findings of the Step 2 Nomination Document. The consultants will identify
the strategic areas that are being proposed, and accept input on their redevelopment potential.
November 2014 – the final open house will review the final Step 3 Nomination Document and
final strategic sites, and allow the community to comment on these materials before the report is
submitted to DOS for approval and adoption of the BOA.
83
ANALYSIS
93.1 COMMUNITY AND REGIONAL SETTING
Regional Context
Buffalo is the largest city in Upstate New York; and is the heart of the Western New York region, which
consists of Erie, Niagara, Orleans, Genesee, Wyoming, Allegany, Cattaraugus, and Chautauqua counties.
Erie and Niagara are the most urbanized of the eight counties, and together form the Buffalo-Niagara
Falls Metropolitan Statistical Area.
Buffalo’s regional context reflects long-term trends in Erie and Niagara counties. The city’s population
peaked at 580,000 in 1950, and declined to 261,000 in 2010. In comparison, Erie County peaked at
1,113,000 in 1970, and fell to 919,000 in 2010; while Niagara County peaked at 242,000 in 1960, and
was at 216,000 in 2010.
These population declines are largely the result of job losses, particularly in manufacturing, over the past
60 years. The region was historically dependent on manufacturing and shipping for its economic base.
Post-WWII, manufacturing underwent a major restructuring, which led to the relocation of industrial
facilities outside of the Midwest and Northeast, and later outside the country. In addition, as production
techniques became more efficient, employment declined significantly even as the value of manufactured
goods remained constant.
In addition to the regional impacts of manufacturing decline, the city was also beginning to experience the
effects of wide-spread suburbanization, which affected almost every urban center beginning in the 1950s.
The rise of “bedroom” communities outside the historic cores initiated a massive shift in population from
cities to suburbs. Yet Buffalo remains the regional center in terms of government, finance, arts, education,
and medicine; which provides the city with a strong platform for future growth.
Buffalo’s transition from manufacturing to a service-based economy has been slow, but appears to be
firmly underway. The University of Buffalo is a major research institution that advances the technological
capabilities of the region. The training provided by UB and other higher education institutions represents
a significant resource. The Buffalo Niagara Medical Campus and major financial institutions reinforce
Buffalo’s position as a center of technology to drive the region’s growth in the service-based economy.
Western New York also benefits from its relationship with Toronto and Southern Ontario, which offers
significant opportunities for growth and development on both sides of the border. Increasing international
trade and cross-border relationships have been a long-term trend. Spurred by the North American Free
Trade Agreement, the region has become a portal for Canadian businesses seeking to access US markets.
Increased economic activity resulting from bi-national trade is expected to become a future source of
growth and development in the region. As Canadian firms seek greater operational efficiencies, it is
anticipated that more facilities and jobs will be located on the US side of the border, with Buffalo
positioned to capture a significant portion of this growth.
10Opportunities and Challenges
The opportunity, as well as the challenge, is to turn Western New York into a “region of choice.” In an
interconnected world, decisions that affect economic growth are increasingly based on choice rather than
necessity. In the industrial economy, decisions on where to locate facilities were based on tangible
economic factors such as access to raw materials, proximity to markets, and the cost of transporting
goods. Today, employment flows to places based on workforce synergies and quality of life factors.
Where people want to live plays a growing role in the relative success of a region.
Quality of life is a broad, somewhat abstract concept encompassing factors such as economics, cost of
living, education, public safety, housing, environmental conditions, arts and culture, and recreation. No
single place can excel in all areas; yet the goal of all efforts should be to enhance the quality of life within
the city and the region.
Opportunities
Natural resources: The region should maximize its natural resources by making recreation and
natural beauty part of the regional lifestyle, and by enhancing and restoring ecosystem function
and resilience.
History and heritage: The region should emphasize historic resources to enhance a sense of place
and increase its appeal.
Cultural diversity: The region’s diversity is growing with the number of immigrants and refugees
who are calling the city home.
Urban form: The heritage of the region is manifested in its physical form. The confluence of Lake
Erie with the Niagara and Buffalo Rivers dictated the unique development of the city’s form;
while Ellicott and Olmsted still resonate and represent an opportunity for enhancement.
Tourism: While Niagara Falls is the region’s dominant attraction, there are many other assets that
could be leveraged to broaden the appeal of the region to tourists, such as industrial heritage,
architecture, arts and music, food and beverage, fishing and hunting, recreation, and natural
attractions.
Transportation: The decline in population has reduced traffic, presenting an opportunity to
restructure the system to become more multi-modal and responsive to urban form.
Workforce: The region’s industrial legacy has left a skilled workforce in place, which combined
with higher educational opportunities, provides the capacity for renewed economic growth.
Challenges
Economic diversification: This is well underway, but needs to be accelerated to achieve net
economic growth.
11 Attracting investment: In recent decades, disinvestment has outpaced new investment. Barriers to
private-sector investment must be overcome to increase investment at all levels, including legacy
industrial and commercial contamination.
Image enhancement: The region suffers from both misconceptions and real concerns regarding
quality of life. Positive demonstrations are needed to enhance the image of the city and region.
Physical restructuring: The economic restructuring of the region will require new land use
patterns, new neighborhoods, and new transportation systems, such as reconnecting the city to its
waterfront.
Addressing obsolescence: Without sacrificing its heritage, the region must upgrade its housing,
transportation, and community facilities; and employ best practices and state of the art urban
design for ensuring ecosystem prosperity.
3.2 COMMUNITY AND REGIONAL TRENDS
The purpose of this analysis is to identify potential development alternatives within the context of
socioeconomic, employment, and real estate trends. Overall, the findings indicate that there are a number
of options that could reasonably be considered for future development. However, most of the market and
economic indicators are relatively weak at this time, both within the city and the region. Therefore, the
rate of new development for any selected use should be expected to occur over many years, possibly
decades. Low demand for both residential and non-residential land uses also suggests that subsidies and
incentives will be required to attract developers and investors, at least in the short term.
Demographic Trends
Population and household growth have been constrained by the economic transition from heavy industry
to other types of activities. Population changes over the last two decades reflect an overall net loss at both
the city and county levels. Although the city’s rate of decline has been slowing, projections indicate that
little or no growth is expected over the short-term.
The median age of city residents has remained consistently below that of the county. This is at least
partially due to the college student population in the city. There are also a higher percentage of residents
in the 25 to 34 age group, indicating attractiveness to young households. Where the city share dips is in
the 35 to 54 age group, which encompasses the prime child-raising years. Short-term projections
anticipate increases in the near-retirement (55 to 64) and retirement (65 and older) age groups.
As with population, the city has seen a loss of 23,500 households over the past two decades. Although the
rate of decline is slowing, further losses are projected, with a net decrease of 3,600 households in the city
and 6,300 in the county. There should be a small increase in households aged 25 to 34, but this modest
demand can readily be accommodated within the existing housing supply.
12Median incomes in the city, when adjusted for inflation, remained flat between 2000 and 2010. A similar
scenario occurred for the county, indicating that many households are being challenged in meeting the
rising costs of goods and services. Projections suggest that the stagnant income levels are beginning to
change, with real growth of 13 percent estimated during the first half of the decade. Yet even at these
projected levels, the city’s median income will represent only 67 percent of the countywide figure.
With respect to housing supply, these trends suggest that demand for new construction will remain weak,
although there are market sectors that may provide opportunities for new product. Affordability levels
should rise with projected income growth, particularly among older age groups. The need for affordably
priced workforce housing will continue to be prevalent in the marketplace.
Employment Trends
Between 1990 and 2013, total employment in Erie County declined from 453,200 to 427,700 jobs,
representing a loss of five percent. However, the most recent figure represents a gain of 3,800 jobs from
the historic low of the previous year. Private sector jobs represent about 83 percent of the total, and the
region has experienced private sector job growth every month since April 2010. The largest employment
sectors are health care, retail trade, manufacturing, and accommodations/food services; although other
sectors such as administration, professional/technical services, and finance/insurance also account for a
notable share of total jobs.
The most recent forecasts project a net gain of approximately 3,700 jobs in the region between 2008 and
2018. Private sector growth is expected to create 4,500 jobs, offsetting a loss within the public sector. All
growth sectors combined are expected to add 34,000 jobs. Health care will be the primary employment
driver, along with professional/business services and leisure/hospitality. Educational services are also
projected to continue growing through 2018, although at a reduced rate compared to the previous decade.
Like many regions across the country, the county’s manufacturing sector recorded the greatest loss over
the past decade, with a decline of 23,475 jobs (36 percent). These losses are projected to continue,
although there have been some recent successes to point to, such as the auto industry adding 2,300 jobs in
the last three years, after shedding more than 11,000 jobs between 2008 and 2010.
The lack of population growth and an aging workforce also represent an economic development
challenge, since it will force businesses to be more aggressive in attracting workers. This suggests that
efforts will need to focus on retraining the existing workforce to support shifts into new and emerging
industry sectors as part of on-going economic diversification planning.
13Sector Trends
Employment sectors that offer the best potential for growth include front office/producer services,
information technology, biomedical, industrial machinery and services, food/materials processing and
distribution, back office/outsourcing, and travel and tourism.
Professional and technology establishments are potential users of business parks, particularly if expanded
relationships can be established with area research facilities to help support growth in these sectors. These
firms require both office space and specialized flex-building space for research and development
activities. Firms that design software or manage internet services generally have few employees and are
not location dependent. High-speed internet linkages are necessary, and demand for electrical supply may
also be high for data hubs.
Biomedical includes the manufacturing sector producing pharmaceutical, nutraceutical, and
cosmeceutical products; research and development of physical, engineering, and life sciences; as well as
medical equipment development and manufacturing. New or expanding firms in this cluster will most
likely want to locate near research centers and existing campuses as a first choice.
Industrial machinery has been a mainstay of the region’s manufacturing base, but national trends suggest
that this cluster is not expected to be a source of significant future employment growth. However, the
labor force from this cluster provides an asset for diversifying the sector towards advanced manufacturing
with industries that produce high technology goods or use advanced technologies to produce goods.
Processing and distribution represent several industry sectors that combine to offer a dynamic relationship
between the processing facilities and distribution network. These rank relatively low in terms of regional
employment, but offer future growth potential based on national trends. Sustaining and growing these
clusters will be dependent upon a number of factors, one of which is a strong and integrated distribution
network. Buffalo is in a prime location to become more of a logistics hub due to its access to rail, water,
road, and air transportation systems. Increases in energy costs are fostering a resurgence of freight rail as
a means of moving goods over long distances. The region occupies a strategic position on an international
border, with the potential for developing logistics facilities.
Back office and outsourcing includes telephone answering centers, telemarketing, and credit bureau
operations. These uses could be readily integrated into a professional office park or within renovated
commercial or industrial buildings. These types of jobs do not generally require a high skill level, so
could potentially draw from the large number of service sector employees in the area.
Travel and tourism is the third largest source of employment in the region, totaling about 25,000 jobs in
2010. This cluster is one of the most diverse, encompassing accommodations; cultural, recreational, and
amusement facilities; food service facilities; passenger transportation services; and travel-related retail
sales.
14Market Trends
Industrial
At the end of 2013, the industrial market in Erie and Niagara counties included an inventory of 64.6
million square feet. Manufacturing uses occupied half of this inventory, with warehouses accounting for
another 36 percent and flex space the remaining 14 percent. For 2013, net absorption totalled 2.5 msf.
This resulted in a decline in the overall vacancy rate from 9.2 to 5.7 percent. The current vacancy rate
among industrial buildings is less than half the national rate of 11.7 percent.
Between 2000 and 2010, new industrial construction totaled approximately 3.4 msf, for an average annual
absorption of 280,000 sf. New construction in 2013 totalled 241,000 sf, which represents a rise from the
average of 100,000 sf per year added in recent years.
Only 14 percent of the region’s industrial inventory consists of owner-occupied buildings, indicating that
supply is primarily driven by developers. As a result, new construction will likely require pre-leasing or
financial incentives, since speculative development will be limited due to the slow projected employment
growth over the short-term.
The city submarket, which encompasses all areas south of the Scajaquada and Kensington Expressways,
contains 12.1 msf of industrial space, and had a 2013 vacancy rate of 6.3 percent. Almost 1.5 msf was
absorbed during that past year, leaving a total of 766,000 sf available. In addition, 100,000 sf of new
manufacturing space was constructed during the year, representing over 40 percent of the regional total.
The land supply in Buffalo and the region is presumed to be adequate to support demand for new
industrial construction. However, much of this land is not in premier locations, and will need upgraded
infrastructure as well as financial incentives to compete with more marketable, shovel-ready locations
such as Buffalo Lakeside Commerce Park.
Office
The regional office market has an inventory of approximately 33.4 million square feet, with roughly 39
percent in Class B, 23 percent in Class A, 21 percent in Class C, and 17 percent in flex office. Very little
of the region’s office inventory is owner-occupied, estimated at just over 50 buildings containing 850,000
sf.
Over the past several years the regional office market has been relatively stable from a vacancy
perspective. Construction and absorption of new office space has recently become more sluggish,
indicating that speculative development has slowed due to uncertainty within the economy and
employment losses in sectors that typically drive office demand. The overall regional vacancy rate for all
office classes (A, B, and C) rose from 10.4 percent in 2012 to 13.7 percent in 2013. The vacancy rate
remains below the national level of 15.1 percent.
The city’s office inventory includes approximately 16.9 msf, or just over half of the regional supply. Over
three-quarters of the city’s inventory is located in the Central Business District, with over 13 msf. The
15CBD had a vacancy rate of 11.7 percent in 2013, which is an increase over prior years. Much of this can
be attributed to the loss of tenants at One Seneca Tower, which placed 700,000 sf on the market.
While office completions nationally remain below historic averages, the city continues to post positive
construction activity. New construction at One Canalside, Catholic Health, and Compass East indicate
continued faith in this market.
Retail
The regional retail market had a 2013 inventory totaling approximately 26.2 million square feet. This
includes freestanding stores, malls, and shopping centers. The overall vacancy across all these facilities
was 11.6 percent, which represents the lowest rate in more than 10 years, and is below the national
average of 12.3 percent. Across the region, net absorption over the past year increased in all submarkets,
totalling 423,000 sf.
Throughout the nation, the amount of retail shopping development is at historically low levels.
Construction in the region totalled just 217,000 sf, or less than one percent of the existing inventory. Even
with this small amount of new retail added to the mix, the overall supply declined by 21,500 sf.
Redevelopment and repurposing is a trend that continues to gain traction.
In contrast to industrial and office markets, the city contains less than 10 percent of the regional retail
inventory. Retail in the city underperformed the rest of the region, with a vacancy rate of 16.2 percent. On
the positive side, there was net absorption during 2013 of over 37,000 sf in the city, which brought the
vacancy rate down by almost three points.
Residential
The median value for owner-occupied houses in Erie County rose from $88,200 to $123,400 between
2000 and 2012. Sales prices have risen steadily since 2000, with very little volatility. The average annual
increase has been between 3 and 4 percent, with only a few years where growth exceeded or fell below
this rate.
In the city, single-family home sales over the last four years totaled just over 2,800, representing a
turnover rate of about 1.5 percent of the inventory. The median value of an owner-occupied home in the
city is around $66,700, which is considerably lower than the countywide figure. There have been about 40
annual sales in excess of $300,000, but almost half of all home sales have been in the $50,000 to
$100,000 range.
Duplexes comprise a significant portion of the city’s for-sale market, which is not surprising given that
this type of housing represents 40 percent of the total inventory. Over the four year period, duplex sales
averaged 536 per year, for a turnover rate of about 1.9 percent. Duplexes represent about 28 percent of the
city’s owner-occupied units, offering a more affordable entry into the homeownership market.
16Condominium sales ranged from under $100,000 to over $1.5 million, depending on location, type and
size of unit, and amenities offered. Almost all were located in the CBD, and close to half of the listings
were waterfront properties offered in excess of $300,000. Away from the waterfront, properties were
generally listed under $250,000, although exceptions were found for luxury high-rise units or converted
historic properties.
Rental housing represents about 60 percent of the city’s stock, and units had a median contract rent of
$450 in 2010. The 10 percent vacancy rate is roughly twice that found under normal market conditions,
indicating considerable weakness from a demand perspective. However, a report that examined the
housing market in downtown Buffalo found low vacancy rates for apartments, many of which were fully
occupied. These indicators suggest that demand is strong for better quality, appropriately positioned rental
properties.
The city issued building permits for 1,560 new housing units between 2000 and 2013, with multi-family
dwellings accounting for 875 and single-family 685. Buffao’s building activity represented about 7
percent of the county’s 22,740 permits. The limited amount of new construction indicates both a lack of
demand as well as the inability of developers to build new units at a price that can be supported within the
current market.
Census data indicates that the city experienced a net loss of 12,130 housing units between 2000 and 2010,
a decrease of over 8 percent. The city’s vacancy rate remained stable at just under 16 percent of all
housing units. A more proactive effort will required to reduce the remaining vacant supply since the
market will not be able to absorb the excess supply of 20,000 housing units through normal growth.
Market Opportunities
Industrial
Based on employment projections and targeted sectors for the region, flex/office buildings and other
small-scale professional/general office space appear to offer reasonable development potential. These
types of facilities can be planned and developed in an incremental manner that allows the building supply
to grow as market demand dictates. Vacancy for flex buildings is relatively high at this time, which is
likely to limit speculative development in the short-term.
However, industry growth projections and anticipated support from state and regional agencies to grow
businesses in these clusters suggests that they could provide a viable component of future land use. Flex
buildings are also more easily integrated into mixed-use business parks since they are less obtrusive than
traditional manufacturing facilities.
The availability of rail access is also likely to be a positive attribute for supporting new construction, as
well as the re-use of existing manufacturing/warehouse facilities, if regional economic plans to promote
food/materials processing and multi-modal distribution facilities continue to receive support and
incentives.
17Office
The regional office market is relatively strong but demand for new construction will probably remain
modest over the next few years. Based on recent absorption levels, the CBD has a 10 to 12 year supply of
available space. However, continued renovation of the city’s existing building inventory into higher
quality space may lessen demand for new construction to some degree. Vacancy in the remainder of the
city is less than 500,000 SF, but continued negative absorption would suggest that its predominantly Class
B inventory will need to continue to offer competitive lease rates in order to sustain occupancy levels.
Given these market conditions, the demand for conventional office buildings is expected to be relatively
modest. Competition for office development would come from existing and future development in the
city’s Larkin District which is successfully attracting office and mixed-use projects.
Retail
The demand for any sizeable square footage of additional retail is probably the most questionable of all
the potential nonresidential market uses. The CBD is the city’s strongest retail area and it appears as
though demand there will remain moderate for the time being, with renovated space offering more
potential than new construction. Some retail nodes could potentially be added at strategic locations that
have the best highway access and as such, will not be totally dependent on local households to support
sustainable sales levels. Any new retail facilities offering general merchandise would likely be created at
the expense of existing businesses, since total retail demand is not expected to grow substantially given
the low projected growth in regional population and employment levels.
Residential
The demand for new residential development in the city has been moderate, and low population growth is
not expected to result in any marked changes to this trend over the short-term. Given the anticipated
changes in the regional population over the next half decade – growth mainly concentrated in the near-
retirement and retirement age groups and only modest increases in younger households – housing demand
and development trends are not expected to change significantly.
Given these findings, potential demand for housing is likely to be focused within the following market
niches:
Senior/retirement housing – this could include senior apartment complexes, retirement villages
offering a variety of housing types, and assisted living facilities. Projected increases in income
levels for these age groups suggest that they may be able to afford somewhat higher housing costs
if they choose to downsize into a retirement-oriented dwelling. An estimated 7,000 households
will be entering this market segment in Erie County over the next 10 years.
Rental housing for younger households – the county’s population between 25 and 34 is projected
to increase by about 2,000 households over the next five years. Although this does not represent a
huge potential increase in demand, the city does have a relatively larger percentage of its
18population in younger age groups overall. Housing development targeting this market segment
will most likely occur at the expense of the city’s existing stock, which is presently capturing
these households.
Luxury condominium/rental housing – although not a major component of the city’s housing
market, these types of units have met with success along the waterfront and downtown, although
absorption has been relatively slow overall. Waterfront property is almost always a sought-after
commodity in the housing market, so it is reasonable to conclude that some portion of future land
use could capitalize on this fact, especially if suitable amenities are offered. Absorption is likely
to remain slow, based on historical trends, and therefore, such housing may need to be part of a
mixed use development in order to attract investment from the private sector.
3.3 BOA TRENDS
Demographics
The population of the BOA has been steadily declining, going from 1,250 in 1990 to 930 in 2010. The
rate of annual loss is about half a percent lower than the citywide figure, but much higher than that of Erie
County.
The number of households in the BOA has also declined, from 469 in 1990 to 376 in 2010. The steady
decline in households indicates that any demand generated for new residential real estate will need to be
sourced, at least in part, from outside the BOA
Adjusting for inflation, the BOA’s median household income increased from $30,100 in 1990 to $30,700
in 2010. The median was about $1,000 lower than the citywide figure, and almost $20,000 lower than the
countywide figure.
The distribution of household incomes is relatively similar to the city, although households earning more
than $150,000 annually are practically absent, while the city’s share is about 2 percent. Larger gaps are
found between the BOA and the county, where more than half the households earn more than $50,000
annually, compared to only 30 percent in the BOA. These relatiely low incomes lead to relatively low
purchasing power for real estate.
Residential Market
Compared to the city, the BOA is more heavily oriented towards rentals priced at $500 or less. In fact,
almost 90 percent of the rental units report rents at this level, while the citywide figure is just over 60
percent. Furthermore, almost 40 percent of the BOA’s rental units are priced at less than $250, a share
three times higher than the city.
The BOA is about evenly split between renters and owners, a figure that has changed little since 2000. Its
vacancy rate has continued to rise since 2000, when it was 15 percent, to a 2010 level of 24 percent.
Combined with the low rent rates, this indicates relatively low demand for rental housing.
19There were 10 valid residential sales transactions between 2007 and 2010 in the BOA. Four were for
single-family homes, and the remainder for two- or three-family homes. All properties were at least a
century old, and ranged in size from 1,000 to 2,000 square feet per unit. The average price for a single-
family home was $29,300, with a high of $48,000. The average price for a multi-family home was
$34,700, with a high of $57,500. These are significantly lower than the citywide averages of $106,000 for
single-family and $78,000 for multi-family homes.
Based on an analysis of the city’s assessment and permitting databases, there has been no new residential
development in the BOA since 2000, although there are two residential projects currently in the planning
phase – Buffalo River Lofts, a 78-apartment new build at 441 Ohio Street; and Cooperage Lofts, the
renovation and conversion of the EB Holmes building at 55 Chicago Street into 22 apartments.
Nonresidential Market
There were several active or recent listings of commercial real estate space located in and around the
BOA. The average lease rate was $2.15/SF for industrial space and $12/SF for office space. The industrial
offerings were all priced fairly tightly between $2 and $2.25, but the pricing of office space was
significantly wider, with properties at both $8 and $16. The industrial average is about two-thirds the
citywide rate, while the office average is about a third higher than the citywide rate.
The relatively high discount assigned to industrial rents in the BOA suggests that demand may be
relatively low, although the aged stock may also play a role. On the office side, given the proximity to
downtown from the BOA, it is logical that lease rates would fall as they do somewhere between the CBD
and the city at large.
According to the city’s assessment database, there were six commercial sales within the BOA between
2007 and 2010. Four of these were industrial properties, and ranged in size from 5,340 SF to 13,470 SF.
Sales prices ranged from $21 to $47/SF, with an average of $30/SF. The BOA’s average sale price was
more than twice as high as the citywide average. While the sample size is extremely small, the data
indicates that industrial properties in the BOA may be experiencing higher demand than in other parts of
the city.
Commercial development since 2000 has consisted of four industrial projects and one office project. The
industrial properties range in size from 4,000 to 20,000 SF, with values between $16 and $29/SF. The
office building is about 8,300 SF, with a value of $46/SF. There do not appear to be any commercial
development projects in the pipeline for the BOA.
204
INVENTORY
21The purpose of the inventory and analysis is to provide a better understanding of existing conditions;
clarify the regulatory framework; recognize opportunities and potential barriers to redevelopment; and
identify assets and opportunities that can leverage investments.
4.1 NATURAL RESOURCES
The Buffalo River has served as the location of concentrated industrial development since the mid-1800s.
While its industrial past has dramatically altered the ecological function of the river, it remains the key
natural resource within the BOA. Although active commercial, industrial, and residential uses occupy the
majority of the study area, numerous vacant sites and valuable environmental resources remain.
Geology
Nearly all land in the BOA is underlain by 390-million year-old Onondaga limestone bedrock. This solid,
erosion-resistant formation spans New York State from Buffalo to Albany. The bedrock within a small
area east of Elk Street is comprised of the Marcellus Formation, Oatka Creek Shale member. The depth
to bedrock is generally 30 to 70 feet below grade.
The BOA is comprised entirely of lacustrine silt and clay, which are laminated layers of silt and clay
deposited in glacial lakes historically found throughout New York State. Lacustrine silt and clay contains
slightly impermeable soil, resulting in the potential for land instability on parcels not previously graded or
sufficiently compacted. As most land has already been disturbed, concerns for future development
resulting from the instability of the lacustrine silt and clay are relatively low.
Soils
According to the Soil Survey of Erie County, there are a number of distinct soil types within the BOA.
Since limited site-specific information is available and on-site conditions can vary among properties,
investigations will be needed to confirm site suitability prior to development.
The majority of soil is mapped as commercial (Ud – Urban Land). Most areas within this soil type have
been significantly disturbed through previous residential, commercial, and industrial construction
activities. In most cases, the soil is completely covered with buildings, paved surfaces, demolition fill,
capped remediation areas, or other man-made materials. Areas in the BOA include landfills, former
marshes, and floodplains. Careful onsite investigation is essential to determine the suitability and
limitations for any proposed use.
Large areas are covered with fill (Uc – Udorthents), generally near industry, urban development, or
construction sites. These soils consist of various kinds of excavated earthy material that has been
stockpiled for use as fill for topdressing; soil and rock material that has been trucked from other areas and
leveled; or soil deposits that are left in areas that have been excavated or deeply scalped. In some places
the fill is mixed with slag or cinders, in other places with concrete, asphalt, or other waste. These areas
22are generally near industrial complexes, rail yards, and rights-of-way. Cut and fill areas are usually
poorly suited to farm or recreational uses, and onsite investigation is essential to determine the feasibility
of using these areas for any purpose.
Several small pockets are mapped as Niagara silt loam soils (NfA), mainly around areas of O’Connell
Street, South Park Avenue, Perry Street, and Bailey Avenue. This well-drained soil is composed of dark
brown silt loam, and found in areas not significantly disturbed by urban development. While paved and
previously disturbed portions of this soil series allow for future development; unpaved, undisturbed
portions are generally ill-suited for construction due to the presence of weak, poorly drained soils.
The dump (Dp) soil type consists of excavations that are filled with rubbish and debris. Landfills are
commonly constructed by removing the soil and dumping trash and refuse into an excavated area that can
range from 3 to 50 feet in depth. The refuse is then covered or mixed with earth material. In historically
industrial areas dumps can also contain industrial and toxic wastes. These dump sites can have a pungent
odor, poor stability, and unsanitary effluents that make them undesirable for reuse. Onsite investigation is
necessary to determine its reclamation value for any proposed uses. [Map 2]
Topography
The topography throughout the BOA is fairly level, with the exception of several ridges that traverse its
central portion. The lowest point is along the Buffalo River, at an elevation of 571 feet above mean sea
level. The highest point is located along a scenic ridge in Red Jacket Riverfront Park, at an elevation of
607 feet. Steep slopes are confined to the area around the ridges in Red Jacket Riverfront Park, as well as
along several natural riverbanks. Portions of the Buffalo River shoreline contain concrete or steel
bulkheads, resulting in a significant drop in elevation from the adjacent land. [Map 3]
Surface Water
Buffalo River
The Buffalo River has played an integral part in the city’s history. From its headwaters in the towns of
Sardinia and Concord, the river winds its way for 30 miles before emptying into Lake Erie. Prior to
industrialization of the waterway, the geography of this section of the city was dominated by wetland
marsh, with a river water draft less than five-feet deep. Riparian zones were eliminated and replaced by
hard seawalls for better access by boats, and wetlands were filled in order to be able to build the structures
needed to capitalize on waterfront access. The early factories and mills that located along the river have
contributed to the environmental degradation of this natural resource.
Today the Buffalo River is a navigable waterway. The US Army Corps of Engineers actively maintains a
navigation channel that is dredged to a depth of 23-feet from Lake Erie to a point just west of the river’s
confluence with Cazenovia Creek. The waterway is slow flowing and turbid, with low dissolved oxygen.
Current river conditions include inaccessible and degraded shorelines, a loss of natural wetland buffer and
filtration, and compacted and compromised upland areas that generate storm water and overload the
23Map 2: Soils
24Map 3: Topography
25sewer system. Additionally, the loss of naturalized edges through seawall construction has removed
breeding habitat for fish, and significantly impacted wildlife that depend on riparian zones.
The river is the final collection point in the Buffalo River-Frontal Lake Erie sub-watershed, which
consists of 105,400 acres (165 square miles) of land. This watershed has been impacted by upper
watershed agricultural runoff, faulty septic systems, and sediments affected by historical industrialization.
The river is classified by the NYS Department of Environmental Conservation as a “Class C” water body,
indicating that its best use is for fishing and fish, shellfish, and wildlife propagation and survival. The
water quality is suitable for primary and secondary contact recreation, although other factors may limit
the use for these purposes.
City Ship Canal
The City Ship Canal is located between Kelly Island and the Outer Harbor. It was constructed in 1850 to
provide additional mooring and dock space. The canal was also used by businesses to transport goods
from grain elevators to destination points across the country. It remains active, used by businesses such as
General Mills, First Buffalo Marina, China Light Yacht Club, RCR Yachts Marina, and Port Crescent
Land Company. The canal is classified by the NYSDEC as a “Class C” water body; and is part of the
federally-designated Buffalo River Area of Concern.
Groundwater
An aquifer is an underground layer of water-bearing permeable rock, sand, gravel, or soil that contains
extractable groundwater. According to the NYSDEC, no primary or principal aquifers are located within
the BOA. The USEPA indicates that no sole source aquifers are located within the study area. The
environmental assessment of a number of properties within and outside the BOA has determined that
groundwater has been impacted by past industrial practices and petroleum spills; but there are no known
uses of groundwater within the boundaries.
Wetlands
The City Ship Canal is the only federally-regulated wetland within the BOA; there are no state-regulated
wetlands. Smaller, unmapped wetlands are present throughout, including areas of marshlands and ponds
that provide highly valuable wildlife habitat. These ponded locations include areas along Red Jacket
Riverfront Park behind the Valley Community Center. [Map 4]
Floodplains
According to FEMA mapping, the majority of the BOA is located in Flood Hazard Zone X, the 500-year
flood inundation area where chances of flooding in a given year are minimal. The entire run of the
26Map 4: Wetlands and Flood Hazard Areas
27Buffalo River, as well as the shorelines of parcels fronting it and the City Ship Canal, are located within
flood hazard Zone AE. This means that these parcels are within the 100-year flood inundation area, and
have a 1 percent annual chance of flooding. Parcels in Zone AE include General Mills, Red Jacket
Riverfront Park, Buckeye Terminal, First Buffalo Marina, RCR Yachts Marina, and China Light Yacht
Club. Flooding on many of these parcels has been mitigated by the installation of concrete bulkheads that
extend above mapped flood elevations. [Map 4]
Erosion Hazard Areas
According to the city’s Draft Local Waterfront Revitalization Plan, there are no designated Coastal
Erosion Hazard Areas within the BOA. Many properties along the Buffalo River corridor are protected
from erosion by concrete bulkheads or riprap, but some portions of the stream banks are unprotected and
subject to the possibility of future erosion.
Fish and Wildlife Habitats
Fish and wildlife habitat in the BOA is degraded due to development along the riverbank and routine
navigational dredging. The Buffalo River is listed by the USEPA as a Great Lakes Area of Concern. To
date, three habitat restoration projects have been completed in the AOC, and six more are underway or in
the design phase.
The USEPA recently funded the development of the Buffalo River Ecological Restoration Master Plan,
an actionable restoration plan that was developed through extensive stakeholder involvement. The ERMP
identifies potential habitat restoration sites and activities that will make progress towards delisting the
three habitat-related Beneficial Use Impairments possible. The ERMP identified five restoration sites: the
cap area of City Ship Canal, the Ohio Street shoreline, the Katherine Street peninsula, Red Jacket
Riverfront Park, and the Buffalo Color peninsula shoreline.
The Significant Coastal Fish and Wildlife Habitats program serves to protect important fish and wildlife
habitats that contain a unique combination of environmental and biological conditions that fish and
wildlife need for survival. No designated habitats are located within the BOA, although habitats are
located to the west at the Times Beach Nature Preserve and the Small Boat Harbor.
Fish habitat is also degraded by navigational dredging that has created an over-widened, over-deepened
channel lacking the natural pool/riffle regime. Some 41 native species of fish have been observed in the
Buffalo River, including the longear sunfish and black redhorse, which are listed as “Species in Greatest
Conservation Need.”
The river is also a key location within the North American Flyway for bird migration, and lies along the
direct path of a globally significant Important Bird Area. Habitat areas along the water’s edge are crucial
for many avian species as they pass through on their migration pattern.
The NYSDEC lists 15 endangered species that have historically inhabited the BOA. According to the US
Fish & Wildlife Service’s Inventory of Threatened and Endangered Species, no federally-listed species
28are currently found in Erie County. Non-endangered wildlife typically found along the Buffalo River
includes amphibians, snakes, and mammals.
The City Ship Canal also provides habitat for fish, amphibians, and invertebrates. Although it is an
artificial channel, it has increasing value as a link between Lake Erie and Buffalo River habitats,
especially for waterfowl and fish in need of nesting, spawning, and resting places. Native shoreline and
aquatic vegetation have naturalized the western edge of the canal south of the active industrial area.
Air Quality Maintenance Areas
Air Quality Maintenance Areas are places that “persistently exceed the national ambient air quality
standards” as described in the Federal Clean Air Act. These areas are designated as “non-attainment”
areas. The city is a designated non-attainment area, earning a “subpar” rating in 2011 due to ozone levels
in excess of state and federal limits.
Visual Quality
Most of the parcels along the Buffalo River have been developed for industrial and commercial uses. The
river and several sections of river bank offer natural view sheds; while cultural and historic view sheds
are provided by Elevator Alley – a collection of historic grain elevators lining the river, some of which
remain active today. NYS Route 5 is part of the Great Lakes Seaway Trail, and provides picturesque
views of Lake Erie, the Buffalo River, Elevator Alley, and the city skyline. A topographic ridge located
in Red Jacket Riverfront Park also offers scenic views of the Buffalo River, Tifft Nature Preserve, and the
Concrete Central Elevator.
Upland Natural Resources and Open Space
The BOA is primarily comprised of industrial, commercial, and residential properties; but also offers
areas of important upland open space. Riverfest Park, the Ohio Street boat launch, Father Conway Park,
Mutual Riverfront Park, and Red Jacket Riverfront Park are dedicated public spaces that preserve upland
open space. A number of former industrial parcels, including several on the Katherine Street Peninsula,
have also been left unmaintained over the past few decades and are undergoing the re-establishment of
upland habitat.
Agricultural Lands
No agricultural land presently exists within the BOA.
Local, State and Federally-Designated Resources
No local, state, or federally-designated resources presently exist within the BOA.
29You can also read