Built for Growth Q3 2021 Business & Financial Review - Maple Leaf Foods
←
→
Page content transcription
If your browser does not render page correctly, please read the page content below

Built for Growth
                                                         Q3 2021 Business
All dollar amounts are presented in
                                                         & Financial Review
CAD dollars unless otherwise noted.
Forward-looking Statements and Non-IFRS Measures
    This presentation contains “forward-looking information” within the meaning of applicable securities law. These statements are based on current expectations, estimates, forecasts, and
    projections about the industries in which the Company operates, as well as beliefs and assumptions made by the Management of the Company. The COVID-19 pandemic creates a very fluid
    situation with many uncertainties. Based on its experience to date, the Company has made certain assumptions about the implications of COVID-19 for its business, including:
    •   The shifting demand balance between retail and foodservice channels, product mix, productivity, supply chain disruptions, operating cost pressures and business continuity.
    •   The Company’s expectations with respect to future sales and returns associated with the anticipated growth of its plant protein business are based on a number of assumptions, estimates
        and projections, including but not limited to: the impact of COVID-19, market growth assumptions, market share assumptions, supply chain constraints and effectiveness, new product
        innovation and commercialization, results of brand renovation initiatives, foreign exchange rates, customer and consumer behavior, competition and availability of labour.
    •   The Company’s expectations with respect to the growth of its meat protein business, such as anticipated growth in sales, adjusted EBITDA margin and gross margin, are based on a number
        of assumptions, estimates and projections, including but not limited to: the impact of COVID-19, supply chain constraints and effectiveness, commodity prices, hog and pork processor
        margins, demand for pork and access to export markets, poultry markets and supply management, foreign exchange rates, growth in demand for sustainable meats and branded products, ,
        customer and consumer behaviour, competition and availability of labour.
    •   The Company's assumptions about capital project expenditures and timing are based on a number of assumptions, including but not limited to: the impact of COVID-19, availability and cost
        of materials and labour, contractor performance and productivity levels, supply chain constraints and effectiveness, quality of estimating, weather conditions and project scope.
    •   These statements are not guarantees of future performance and involve assumptions, risks and uncertainties that are difficult to predict. These assumptions have been derived from
        information currently available to the Company, including information obtained by the Company from third-party sources. These assumptions may prove to be incorrect in whole or in part.
        In addition, actual results may differ materially from those expressed, implied, or forecasted in such forward-looking information, which reflect the Company’s expectations only as of the
        date hereof. Please refer to the sections entitled “Risk Factors” and “Forward-Looking Statements” in the Company's Management Discussion and Analysis for the quarter ended September
        30, 2021 and year ended December 31, 2020 for additional detail.
    In addition, this presentation contains the following non-IFRS measures:
    Adjusted Operating Earnings: Earnings before income taxes and interest expenses adjusted for items that are not considered representative of ongoing operational activities of the business,
    and items where the economic impact of the transactions will be reflected in earnings in future periods when the underlying asset is sold or transferred.
    Adjusted Earnings per Share: Defined as basic earnings per share adjusted for all items that are not considered representative of ongoing operational activities of the business, and items
    where the economic impact of the transactions will be reflected in earnings in future periods when the underlying asset is sold or transferred.
    Adjusted Earnings Before Interest, Taxes, Depreciation and Amortization: Defined as Adjusted Operating Earnings plus depreciation and intangible asset amortization, adjusted for items
    included in other expense that are not considered representative of ongoing operational activities. Adjusted EBITDA Margin is calculated as Adjusted EBITDA divided by sales.
    Net (Debt) Cash: Defined as cash and cash equivalents, less long-term debt and bank indebtedness.
    Construction Capital: Defined as investments and related financing charges in projects over $50.0 million that are related to longer-term strategic initiatives, with no returns expected for at
    least 12 months in the future and the asset will be re-categorized from Construction Capital once operational.

    Please refer to the Company’s Management and Discussion and Analysis for the quarter ended September 30, 2021 (as filed on SEDAR) for additional information on non-IFRS financial measures.

2                                                                                                                            MAPLE LEAF FOODS – Q3 2021 BUSINESS AND FINANCIAL REVIEW | NOVEMBER 4, 2021
Maple Leaf at a
    Glance

3
En route to Becoming the Most Sustainable Protein Company on Earth

       13,500 employees
                                                        Total Sales (2020)           $4,304 million
                                                        Meat Protein Group                      Plant Protein Group
       32 manufacturing facilities*                                          2020 Adj.                                   2020
       prepared meats, fresh pork,
       fresh poultry and plant protein
                                                        12.4%                EBITDA
                                                                              Margin            19.5%                    Sales
                                                                                                                        Growth

       4M hogs processed annually                        Iconic
       (40% are raised in ~200                         National &
       company-operated barns with                      Regional
       leading animal care practices)                    Brand
                                                        Portfolio
       Largest producer of RWA
       pork in North America and
       poultry in Canada

       Leading presence in North
       American plant-based protein

    *Includes 5 feed mills and 3 chicken hatcheries.
4   Notes: RWA: raised without antibiotics.             MAPLE LEAF FOODS – Q3 2021 BUSINESS AND FINANCIAL REVIEW | NOVEMBER 4, 2021
The Maple Leaf Foods Blueprint

5                                    MAPLE LEAF FOODS – Q3 2021 BUSINESS AND FINANCIAL REVIEW | NOVEMBER 4, 2021

We Built a Profitable Base; Now We’re Focused on Profitable Growth
2010 Transformation 2014 2015 Brand-led Growth Today
Exited non-core businesses Expanding sustainable meats platform
Rothsay (2013)
Olivieri (2013)
Canada Bread (2014)
Renovated core brands
Transformed our supply chain
Established scale prepared meats network,
consolidating fragmented supply chain
Delivered significant efficiency and margin
improvements Establishing leadership in plant protein
Invested in technology
Deployed SAP
6 MAPLE LEAF FOODS – Q3 2021 BUSINESS AND FINANCIAL REVIEW | NOVEMBER 4, 2021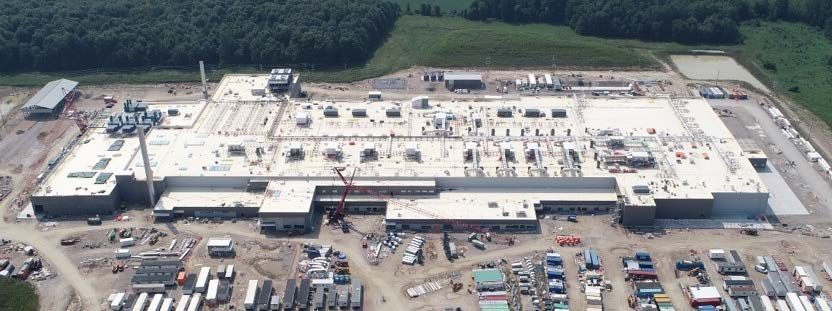
Built for Growth: 20% of Portfolio now Growing at 3-yr CAGR* >25%

    Percentage of Total Company Sales in Sustainable Meats and Plant-based Protein

                               ~10%                                                                                         ~20%

                                                                                                                   2020
                                                                             High growth
                   2017
                       $3.5B                                                 Steady growth                         $4.3B

                               Deliberate repositioning of portfolio towards two high-growth categories,
                             now generating a compounded growth rate in excess of 25% in the last 3 years

         *CAGR = Compound annual growth rate; Calculated between 2017 and 2020.
7                                                                                                                    MAPLE LEAF FOODS – Q3 2021 BUSINESS AND FINANCIAL REVIEW | NOVEMBER 4, 2021
         Note: Sustainable meats includes RWA and organic sales in prepared meats, fresh poultry and fresh pork.
Our Blueprint is consistently delivering top and bottom-line growth

     Maple Leaf Total Annual Sales                                                                                 Meat Protein Adjusted EBITDA
    ($ millions)                                                                                                   ($ millions and margin %)

                                                                                             2                                                     3                                          2

    • Driven by growth strategies in Brand Renovation,                                                             • Benefits of profitable growth strategies and operational
      Sustainable Meats and Geographic Expansion to USA                                                              efficiencies have resulted in EBITDA expanding by
                                                                                                                     ~$320 million and margin by 570bps in less than 6 years

         1Compound    annual growth rate calculated between 2016 and 2021 TTM2, including impact of acquisitions
8        2Trailing                                                                                                          MAPLE LEAF FOODS – Q3 2021 BUSINESS AND FINANCIAL REVIEW | NOVEMBER 4, 2021
                  Twelve Months
         32017 figures are pro-forma without segment allocations
We are uniquely positioned to succeed in a world that has changed
following the COVID-19 Pandemic
• Our economy, and business, is
Maple Leaf has the necessary skills to thrive in
experiencing burgeoning inflation
• CPI rate1 2x to 4.4%; Pork1 59% this environment
• The global supply chain is being
disrupted Fully renovated, market leading, brands
• Labour shortages resulting in unfilled U.S. are stronger than ever
job postings2 55%
Consumer based revenue management
• Shipping costs3 6.5x
function to optimize responses to inflation
• Meat Protein markets and demand is
robust
Experience in supply chain excellence &
operational efficiency
• Sustainability imperatives have
accelerated
Our vision to become the most sustainable protein company on earth
is more relevant than ever before!
1Source: Bloomberg: price changes from Dec-19 to Sep-21 for Canadian CPI, USDA Pork
9 MAPLE LEAF FOODS – Q3 2021 BUSINESS AND FINANCIAL REVIEW | NOVEMBER 4, 2021
2Source: Bloomberg: price changes from Dec-19 to Sep-21 for Total US Job Openings Index
3Source: Freightos Data, price change from Dec-19 to Sep-21 for Freightos Baltic Index Global Container Freight Index
Q3 2021
     Results

10
Key Highlights from Q3 2021
• Strong Q3 results highlight the resiliency of our business
Exceptional Meat Protein results in a challenging operating environment
Delivered another quarter of growth in sustainable meats, branded sales, and growth in the U.S.
• Meat Protein generates outstanding growth in sales, in Adj EBITDA, and in margin
Exceptional sales growth of +13.4% and +22% increase in Adj. EBITDA to $149.3 million
Delivered 90bps of margin expansion to 13.0%, on track to the 14-16% target in 2022
Started commissioning of $182 million Bacon Centre of Excellence to meet growing customer demand
• Our performance, and the category performance, has deflated in Plant Protein
Despite leading share and distribution, disappointing results reflective of category declines
Given current category performance, we are re-examining the investment thesis. Based on this review we will
affirm or adjust our strategies and investment thesis going forward
Our focus on creating long-term value for all stakeholders is unchanged
• Meat Protein outlook unchanged; No sales outlook for Plant Protein
Meat Protein: Mid-to-high single digit sales growth1, coupled with Adj. EBITDA margin expansion
Plant Protein: Driven largely by lower-than-expected category growth, we do not expect to meet our sales
growth target for H2 2021. SG&A investment is expected to be broadly in-line with 2020 levels
11 1On a 52-week comparable basis. MAPLE LEAF FOODS – Q3 2021 BUSINESS AND FINANCIAL REVIEW | NOVEMBER 4, 2021Meat Protein Group – Q3 2021 Strategic & Operational Highlights
Drive Profitable Growth by… Q3 2021 Highlights
• Brand renovation driving 10th consecutive quarter
Investing in our brands of branded sales growth YoY
to build demand & equity • Sustainable meat sales growing at double-digits,
and represents over 15% of meat sales
Leveraging our leadership • Expanded sales in the U.S. by more than 50%,
in sustainable meats spearheaded by our Greenfield Natural Meat Co.
brand
• Demonstrated operational excellence and
Broadening reach into new resiliency amid COVID-19 and global supply chain
geographies & channels
disruptions
• Completed construction of the $182 million Bacon
Centre of Excellence to meet growing demand and
increase efficiency
Delivering operational
excellence • Adj EBITDA margin on track to achieve 14-16%
target in 2022
12 MAPLE LEAF FOODS – Q3 2021 BUSINESS AND FINANCIAL REVIEW | NOVEMBER 4, 2021Meat Protein delivered outstanding Q3 2021 financial results
Q3 2021 vs. LY Drivers
• Pricing action implemented in Q3 2021, higher fresh pork & poultry
volumes, and favourable mix-shift to branded & sustainable meats
Sales $1,150.3 +13.4%
• More than offset lower prepared meats volumes from lapping surge
demand from COVID-19 a year ago, lower sales to China, and FX
Gross Profit $191.5 +19.2% • Strong commercial performance including a favourable product
and channel mix to sustainable meats and branded products, as
Gross Margin 16.6% +81 bps well as effective commodity hedges
SG&A Expenses $85.9 +6.5%
• Timing of advertising and promotional expenses
SG&A (as a % of sales) 7.5% 49 bps • Normalization of discretionary spending related to COVID-19
improvement
Adj. Operating Earnings $105.6 +32.0%
Adj. EBITDA $149.3 +21.8%
Adj. EBITDA Margin 13.0% +89 bps
Exceptional results led by double-digit sales growth and 22% increase in Adj EBITDA
13 Note: All figures in millions, unless noted otherwise MAPLE LEAF FOODS – Q3 2021 BUSINESS AND FINANCIAL REVIEW | NOVEMBER 4, 2021Tailwinds in the Pork Complex Offset by Weaker Poultry Markets
Hog Production Margins Pork Processor Margins Pork By-Product Markets
Hog production margins = live hog cost (CME) less Hog Raising Index Pork processor margins = pork cutout less live hog cost (CME) Notes: Figures shown represent USDA by-product drop value.
Source: Informa; CME Group. Source: USDA; CME Group. Source: USDA.
• Hog prices elevated relative to feed costs, • High hog prices squeezed packer margins, which • Pork by-product markets remained strong in
resulting in hog production margins above the 5yr remained below seasonal averages for most of the quarter
average Q3
Market data implies a pork complex tailwind …however, this was nearly fully neutralized
of 190bps, primarily due to elevated live hog by weaker poultry markets which materially
prices trailed the 5yr avg
14 Note: 5-yr average represents smoothed trendline of 2017-2021 data for each metric. MAPLE LEAF FOODS – Q3 2021 BUSINESS AND FINANCIAL REVIEW | NOVEMBER 4, 2021Plant Protein Group – Q3 2021 Strategic & Operational Highlights
Invest for Growth by… Q3 2021 Highlights
• Excellent progress advancing the Greenleaf strategic agenda
Entrenching prominent • Added over 10,000 TDP’s in Retail & announced new Foodservice partnerships
market share position • Rolled out exciting innovations in both Lightlife® and Field Roast™
• Launched “Simple Ingredients for a Full Life” national advertising campaign to
support the recent Lightlife brand renovation
Fostering & growing a
powerful portfolio of brands
• Sequential improvement in growth rates vs prior quarter (and in Q3)
• Lightlife Tempeh & Field Roast Chao Cheese shipments grew at double-digits
• Field Roast™ POS growth continued to outpace market sub-segment2
Relentlessly pursuing
innovation
• Greenleaf continues to hold #2 share position in U.S. refrigerated retail market
with leading distribution1
• Notwithstanding this progress, our performance and the category
Leveraging the full suite of
Maple Leaf capabilities
performance is clearly trailing our expectations
• Industry continues to lap height of COVID demand surge; growth softening in Q3
• Refrigerated category down -3% vs. Q3 2020, lapping prior year growth of +64%1
Driving efficiencies,
scale & stability
• As a result, stepping back to re-examine our investment thesis
• Which will either affirm or adjust our strategies and investments going forward
1IRI/SPINS (US MULO + US Natural); refrigerated market only; prior 4 periods ended 10/03/2021.
15 2IRI/SPINS
MAPLE LEAF FOODS – Q3 2021 BUSINESS AND FINANCIAL REVIEW | NOVEMBER 4, 2021
(US MULO + US Natural); refrigerated, frozen and plant based cheese market only; 12 weeks ended 10/03/2021.We advanced our Greenleaf strategic agenda in the quarter
Market-leading innovation gaining traction Growing foodservice with exciting partnerships
First-of-a-kind un-breaded, whole-muscle plant- Launched Lightlife Chicken 2.0 at all 575 KFC
based chicken launched at Whole Foods Market in Canada locations in July
October
Field Roast Pepperoni successfully released
Continued rollout of Field Roast Chao Cheese Shreds with Little Caesars nationwide at 522 outlets
with growing distribution
Lightlife partnered with Pizza Pizza to add
Field Roast Stadium Dogs launched in Q2, available Chick’n Sandwiches and Chick’n Bites at over
at retail, FS, and at MLB stadiums 400 locations in August
Deepening relationships with key partners at
Debuted a breakthrough national
MAPLE LEAF FOODS adAND
– Q3 2021 BUSINESS campaign
FINANCIAL REVIEW |
retail
+2,500 TDPs1 at Kroger with Field Roast Smokey “Simple Ingredients for a Full Life”
Bacon Tempeh and Chao Creamy Shreds campaign launched in support the Q2
brand renovation
+7,000 TDPs1 at Walmart for Lightlife breakfast
links and patties, and frozen Lightlife burger and Highlights Lightlife’s clean and simple
tempeh approach to producing delicious food
Exclusive plant-based chicken supplier for all Airing across North America on TV,
500+ Whole Foods Market prepared foods online video, and social media
stores in North America
16 1Total Distribution Points MAPLE LEAF FOODS – Q3 2021 BUSINESS AND FINANCIAL REVIEW | NOVEMBER 4, 2021Our investments have created a strong foundation in the category
Two excellent brands in Lightlife and Field
Roast
Market leading distribution with the most
diverse product portfolio in the market today
Differentiated growth vectors in Lightlife
Tempeh and Field Roast Chao cheese
Top-flight talent
Market leading depth of innovation pipeline
The #2 market share position in U.S.
refrigerated retail market1
We have built underlying long-term value in Greenleaf
17 1IRI/SPINS (US MULO + US Natural); refrigerated market only; ended 10/03/2021 MAPLE LEAF FOODS – Q3 2021 BUSINESS AND FINANCIAL REVIEW | NOVEMBER 4, 2021At the same time, COVID-19 has not been kind to overall category YoY
performance
Growth rates in the refrigerated plant …resulting in disappointing performance
protein category have slowed… for Greenleaf as well
2019 2020 2021 2019 2020 2021
We are investigating the drivers of the slowdown and retesting our investment thesis
18 1IRI/SPINS (US MULO + US Natural); refrigerated market only; ended 10/03/2021 MAPLE LEAF FOODS – Q3 2021 BUSINESS AND FINANCIAL REVIEW | NOVEMBER 4, 2021This category slowdown warrants taking the time to assess and
potentially revise our investment strategy
• Maple Leaf’s investment in Plant Protein anticipated
sustained high growth within the category
• In 2021, the overall category has witnessed declining trends
impacting our own products’ performance
Growth in the refrigerated Plant Protein category has declined since
its Q3 2020 peak
To the point of contraction over the past four months (-3%1 in Q3
2021)
• We are investigating the drivers of this category
underperformance
In order to confirm or adjust our investment thesis
19 1IRI/SPINS (US MULO + US Natural); refrigerated market only; past 4 periods ended 10/03/2021 MAPLE LEAF FOODS – Q3 2021 BUSINESS AND FINANCIAL REVIEW | NOVEMBER 4, 2021Plant Protein – Q3 2021 financial results disappointed
Q3 2021 vs. LY Drivers
• Lower volumes in both fresh and core retail products
Sales $48.0 (1.2%) offsetting growth in food service volumes and pricing
(ex-FX, in USD)
actions implemented in Q3 2020
Gross Profit ($3.3) (196.2%) • Lower sales volumes and capacity utilization
• Q3 2020 impacted by significant costs related to COVID-19
Gross Margin (6.8%) (1340 bps)
SG&A Expenses $34.4 (26.0%)
1881 bps • Timing of certain advertising and promotional expenses
SG&A (as a % of sales) 71.7%
improvement
Adj. Operating Earnings ($37.7) +12.6%
Adj. EBITDA ($33.9) +14.2%
20 Note: All figures in CAD millions, unless noted otherwise MAPLE LEAF FOODS – Q3 2021 BUSINESS AND FINANCIAL REVIEW | NOVEMBER 4, 2021Total Company – Q3 2021 financials demonstrate continued growth
Q3 2021 vs. LY Drivers
Sales $1,188.6 +12.4% • Solid growth in Meat, partially offset by lower sales in Plant
Adj. Operating Earnings $68.0 +84.3%
Adj. EBITDA $115.4 +39.7%
Adj. EBITDA Margin 9.7% +189 bps
Net earnings $44.5 (32.6%)
Adj. EPS $0.36 +111.8%
Net Debt1 $1,089.5 +$554.6
Debt related to Construction Capital $821.1 +$524.1 • Increase in construction capital primarily related to the
London poultry facility and expansion of the Bacon Centre
Capital Expenditure (YTD) $504.4 +$200.2 of Excellence in Winnipeg
Construction Capital CapEx (YTD) $403.5 +$207.3
Strong consolidated earnings results with a conservative balance sheet
1Excludes $188.1 million in lease obligations.
21 MAPLE LEAF FOODS – Q3 2021 BUSINESS AND FINANCIAL REVIEW | NOVEMBER 4, 2021
Notes: All figures in millions, except per share amounts.Summary of Key Construction Capital Projects – Meat Protein
Bacon Centre of Excellence London Poultry Facility
Strategic Rationale Strategic Rationale
• Capture growing demand for pre-cooked bacon, improve • Increases processing capacity for value-added, higher margin
operating efficiency, and drive innovation poultry products
• 73,000 sq. ft. expansion to existing facility; includes space for • Gains operating efficiencies through lower costs and
future growth consolidation of three sub-scale plants
Update Update
• Total investment of $182 million, construction completed Oct 2021 • Focus is on equipment installation while completing internal
• Performing testing and ramp-up; will be producing saleable walls, ceilings and floors
product by end of 2021 • Revised total spend of $772 million due inflationary pressures and
productivity challenges attributable to COVID-19. Continuing to
target completion of construction by second half of 2022
22 MAPLE LEAF FOODS – Q3 2021 BUSINESS AND FINANCIAL REVIEW | NOVEMBER 4, 2021Summary of Key Construction Capital Projects – Plant Protein
Indianapolis Tempeh Facility
Strategic Rationale
• Cost effective and scalable approach to meet burgeoning consumer demand for
high-growth, high-margin tempeh products
• Additional space for future growth opportunities
Update
• Existing 118,000 sq. ft. food facility
• US$100 million for acquisition & build-out of initial capacity (4.5M kg/yr of tempeh
production beginning in H1/2022)
23 MAPLE LEAF FOODS – Q3 2021 BUSINESS AND FINANCIAL REVIEW | NOVEMBER 4, 20212021 &
Long-Term
Outlook
242021 Financial Outlook
Mid-to-high single digit sales growth on a 52-week comparable basis, driven by continued momentum in
Meat sustainable meats, leveraging brand renovation, and growth into the U.S. market.
Protein Adj. EBITDA margin expansion, progressing towards the 2022 target of 14-16%, driven by mix-shift benefits in
Group prepared meats resulting from growth in sustainable meats and brand renovation, as well as operating efficiencies,
assuming pork complex conditions in-line with the 5-year average.
Gross margin volatility in the near-term, as benefits from structural improvements in the supply chain may be
impacted by investment opportunities to drive sales growth in a rapidly evolving market, as well as COVID-19
effects.
Plant SG&A expenses (excluding FX) are expected to be broadly in line with 2020 spending levels, excluding any
Protein impact from fluctuations in foreign exchange, while declining as a percentage of sales as the Company leverages
investments in advertising, promotion and marketing to elevate the Lightlife® and Field Roast™ brand renovations,
Group drive innovation and build scale in the business.
Driven largely by lower-than-expected category growth, we do not expect to meet our sales growth target for the
second half of 2021 and will not likely have a further view on near term sales growth targets until we have completed
the category reassessment.
Capital Capital expenditures towards the high end of the range of $550 million to $650 million, with Construction
Capital comprising approximately 75% of the spend. A significant portion of the Construction Capital is related to
the London, Ontario poultry facility, the acquisition and build-out of the plant protein facility in Indianapolis, Indiana
and other projects to add capacity and improve efficiency in our prepared meats business.
25
MAPLE LEAF FOODS – Q3 2021 BUSINESS AND FINANCIAL REVIEW | NOVEMBER 4, 2021Our Long-Term Outlook
2022 Adjusted EBITDA margin target of 14-16%, driven by:
Meat
Protein • Growth in sustainable meats • Mix-shift benefits from our brand
and food renovation work
Group • Cost and operational efficiencies
2029 ambitious goals for high-growth business:
Plant
• Reach $3B in sales, in a $25B market • Grow into low double-digit SG&A rate
Protein • Deliver approx. 30% gross margin • Adj. EBITDA margin above Meat Protein
Group Recent category dynamics have prompted a re-assessment of the category outlook, and an
evaluation of the investment thesis and strategy
Stakeholder Creating impactful points of difference in the market & society:
• Leverage carbon neutral position, while making • Advancing social impact through the Maple
Value progress towards our Science-Based Targets Leaf Centre for Action on Food Security
Creation • World-leading animal welfare standards • Strengthening sustainable meats leadership
26 MAPLE LEAF FOODS – Q3 2021 BUSINESS AND FINANCIAL REVIEW | NOVEMBER 4, 2021Appendix 27
Reconciliation of Non-IFRS Metrics – Adjusted EBITDA Margin

                                                                                Three months ended September 30, 2021                               Three months ended September 30, 2020
                                                                                  Meat                Plant                                           Meat            Plant
     ($millions)(1)                                                             Protein             Protein              Non-                       Protein         Protein           Non-
     (Unaudited)                                                                 Group               Group         allocated(2)       Total          Group           Group      allocated(2)           Total
     Earnings (loss) before income taxes                                          $105.3               (37.9)                (5.2)    $62.3           $79.8          (43.2)             53.7           $90.4
     Interest expense and other financing costs                                         —                   —                 5.7       5.7              —                —              7.5             7.5
     Other expense (income)                                                          (0.6)                 0.2               (0.6)    (1.0)            (1.6)             0.0             2.9             1.4
     Restructuring and other related costs                                             0.8                  —                  —        0.8             1.7               —               —              1.7
     Earnings (loss) from operations                                              $105.6               (37.7)                (0.1)    $67.9           $80.0          (43.1)             64.1         $100.9
     Decrease (increase) in FV of biological assets                                     —                   —                (6.6)    (6.6)              —                —           (40.2)          (40.2)
     Unrealized loss (gain) on derivative contracts                                     —                   —                 6.7       6.7              —                —           (23.9)          (23.9)
     Adjusted Operating Earnings                                                  $105.6               (37.7)                  —      $68.0           $80.0          (43.1)               —            $36.9
     Depreciation and amortization                                                   43.1                  3.9                 —       47.0            44.1              3.6              —             47.7
     Items included in other income (expense)
                                                                                       0.6               (0.2)                 —        0.4            (1.5)             0.0           (0.5)           (2.0)
     representative of ongoing operations(3)
     Adjusted EBITDA                                                              $149.3               (33.9)                  —     $115.4         $122.6           (39.6)            (0.5)           $82.6
     Adjusted EBITDA margin                                                       13.0%             (70.8)%                   n/a     9.7%           12.1%         (77.0)%              N/A            7.8%

            1 Totalsmay not add due to rounding.
            2 Non-Allocated  includes eliminations of inter-segment sales and associated costs of goods sold, and non-
            allocated costs which are comprised of expenses not separately identifiable to reportable segments and are
            not part of the measures used by the Company when assessing a segment’s operating results.
            3 Primarily includes a legal settlement, gains/losses on the sale of long-term assets, and other miscellaneous

28          expenses.                                                                                                                 MAPLE LEAF FOODS – Q3 2021 BUSINESS AND FINANCIAL REVIEW | NOVEMBER 4, 2021
Reconciliation of Non-IFRS Metrics – Adjusted Earnings per Share
Three months ended September 30,
($ per share)
(Unaudited) 2021 2020
Basic earnings per share $0.36 0.54
Restructuring and other related costs(1) 0.01 0.01
Items included in other expense (income) not
— —
considered representative of ongoing operations(2)
Change in the fair value of biological assets (0.04) (0.24)
Unrealized loss (gain) on derivative contracts 0.04 (0.14)
Adjusted Earnings per Share(3) $0.36 $0.17
1 Includes per share impact of restructuring and other related costs, net of tax.
2 Primarily includes legal fees and provisions and transaction related costs, net of tax.
3 Totals may not add due to rounding.
29 MAPLE LEAF FOODS – Q3 2021 BUSINESS AND FINANCIAL REVIEW | NOVEMBER 4, 2021Capital Allocation Priorities
Grow capacity and efficiency initiatives
1 Reinvest in the Business with a focus on returns metrics & timing
Capitalize on inorganic opportunities
2 Accretive Acquisitions with financial and strategic appeal
3 Dividend Appreciation Deliver consistent predictable growth
Opportunistic buybacks when return
4 Share Repurchases metrics exceed other alternatives
While maintaining a strong balance sheet with ample liquidity
30 MAPLE LEAF FOODS – Q3 2021 BUSINESS AND FINANCIAL REVIEW | NOVEMBER 4, 2021You can also read