Calgary Zoo Flood Mitigation - Groundwater Management and Dewatering on an Island
←
→
Page content transcription
If your browser does not render page correctly, please read the page content below
Calgary Zoo Flood Mitigation
 Groundwater Management and Dewatering on an Island
Introduction
Calgary Zoo and the 2013 Flood
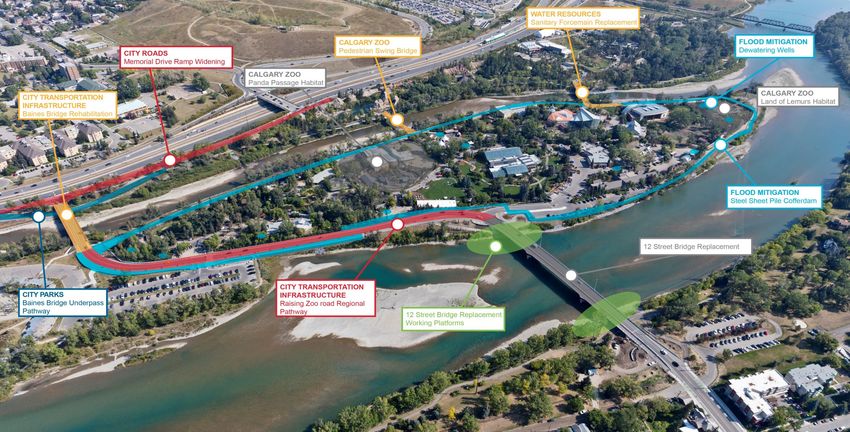
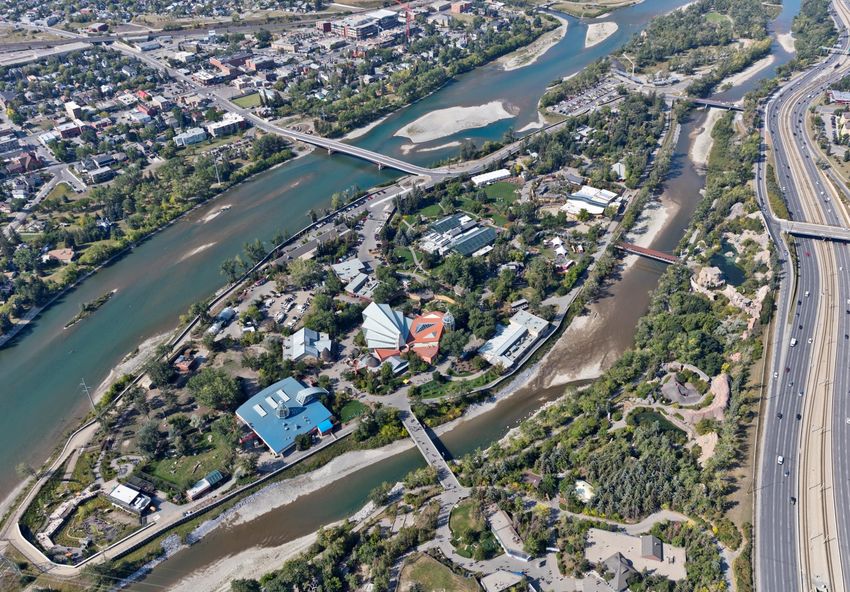
The Calgary Zoo: a top tourist
attraction and a global force for
animal care and conservation
• The Calgary Zoo was established in 1929 and is
  home to nearly 1,000 animals across 119 species
• 60% of the Zoo’s infrastructure is located on St.
  George’s Island in the Bow River, just east of the
  confluence of the Elbow River and downtown
  Calgary
• The Zoo opened the Land of Lemurs exhibit in
  2017 and the highly anticipated Giant Panda
  exhibit in May 2018
• It welcomes 1.3 million visitors annually, with a
  record-breaking 1.48 million people visiting in 2018
Southern Alberta 2013 Floods
• On June 20-21, 2013, the Bow River experienced
  peak flows equivalent to a 1:100 year event
• Zoo staff worked tirelessly to evacuate and care for
  the animals with no power and less than 10 hours
  notice

Photo sources: National Post, Calgary Herald
Recovery and Clean-up
• After floodwaters receded days later, damages
  were assessed and estimated to be $50M
• In the months to follow, questions arose about the
  future viability of the Zoo’s home
• The City of Calgary retained ISL to study options
  on how to protect the Zoo from future flood events
• Associated Engineering was engaged as a key
  partner throughout the Project

Photo source: National Post
Design
Eliminating the Ark Option
        Late 2013 – April 2016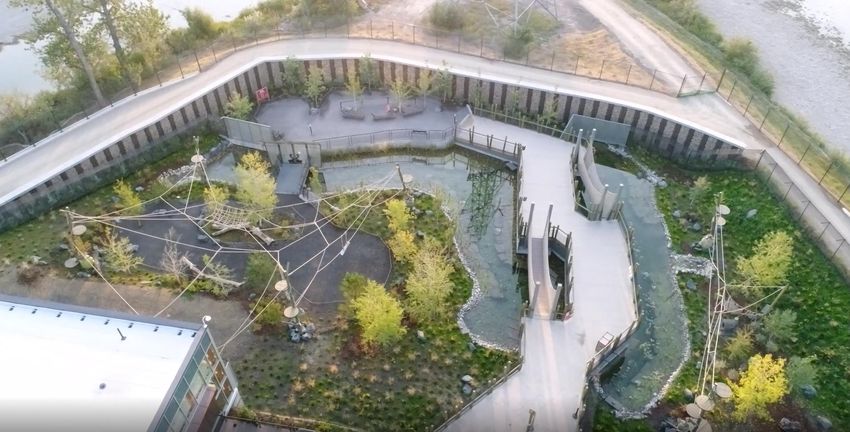
Goals
• Protect the Zoo from a future 1:100 year flood event
• The flood mitigation structure needs to be reliable and
  cost effective
• The alignment of the structure should not encroach on
  the floodway and riparian area wherever possible
• Mature trees and the Zoo’s overall aesthetic must be
  preserved as much as possible
• Avoid impacts to existing infrastructure
• Ensure there are no operational interruptions at the
  Zoo
• Minimize disturbance to animals, the visiting public
  and surrounding residents due to construction noise
• Coordinate amongst up to 12 other ongoing projects
  across the island
• The flood mitigation works had to be complete in time
  for the opening of the Panda Passage exhibit in May
  2018

Photo source: Calgary Zoo
Option Evaluation
• Options were evaluated ranging from ‘do nothing’
  to moving the entire Zoo to a new location
• Economic analyses completed by the City of
  Calgary showed that preservation and protection of
  the Zoo in the existing location had clear long-term
  benefits
• High ground and berms already existed in places
  on the island, so initial flood mitigation concepts
  focused on overland flooding
• However, there was a clear connection between
  river levels and groundwater in the underlying
  sands and gravel - groundwater levels would rise
  within the island during a flood and inundate the
  Zoo
• Groundwater cutoff and management would also
  be needed alongside overland protection
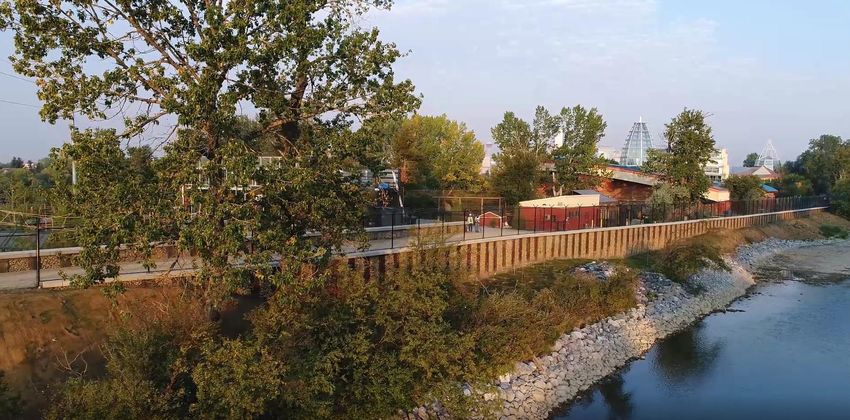
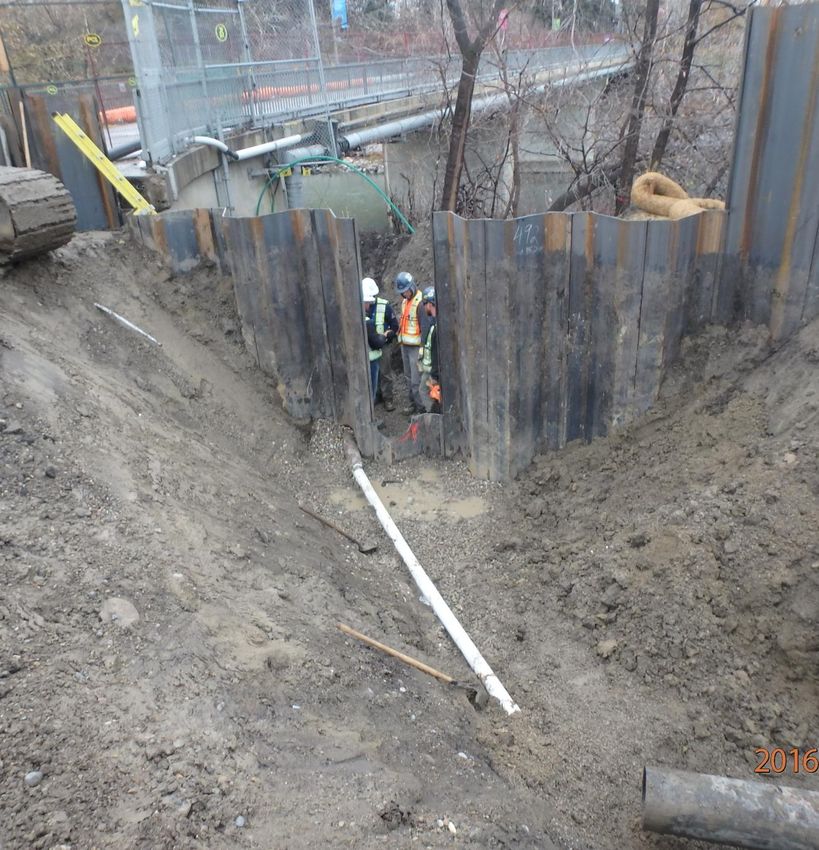
Sealing off the Island
• The most feasible and economically viable solution
  to defend against overland and groundwater
  flooding was to use heavy steel sheet piles,
  essentially creating a cofferdam along the 2 km
  perimeter of the island
• This method was capable of being installed within
  the tight constraints of the island, in the highly
  permeable fluvial cobbles and boulders with a
  relatively watertight seal
• Sheet piles were to be driven 1.0 m into bedrock
  and were cut off 0.5 m above the 1:100 year flood
  level
• Recognizing that the barrier would not be
  completely watertight, further work was undertaken
  to quantify the dewatering system needed to
  control groundwater and stormwater levels in a
  flood event
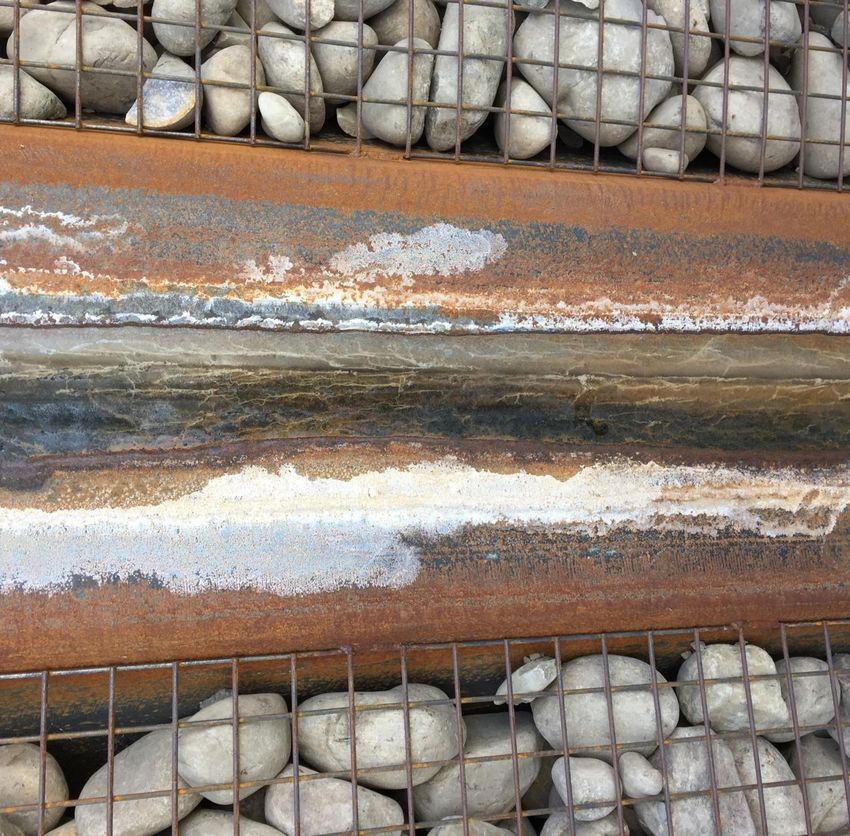
Groundwater Conceptual Model
• St. George’s Island consists of a thin clay/silt layer
  overlying sand, gravel, cobble and boulder
  deposits
• Paskapoo Formation bedrock consisting of
  fractured sandstone, shale and mudstone
  underlies the fluvial sediments
• The top of bedrock was interpreted to be higher at
  the downstream (eastern) end of the island
• Groundwater flow across the island follows the
  river from west to east
• The information available at the time suggested
  that the Bow River was the main source of the
  groundwater underlying the island
Dewatering Considerations
• Leakage through the sheet pile wall was expected
due to:
• Separation of the piles during construction
• Piles not reaching bedrock
• Leakage around utilities passing through the piles
• Fractures within the underlying bedrock
• When dewatering, differences in hydraulic head
between the river and internal, lowered groundwater
• Recognizing that quantifying actual leakage rates
was not possible until pumping tests were
conducted after construction of the sheet pile wall,
the dewatering scheme needed to be readily
adaptable
• Stormwater management was also considered as
part of the scheme, as rainfall would need to be
removed from within the island as well
• Two different operational philosophies were
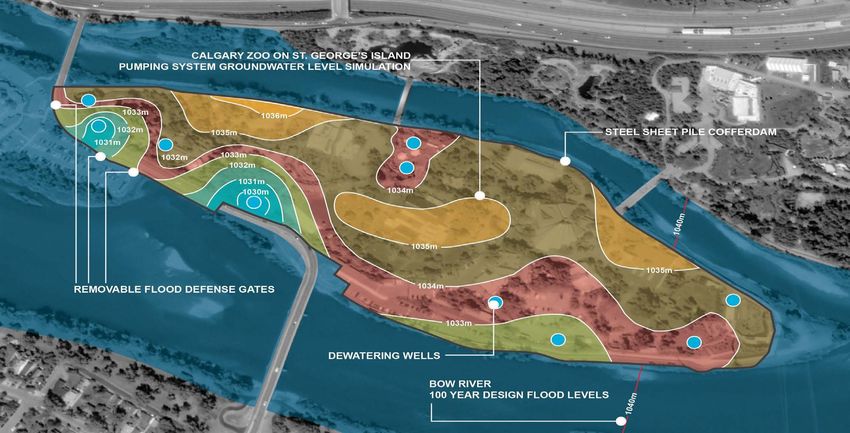
developed and modelled: active and passiveGroundwater Modelling
• A 3D numerical model was used to determine:
• The leakage through the sheet piles
• Duration of rise and fall of groundwater levels and
volumes during a flood
• The required pumping rates for dewatering wells
• The groundwater model was constructed by
Associated Engineering prior to construction and
was based on fairly limited information collected
during initial investigations
• Various scenarios were considered, modelling both
the passive and active system at leakage rates of
2%, 10% and 20%Groundwater Modelling Results
• Even with 20% leakage, there would be sufficient
capacity with dewatering prior to a flood (passive
system) to not need to pump during a flood event
(active system)
• Required groundwater modelling disclaimers:
• Scenarios were run assuming the Bow River rises to levels
Passive/Proactive system analogous to the 2013 floods and modelled river hydrographs
after two days of pumping over one and two day periods
during a 1:100 year flood
• Aimed for at least 1 m of drawdown across the island for the
passive system prior to flooding
• Assumed sand and gravel layer was homogenous
• Calibration near impossible given data limitations at the time
• Bedrock depth variations could not be represented accurately
• River level variations across the island were not represented
• Leakage rates likely vary across the island, but a bulk leakage
rate was applied across the sheet pile wall
• Aquifer parameters were estimated based on textbook values
and adjusted during calibration attempts
Active/Reactive system
after two days of pumping
during a 1:100 year floodDewatering System Design
• Eight dewatering wells located across the island,
each pumping at 15 L/s at least 11 days prior to a
flood were determined to be needed
• Wells were to be located in vaults for ease of
access and to not interrupt Zoo operations
• Dewatering wells were tied into existing or new
stormwater outfalls to discharge water to the Bow
River
• Dewatering wells were designed to be adaptive:
• Well casings were oversized so that larger pumps
could be installed
• On/off switches could easily be adjusted
• The system could be changed to an active system as
long as power remained to the pumps
• The discharge piping was oversized to be able to
accommodate additional dewatering wells, if needed
• Five monitoring wells, one located outside the
sheet piles, were also to be installedDewatering and Monitoring Well Locations
• Wells were located based on:
• Length of discharge lines
needed
• Drill rig access
• Separation between wells
• Existing utilities and infrastructure
• Proximity to the sheet pile wall
• Available power supplyConstruction
What Does it Take to Annoy an Ostrich?
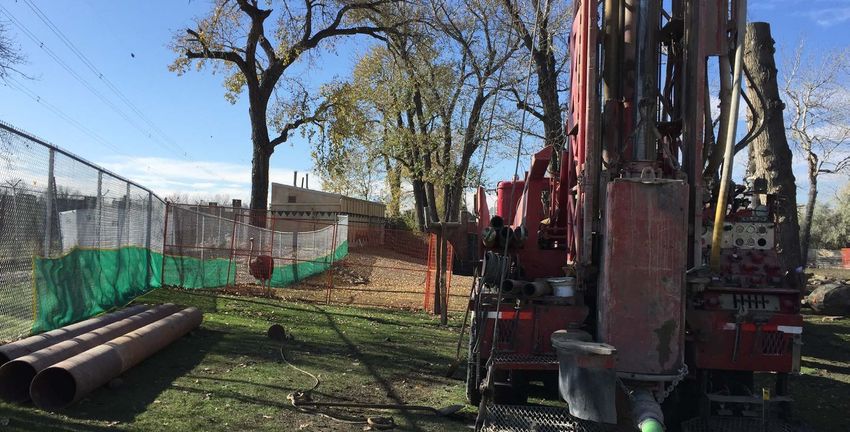
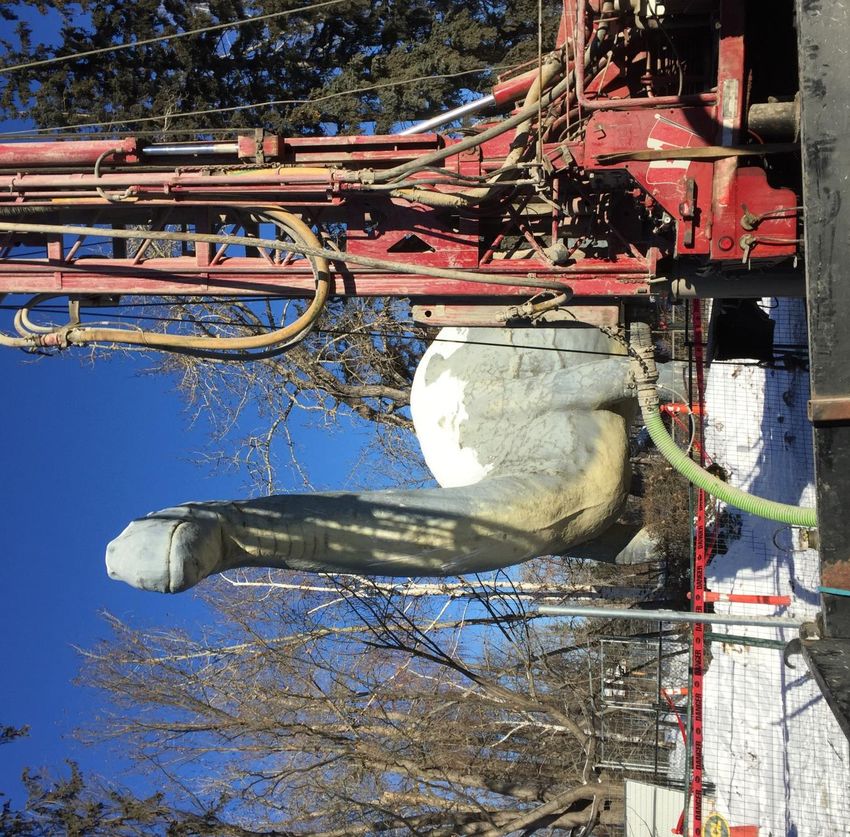
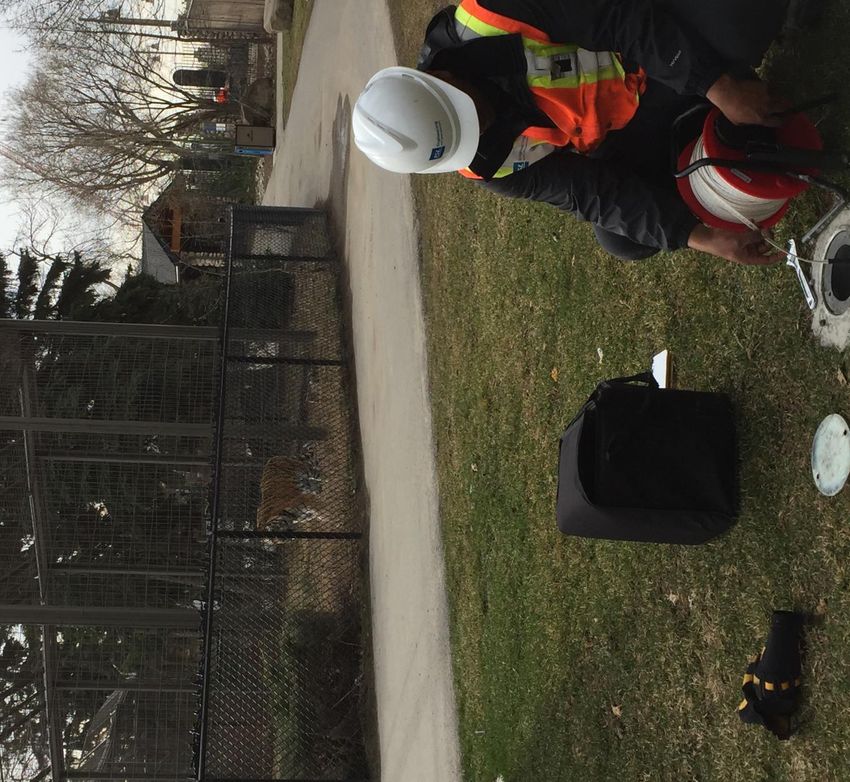
April 2016 – April 2018Well Installation • Upper 2.0 – 3.5 m was hydrovacced due to unknown utility locations throughout the Zoo • Dewatering and monitoring wells were installed using dual rotary techniques, advancing casing as the borehole was drilled • Boreholes were advanced to bedrock, which was found to be shallow in the east and a thick layer in portions of the west-southwest part of the island • Dewatering wells had grain size analyses completed and a purpose-built stainless steel screen made for each well • The steel casing was retracted after screen installation, creating a natural pack from the fluvial sands and gravels • As much of the sands and gravels were screened as possible while considering the depth of the vaults to be installed around the wells • Monitoring wells were installed with 2” PVC pre- packed screens
Well Installation
Pumping Tests
• Step and 8 hour constant rate pumping tests were
  conducted at each well to determine the individual
  well yields
• Permanent pumps were then installed at each well
  and connected to the discharge systems
• An initial entire system test was conducted for 4 to
  5 days in June 2017, adjusting pumping rates and
  on/off switches to ensure water levels reached
  steady-state conditions and did not enter the pump
  intake
• A 14 day pumping test was conducted in August
  and September 2017 to determine the
  effectiveness of the dewatering system and to
  calculate the leakage rate
Sudden rise in river level
                       apparent in Tigers East and West
                       wells (west end of island)

                                                          Very quick recovery,
No flow boundary
                                                          indicating leakage
conditions not
apparent, would be
expected given sheet
pile wall nearby
Fluvial Sand and Gravel Thickness
Pumping Test Results
• Numerical model was updated and the leakage
rate was calculated to be 8%, within the original
design parameters
• Quick recovery in dewatering wells points to
additional sources of water:
• Sheet piles may not have reached bedrock in the west
end of the island given the increased depth to bedrock
• Fractured bedrock
• Drawdown across the island did not reach required
values and most of the dewatering wells could not
pump at the desired 15 L/s
• Only protected against a 1:20 to 1:40 year flood
• More dewatering wells determined to be needed
along with upgrading the pump in the higher
capacity Tigers West well and adjusting on/off
sensors
• New well locations were chosen to be in areas with
the greatest aquifer thicknessAdditional Wells • After upgrading the pump in one well, the installation of two additional wells and the associated individual well pumping tests, sufficient dewatering capacity was gained • All wells were installed, connected and operational prior to the flood season and Panda Passage opening in May 2018 • A final, full system test was conducted over a 7 day period in June 2018
More drawdown seen in west
                      end of island with additional wells
                      and pumping capacity

                                                            Slower recovery

Average of 1.1 m of
drawdown across the
island
Summary • The additional drawdown, slower recovery and storage it creates (approximately two days worth) will protect the Zoo from a 1:100 year flood
Operations
  Watching Graphs Closely
              2018 - Ongoing
Ongoing Monitoring • Dewatering wells are operational from May to September every year and are winterized the remainder of the year • On/off switches in the wells were optimized based on the pumping tests and numerical model to ensure adequate, sustainable drawdown across the island • Dewatering wells operate automatically according to the on/off sensors and can be monitored from the Zoo’s central control system • Monitoring wells were fitted with telemetry systems that record groundwater levels and can be viewed via a website in near real time • The dewatering system is integrated into the Zoo’s flood response procedures
Summary
Waiting for the Next Big One
Teamwork
• Was a team effort from day one, with many
  subconsultants and contractors all working
  together to deliver this complex project
• The team was led by Cal McClary, who drove the
  project vision and successfully coordinated the
  teams and all the projects across St. George’s
  Island
Conclusions
• Ten dewatering wells operating from May to
  September every year, in conjunction with a sheet
  pile wall protecting from overland flow, will protect
  the Zoo from a 1:100 year flood similar to what was
  seen in 2013
• Upstream gauges and monitoring well levels are
  watched closely to ensure the system is
  operational
• Final costs for the flood mitigation program were
  approximately $26M
• Compared to damages from the 2013 flood of
  $50M and the likely frequency of large flood events
  in the future, the cost-benefit of the project is clear
• The Zoo can remain in its current location,
  continuing to provide world-class visitor education,
  experiences and animal conservation.
Thank You
      Soren Poschmann, P.Geo.
                 403-254-0544
sposchmann@islengineering.com
        www.islengineering.com
You can also read