CAMBRIDGE GLOBAL RISK OUTLOOK 2018 - University of Cambridge Judge Business School Cambridge Centre for Risk Studies
←
→
Page content transcription
If your browser does not render page correctly, please read the page content below
University of Cambridge Judge Business School
Cambridge Centre for Risk Studies

CAMBRIDGE
GLOBAL RISK
OUTLOOK 2018

Cambridge Centre for Risk Studies acknowledges the generous support provided for this research by:

The views contained in this report are entirely those of the research team of the Cambridge Centre for Risk
Studies, and do not imply any endorsement of these views by the organisations supporting the research, or our
consultants and collaborators. This report is not intended to provide a sufficient basis on which to make an
investment decision.
The results of the Cambridge Centre for Risk Studies research presented in this report are for information
purposes only. Any commercial use will require a license agreement with the Cambridge Centre for Risk
Studies.

Paper Citation:
Cambridge Centre for Risk Studies, 2018; Global Risk Outlook for 2018; Cambridge Centre for Risk Studies,
University of Cambridge.

Copyright © 2018 by Cambridge Centre for Risk Studies.

Cambridge Centre for Risk Studies
University of Cambridge Judge Business School
Trumpington Street
Cambridge, CB2 1AG
United Kingdom
enquiries.risk@jbs.cam.ac.uk
Website and Research Platform
www.jbs.cam.ac.uk/risk

Cambridge Global Risk Index 2018

The 2018 Global Risk Index quantifies the impact of         losses; and exposure to particular shocks associated
unpredictable shocks on the world’s most prominent          with the geography and type of economy of each city.
cities which, together, yield 41% of global GDP. The        The resulting GDP@Risk is mediated by each city’s
Index compiles the impacts of 22 types of threats into      ability to protect itself against shocks as well as its
a single measurement of economic loss called GDP@           resilience in recovering from them.
Risk. The Index is unique in providing a quantified         Table 1:  Top cities by GDP@Risk and threat
comparison of risk exposure across 22 different threats
(Figure 1) and 279 different cities. The 2018 headlines                          GDP@
                                                                                                                    %
are that the GDP@Risk due to geopolitical shocks has              City            Risk         Top Threat
                                                                                                                Contribution
                                                                                ($USbn)
risen by 16% in the last year, and that risk savings of
16% provide significant investment opportunities in          1    Tokyo           24.3    Interstate Conflict      37%
those cities with lower levels of resilience.                2    New York        14.8    Market Crash             21%
                                                             3    Manila          13.3    Tropical Windstorm       56%
The main change between the 2018 Index and the
analysis for 2017 is an increase in risk from Geopolitics    4    Taipei          12.9    Tropical Windstorm       62%
and Security threats, notably Civil Conflict, Interstate     5    Istanbul        12.7    Interstate Conflict      20%
Conflict and Social Unrest. GDP@Risk for geopolitical        6    Osaka           12.4    Interstate Conflict      30%
shocks has gone up by 16% from its 2017 level to             7    Los Angeles     11.6    Earthquake               23%
$133bn in 2018, roughly a quarter of total GDP@              8    Shanghai         8.5    Tropical Windstorm       28%
Risk for all cities in the Index. In fact the impact of
                                                             9    London           8.4    Market Crash             22%
Geopolitics and Security catastrophes has risen by
                                                             10   Baghdad          7.9    Interstate Conflict      55%
39% since 2015, the year of the first Global Risk Index.
This rise combines high levels of political turbulence       11   Mexico City      7.8    Market Crash             35%
in developed economies – challenging the contract            12   Seoul            7.1    Tropical Windstorm       37%
between civil society and states, and evidenced by           13   Sao Paulo        6.5    Market Crash             46%
a rise in populism – and a risks to global trade and         14   Hangzhou         6.5    Tropical Windstorm       68%
global security seen in the changing relationship            15   Jakarta          6.3    Civil Conflict           30%
between United States and other powers and regions.
                                                             16   Moscow           6.3    Market Crash             44%
The top three classes of threats in the 2018 Index are       17   Nagoya           6.1    Interstate Conflict      36%
the Natural Catastrophes (with GDP@Risk of $165bn,           18   Paris            5.9    Market Crash             24%
30% of total GDP@Risk), Financial, Economics &
                                                             19   Cairo            5.7    Interstate Conflict      55%
Trade (GDP@Risk of $142bn, 26% of total), and
Geopolitics & Security in third place.                       20   Suzhou           5.7    Tropical Windstorm       51%

The top three individual threats are Market Crash           Shocks to the global economy are largely inevitable,
with GDP@Risk at $103bn, about a fifth of total             resulting in real losses to the economy. Mitigation of
GDP@Risk; Interstate Conflict at $80bn, 15% of              losses is an essential consideration in understanding
total GDP@Risk; and Tropical Windstorm, $63bn or            those losses. In the Global Risk Index, risk mitigation
11% of total risk. Cyber Attack falls in sixth amongst      is closely related to the level of resilience of each city,
the threat rankings at $37bn, 7% of total risk GDP@         i.e., the time a city needs to recover from a shock. If
Risk. As noted in the 2017 Global Risk Index, the           the resilience of each of the lowest resilient cities,
capacity for cyber attacks to cause severe economic         some 45 out of the 279 covered, were improved by
damage is on the rise. This is a threat to be closely       just one level then their relative risk exposure would
monitored as the increasing number and severity of          reduce by 11%. If the resilience of all cities having the
attacks is countered by capabilities to protect against     lowest two resilience levels , 100 cities altogether,
them. The complete ranking of the 22 threats in the         were to be increased to up to the highest resilience
Global Risk Index are shown in Figure 1.                    level – enjoyed by Tokyo, London, Singapore, Vienna,
The top 10 cities by risk exposure are Tokyo followed       San Jose and amongst others –, their relative risk
by New York, Manila, Taipei, Istanbul, Osaka, Los           exposure would reduce by 30%.This is an indication
Angeles, Shanghai, London, and Baghdad, see Table           of what the insurance industry calls the “protection
1. Their appearance at the top of the risk list of cities   gap”, and the size of earnings from investment in
indicates two characteristics: a huge annual GDP            preparedness and resilience ahead of inevitable yet
output, hence the potential, even if unlikely, for large    unpredictable shocks.

Cambridge Centre for Risk Studies
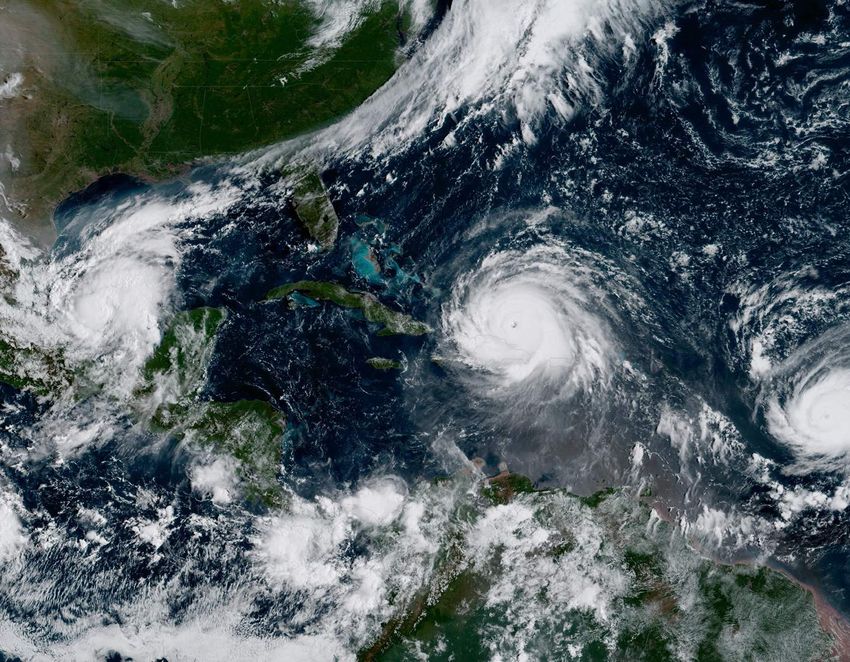
Hurricanes Katia, Irma and Jose strike Mexico and the Carribean in September 2017, the first occurrence of
three active Atlantic hurricanes since 2010.

How We Analyse Risk

Cambridge Centre for Risk Studies (CCRS) models
shocks to the major economies of the world and
estimates how likely they are to occur and how much
output is at stake.                                                                                          Human
                                                                                                            Pandemic

We analyse the risk to 279 of the world’s
leading cities, responsible for half of
global GDP, and consider a wide range
of potential causes of future shocks by
modelling around 12,000 scenarios.
Economic shock models have been
developed for 22 different threats types.                                                                       Interstate
The economy of each city is analysed         Solar Storm                                                         Conflict

by sector, size, and demography, and
the analysis estimates how much GDP output
would be lost if each city were to experience
different scenarios of shock for each threat. The
model considers scenarios of events impacting
multiple cities across a region, and propagates the
consequences to other unaffected cities that have           Tropical
trading links or economic codependence.                    Windstorm

At present we analyse the loss of output as a
                                                              How were the threats selected?
measure of economic ‘flow’. We recognise that these
catastrophes also cause loss to infrastructure, assets        The 22 threats were identified as the most significant
and the ‘stock’. Flow and stock are interrelated but          risks to the global economy through an extensive
this Index represents the risk to flow.                       study of the shocks that have impacted society and
                                                              the economy over the past thousand years, combined
Expected loss
                                                              with reviews of published catastrophe typologies,
We do not predict that crises and shock events will           emerging risk registers, and scientific conjectures of
occur. Each event is rare and unlikely. We analyse            potential future threats. This was developed into the
the small likelihood of each shock occurring and              Cambridge Taxonomy of Threats, published in 2014.
combine the chances of a rare catastrophe with its            Some of these threats have been studied in detail, and
consequences to estimate the ‘expected loss’ – the            published as stress test scenarios in the publication
average probability-weighted amount of lost GDP,              suite of the CCRS, available from our website.
which produces the Cambridge Global Risk Index
that can be used to compare different types of loss
in various places and over alternative time horizons.             Project Pandora
The actual amount of lost economic production that
would occur from a shock is many times larger than
the probability-weighted expected loss index values
that we present in this report.
We do not attempt to forecast which city will be hit
by what type of events, but we assume that crises will
continue to happen and that the risks of crises can be
measured.
Threat analysis
The analysis of each threat consists of a geographical            The Pandora global risk research programme
risk map, threat assessments for each of the 300                  at Cambridge Centre for Risk Studies is named
cities, adoption of standardized metrics for frequency            after the Greek myth of the first woman created
and severity of occurrence, localized impact severity             by the gods, who opened a forbidden container
scenarios, and economic impacts analyses. CCRS                    and accidentally released all the world’s evils
gratefully acknowledges the expertise of our external             upon humanity. The wide range of threat
subject matter specialists who have provided insights             models being incorporated in the risk analysis
into each threat.                                                 represents the contents of Pandora’s box.
Building Resilient Cities                                                                                             6

         Market Crash                                                                                      $103.3bn
     Interstate Conflict                                                                  $80.0bn
    Tropical Windstorm                                                         $62.6bn
     Human Pandemic                                                 $47.1bn
                 Flood                                          $42.9bn
          Civil Conflict                                    $37.1bn
          Cyber Attack                                     $36.5bn
           Earthquake                                     $34.0bn
Commodity Price Shock                           $20.3bn
     Sovereign Default                      $18.0bn
             Terrorism              $9.9bn
               Drought              $8.9bn
        Plant Epidemic             $7.9bn
        Power Outage               $7.5bn
               Volcano            $6.8bn
           Solar Storm            $6.6bn
         Social Unrest            $6.2bn
 Temperate Windstorm            $3.7bn
                Freeze          $3.1bn
             Heatwave          $1.8bn
      Nuclear Accident         $1.3bn
              Tsunami          $1.0bn                                                               GDP@Risk ($bn)

                           0               20              40             60             80          100           120

Figure 1:  Global Risk Index 2018 Threat Rankings

The Global Risk Index 2018 provides a comprehensive             GDP@risk will inevitably show geographic shifts
threat analysis for 279 cities that represent 41% of            over time. These changes are relevant even in the
global GDP. The economy of each city is analysed by             short term: World Bank projections of 2018 GDP
sector, size, and demography to determine the GDP               growth for the emerging economies is more than
at risk across different scenarios for 22 threat types.         double that of the advanced economies.
The definition of a city is critical to measuring the           Our analysis shows that of the 6.5% increase in GDP
losses that occur in the case of catastrophe. In this           at risk from 2017 to 2018, 3.5% is from an increase in
year’s Global Risk Index, the city size and boundaries          GDP while 3.0% is from changes in risk levels. Even
are standardised by Oxford Economics Global Cities              if risk levels remain the same, wealth will continue
definitions. Under this new standard, all cities are            to grow and distribute itself unevenly between cities
consistently defined as larger urban agglomerations             and countries.
or official metropolitan areas, where they exist. For
                                                                City resilience
example the Tokyo major metropolitan area is an urban
agglomeration which was previously considered as                An economy’s ability to recover from a catastrophe
five cities separate featured in the 2017 Index: Tokyo,         is demonstrated by the speed and extent to which it
Chiba, Kawasaki, Yokohama and Saitama. The Global               reconstructs factories and homes, repairs damaged
Risk Index also makes use of Oxford Economics’ GDP              infrastructure, regains consumer and market
data and projections. Using a single source of city             confidence, and re-engages in business activities
GDP data allows more credible comparisons between               after an event. The Global Risk Index uses a level-
the Risk Index for different years.                             based resilience metric to determine each city’s pace
                                                                of recovery after a catastrophic shock.
As city clusters drive growth, particularly in
developing economies like India and China which                 The factors which determine catastrophe recovery
show high urbanisation rates relative to more                   are multi-dimensional. The city resilience
advanced economies, future GDP and therefore                    assessment was updated in the 2018 Global Risk
Cambridge Centre for Risk Studies
        Figure 2:  Improvement required for all cities included on the Index to be classed as ‘Very Strong’ in the resilience categories
Index to explicitly incorporate various determinants      for Disease Dynamics, Economic & Policy, and CABI
of resilience. It is modelled as a composite of socio-    Plantwise. For natural catastrophes, sources include
economic factors such as deprivation and inequality,      the UN Environment Programme’s Global Risk
institutional factors such as governance and physical     Data Platform, the EM-DAT International Disaster
infrastructure, and wealth-related factors such as        Database from the Centre for Research on the
GDP per capita and the insurance penetration.             Epidemiology of Disasters, and other natural hazard
                                                          maps.
If the resilience of the least resilient cities in the
study were improved by just one level, their relative     For each threat type, we conduct a horizon-scanning
risk exposure would reduce by 11%. If the resilience      exercise to bring the catalog of threat events up to
of all cities having the lowest two resilience levels     date. We use this catalog to validate external threat
were to be increased to up to the highest resilience      assessments appearing in the data collection (above),
level, their relative risk exposure would reduce by       and/or determine whether the risk from that threat
30%. Further if all resilience ratings were increased     is expected to increase or decrease from its baseline
to the highest resilience level, the overall GDP@Risk     within the three-year outlook. Lastly, this analysis is
would reduce by 13%. Shocks to the global economy         complemented by solicitation of expert judgement
are largely inevitable, resulting in real losses to the   from a team of subject matter specialists.
economy, but this loss level is not pre-determined:
The Global Risk Index demonstrates the value of
investing in resilience.
Note that changes to city boundary definitions and
the resilience metric mean that the Global Risk Index          Shocks to the global economy
2017 as published and Global Risk Index 2018 are               are largely inevitable, resulting
not directly comparable.
                                                               in real losses to the economy,
How the Index is constructed
                                                               but this loss level is not pre-
The Centre for Risk Studies generates the Global
Risk Index by combining standardised data sets and
                                                               determined: The Global Risk
expert judgement to determine the average impact               Index demonstrates the value
of 22 threats on the global economy in the next                of investing in resilience.
three years. This requires consolidating disparate
data sets from multiple sources, deep dive analyses
of individual threats ranging from natural disasters
to wars and other geopolitical catastrophes to
technology shocks like power outage. The Global           The following sections describe the data sources
Risk Index provides a platform to compare these           used for each risk category and highlights events that
analyses across the world economy through a single        occurred in 2017. While the Cambridge Global Risk
metric: GDP at risk.                                      Index reflects long term processes and historical
                                                          events, the scan of 2017 events is key to the three year
Data sources for financial, economic and trade
                                                          look ahead that is embodied in the Index. The 2017
risks include current and historical sovereign debt
                                                          scan showed that events mostly reflect the risk as
ratings and outlooks, equity market price indices
                                                          determined by the threat assessments in line with the
and commodity price indices. For geopolitical and
                                                          previous year’s Index. The one exception is the raised
security risks, major data sources include the Global
                                                          risk of interstate conflict as blockades, militarisation
Terrorism Index from the Institute for Economics
                                                          and belligerent rhetoric build up across the globe,
and Peace, Economist Intelligence Unit’s Index of
                                                          underscoring the tense and uncertain geopolitical
Social Unrest, and the Global Conflict Risk Index
                                                          landscape in 2017.
by the Joint Research Center of the European
Commission. For technology and space risks, major
sources include nuclear power plant data from the
World Nuclear Association, power outage data
from the World Bank, and cyber and infrastructure
research from the Centre for Risk Studies. For health
and humanity risks, sources include surveillance
data from World Health Organization, databases
of emerging infectious diseases from EcoHealth
Alliance, data from ResistanceMap from the Center

Cambridge Centre for Risk Studies
Decade volcano Mount Rainier viewed over the Seattle skyline

Recent Developments in the Threat Environment                                                                             10

                                           Natural Catastrophe and Climate            Heatwaves affected large parts of
                                                                                      Southern Europe in 2017, with
                                           The 2017 year was characterised by
                                                                                      temperatures going above 40C for
                                           record-breaking natural catastrophes.
                                                                                      a few days. Extreme temperatures
   Earthquake         Tropical Windstorm   The U.S. National Oceanic and              also led to wildfires in Portugal
                                           Atmospheric Administration (NOAA)          that killed 100 people. Parts of Asia
                                           predicted that warm sea temperatures       suffered severely high temperatures,
                                           and lack of El Nino conditions would       with record country temperature
                                           cause an above-normal hurricane            highs broken in Pakistan and Iran. If
                                           season this year. The risk of landfall     temperatures continue to rise, parts of
Temperate Windstorm        Tsunami
                                           hurricanes was up by 10% due to the        South Asia may become uninhabitable
                                           mild El Nino season.                       by the end of the 21st century.
                                           The Atlantic Hurricane season in 2017      Scientific consensus seems to be
                                           was severely damaging. Hurricane           that impacts of natural catastrophes
                                           Harvey caused catastrophic damage          are becoming more severe due to
     Volcano                Flood          in Texas and parts of Louisiana, with      climate change. Of the catastrophe
                                           up to a quarter of refining capacity       types modelled in the Global Risk
                                           taken off-line during the storm.           Index, there is evidence that flooding,
                                           Hurricane Irma set the record for          heatwaves and droughts are all
                                           longest Category 5 hurricane, lasting      becoming more frequent. Since 1993,
                                           3 days, affecting large parts of Florida   sea levels have risen about 86mm,
     Freeze                Drought
                                           and the Caribbean. The estimated           increasing the impact of storm surge
                                           cost of Hurricane Harvey could be          and flooding following hurricanes.
                                           up to $190bn by some estimates, and
                                                                                      The increased frequency of natural
                                           up to $150bn for Hurricane Irma.
                                                                                      catastrophe events due to climate
                                           Particularly heavy monsoon rains also
                                                                                      change is embedded in the risk
    Heatwave                               fell in South Asia in 2017, affecting
                                                                                      assessment of the Global Risk
                                           over 45 million people and killing over
                                                                                      Index. The Index demonstrates the
                                           1,200. Heavy flooding also occurred in
                                                                                      economic impact of asset destruction
                                           Peru, Vietnam, China and Australia.
                                                                                      and economic disruption due to these
                                           A drought has continued to devastate       disasters. Although 2017 was a severe
                                           Somalia, Kenya and Ethiopia since          year for natural catastrophes, the
                                           2015, causing food shortages for           uncertainty and long-term nature
                                           11 million people. A possible 1-in-        of climate projections cannot tell
                                           100 year drought affected parts of         us whether short-term trends will
                                           Northern United States in summer           escalate.
                                           of 2017, resulting in wildfires which

                                           burned 1 million acres of land.
Geopolitics and Security situation is the geopolitical composition of
East Asia, which could have the unintended
Interstate conflict risk is the only threat of
consequences of turning a North Korean
the 22 in the Cambridge Risk Taxonomy to
standoff into a great power conflict.
have systemically increased this year. The
Interstate Conflict
number of states involved in conflict or at risk Territorial disputes in the East and
of conflict combined with the interconnected South China Seas continue to exacerbate
nature of the international system suggests relationships within the same region,
future conflicts will not be isolated. positioning local powers into antagonistic
Accordingly, geopolitical threats such as relations despite a degree of interdependency.
Terrorism interstate conflict, social unrest, civil conflict The addition of several other regional states,
and terrorism will also become progressively each with intertwined collective security
interconnected, accelerating a rebalancing agreements and their own perceptions of
of interests between local, regional and history in the region, into the dispute makes a
international participants. Figure 33 resolution of the conflict unwieldy and highly
highlights the progressive increase in GDP- complex.
Civil Conflict
at-Risk year over year due to heightened
In the Middle East and North Africa (MENA),
geopolitics & security risks in dark blue.
a diplomatic dispute originating between
140 Saudi Arabia and Qatar quickly expanded,
$133.3 bn
resulting in a halt of diplomatic relations and
130 Δ Risk: +12.1%
participation in an ongoing blockade against
Social Unrest Qatar. Iran and Turkey aligned themselves
120
$114.5 bn Δ GDP: +4.3%
with Qatar, lessening the impact of the
110
Δ Risk: +8.3% blockade but underscoring the fractured state
of MENA politics. Iran maintains a proxy
100 presence in several conflicts throughout the
$96.1 bn
region, namely in Yemen, Iraq, Syria and
Δ GDP: +10.9%
90 Lebanon. Ongoing instability in the MENA
region has also seen interventions from
80
GRI 2015 GRI 2017 GRI 2018
global powers, different regional forces and
proxy groups, all in support of opposing
interests. These interventions could serve
Figure 3: Geopolitics & Security GDP@Risk as inflection point for a larger conflict. In
($bn).
Eurasia, Azerbaijan and Armenia broke a
2018 has seen the return of great power ceasefire for the second time in two years
conflict, resulting in heightened geopolitical in the disputed Nagorno-Karabakh region.
competition and the highest expected level Although contained, the territorial tension
of world military spending since the Cold has been a constant source of instability
War ended. Tangible displays of aggression that could intensify into a regional conflict
combined with diplomatic and trade disputes involving other powers such as Iran, Russia
suggest that the probability of interstate and Turkey.
war is increasing. There is great potential With the fall of the Islamic State’s territorial
for rapid escalation resulting from regional caliphate, terrorism is statistically on a
skirmishes; several pressing conflicts are downward trend. However, this threat is
ongoing but have not yet seen intervention evolving: Islamic State and al-Qaeda are
from major powers. increasingly reliant on small scale ambushes
Following tests of intercontinental and and suicide attacks primarily focused on
medium range ballistic missiles over US- civilian populations. While these methods
allied territories, the diplomatic relationship tend to be less successful or harmful than
between North Korea and the United States larger strategic attacks, they still cause death
is contentious, resembling brinkmanship that and destruction, oftentimes in a much more
has not been experienced since the Cold War. geographically diverse area than targeted
Although it is likely that a deal or nuclear strategic attacks. Larger attacks are possible
deterrence will prevent destructive conflict, as well: al-Qaeda affiliate al-Shabab’s likely
the situation remains inherently dangerous. targeted bomb attack in Mogadishu’s centre
Further adding to the complexity of the was one of the largest and deadliest bomb
Cambridge Centre for Risk Studies12
attacks in Somalia’s history. The transition from by a violent crackdown by Spanish authorities,
insurgent tactics to more traditional terrorist tactics encouraging sustained demonstrations and riots.
also pose a threat to the West—as the rise of lone- Less impactful but continued instances of social
wolf actors using “low-tech” terror tactics, often unrest and civil conflict have occurred in Hungary,
inspired and or directed digitally, has challenged Poland, Romania, Greece and Serbia.
Western security authorities, namely in France,
Similarly, the United States is experiencing perhaps
Spain and the UK. Competition between the Islamic
the greatest example of political polarisation since
State and al-Qaeda for localised affiliates throughout
the 1960’s. Polarising issues of race and inequality,
the MENA region and other areas such as the Saleh
and the role of government in a variety of social and
is accelerating.
economic decisions increasingly driven by violence,
The 2017 defeat of far-right parties in France as seen in widespread protests against police
and the Netherlands has had little impact on the brutality and inequality, and demonstrations by
perception that far-right parties are on the cusp of extremist groups. Latin America, Africa, South Asia
gaining long-term political constituencies, especially and MENA have also experienced a moderate level
in continental Europe where it is amplified by new of social unrest. Functioning as the primary drivers
technology such as social media to great effect. Social of social unrest are: economic inequality, corruption,
cohesion is fragile in this environment, with many electoral fraud, partisan politics, sectarianism,
European electorates disagreeing on immigration, environmental factors and ethnic and religious
integration, austerity, and sociocultural norms— inequality. Brazil, Venezuela, Cameroon, Kenya,
issues that populist parties elsewhere in Europe South Africa, Zimbabwe, South Sudan, DRC, India,
have exploited to gain electoral legitimacy. An Kashmir, Bangladesh, Myanmar and Iran standout
independence referendum in Catalonia was met amongst a crowded field.Technology and Space The cost to industries in terms of business
interruption and ransom payments is so
In September 2017, we saw the largest
far marginal relative to infection rate.
solar flare (X9.3) in more than 12 years,
Ransomware attacks are increasingly being
causing brief radio blackouts and a display
Nuclear Accident used for strategic and political reasons rather
of auroras. Power grid operators continue
than financial gain. Data exfiltration and
to make incremental improvements to their
leaks of diplomatic correspondence have
grid infrastructure to maintain capacity and
fuelled disputes between UAE, Qatar, and
protect against geomagnetic damage however.
Saudi Arabia. Russian intelligence agencies
This is balanced by the risk of power deficits
are accused of deliberately spreading
Power Outage as demand increases. Threat of nuclear
misinformation through social media during
accident is also relatively unchanged as three
the US election.
nuclear power plants were decommissioned
in 2016. CCRS monitors the construction The greatest potential for economic loss
of new nuclear facilities, with new facilities from cyber attacks is the threat to critical
planned mostly in Asia and Russia. infrastructure. While several ransomware
Cyber Attack
and data infiltration cyber attacks were
The cyber threat, as in last year’s update,
executed with high profile and disruption this
continues to develop at a rapid pace. Cyber
year, there were few successful or destructive
attack loss severities are increasing with
attacks on critical infrastructure. Several
several recent attacks showing the potential
attempts and advances have been recorded
for systemic impacts with global reach.
however. The US Department of Homeland
Solar Storm Nearly every country in the industrialised
Security released a report in March 2018
world has reported a loss related to cyber
indicating Russian hackers had access to
risk. Ransomware continues to be the most
critical control systems in several sectors of
significant malware threats; WannaCry
American infrastructure including energy,
and NotPetya ransomware were the
nuclear, commercial facilities, water, aviation
most prominent examples seen in 2017.
and manufacturing.
The WannaCry attack in May 2017 was
particularly far reaching, with reported
infections in 150 countries. A leak of NSA
zero-day exploits has been seen as a catalyst
for the recent systemic ransomware attacks.
The cyber security community has actively
targeted these exploit kits and their use
is decreasing as a result. Other infection
methods are increasing however – e.g. spam
botnets, social engineering – and illustrate
the evolving nature of this threat.
Cambridge Centre for Risk Studies14
Health and Humanity Significant gains have been made in malaria
reduction globally due to efforts such as
Major epidemics were mostly contained to
better detection, testing, use of insecticide-
specific regions in 2017. The places affected
treated nets and anti-malarial treatments.
are typically suffering from climate and
Human Pandemic The largest gap now resides in the African
geopolitical crises which exacerbate hygiene
region, particularly Sub-Sahara Africa, which
and public health issues. These epidemics
accounts for 92% of malaria deaths.
highlight the intersection of threats as events
of one type can trigger or exacerbate the A challenge in the health and humanity
effects of another. Whether it is due to the outlook is the effect of anti-microbial
Plant Disease global nature of supply chains, urbanisation resistance (AMR). Along the Cambodia-
or climate change, we see that the potential for Thailand border, a strain of malaria is
epidemics to extend their reach is increasing. becoming resistant to almost all available
Parts of Brazil are experiencing cases of anti-malarial medicines. There is a risk that
yellow fever that did not exist before, calling multi-drug resistance will develop in other
for a country-wide vaccination campaign. The parts of the sub-region as well, jeopardising
prevalence of tropical infections in Southern the significant gains made against malaria.
Europe is increasing, potentially due to
AMR is a serious threat in all parts of the
economic downturns, climate change and
world, including the developed parts with
human migrations.
otherwise strong healthcare systems. Anti-
The cholera crisis in Yemen which began in microbial infections kill 50,000 people
October 2016 has now progressed to over each year in Europe and the US, with global
a million cases and has caused over 2200 deaths estimated to be 700,000. According
deaths. While the rate of infection is declining, to the Review on Antimicrobial Resistance,
this outbreak is the worst in history. The 300 million people are expected to die
situation is made worse by the poor medical prematurely because of drug resistance over
and sanitation conditions arising from civil the next 35 years and the world’s GDP will be
conflict in the region. 2 to 3.5% lower than it otherwise would be in
2050. While drug resistance is not new, this is
Dengue outbreaks also increased in 2017,
an important risk in health that is worsening
particularly in Sri Lanka, due to heavy rains
and will need to be monitored.
and flooding. While outbreaks are endemic
to this area, the climactic environment has Other threats currently on our watchlist
formed more potential breeding grounds for include: MERS (Middle East respiratory
mosquitoes, the vector of transmission. The syndrome), H5N1 (avian flu), H7N9 (new
increase in number of flood events in 2017 variant avian flu), haemorrhagic viruses (like
could potentially cause a rise in diseases such Ebola), gain of function research and vaccine
as dengue fever, malaria, chikungunya, and development.
Japanese encephalitis in flood-affected areas.Finance, Economics and Trade World oil and natural gas prices have been
recovering steadily since the slump in late
Financial, Economic and Trade Risks have
2015/early 2016. Increased demand for
remained largely steady since the publication
natural gas due to its prominent role as a
of the 2017 Global Risk Index. Global
Market Crash transitional fuel has contributed to its higher
financial stability is improving due to higher
demand. Food prices in most countries are
capital requirements under Basel III but risk
rising, which has also fuelled CPI inflation
appetite has also increased due to positive
in major economies. While prices have been
global growth outlook coupled with a low
trending upwards, we see no imminent threat
interest rate environment. Rising debt levels,
of a severe and sudden shock. While recent
Sovereign Crisis particularly in the US and China, increase
natural disasters such as Hurricane Harvey
the vulnerability to a crisis – particularly if
caused local fuel price surges due to lower
interest rates rise or growth is subdued.
supply, prices corrected shortly after.
Economic activity has been fairly strong
however, particularly in Europe. Italy’s
Commodity Prices
banking sector appears to have stabilised
following recent bailouts and financial
reforms. Portugal debt was also upgraded
back to investment grade from junk.
Sovereign debt risks have increased in some
countries facing political and economic
uncertainty such as UK, US, Mexico, South
Africa, and Turkey. A negative outlook for
Qatar was issued following regional disputes.
China’s credit rating was also downgraded
this year and El Salvador is in “selective
default” after its government missed pension
debt payments. However, these risks may be
transient in nature and do not necessarily
indicate any systemic sovereign failures.
Cambridge Centre for Risk StudiesFiring operations are carried out on a series of devastating wildfires in California, spread by unusually strong and persistent Santa Ana winds (Photo: Forest Service, USDA)
Changes in Risk Landscape

      Global Risk Index Growth: sub-categories ($bn)
180

160                                                                                                                  GRI 2015   GRI 2017

140                                                                                                                  GRI 2018

120

100

 80

 60

 40

 20

  0
           Natural Catastrophe   Financial, Economics & Trade   Geopolitics & Security       Health & Humanity      Technology & Space

      Figure 4:  2017 Global Risk Index by Threat Type

      Changes in Threat Risks                                                  these threats, although their relative wealth allows
                                                                               them to be more resilient: Tropical Windstorm is
      In comparison to the 2017 Global Risk Index, the
                                                                               the second-most costly threat for Tokyo ($3.35bn)
      2018 outlook has not changed significantly. The
                                                                               and Flood is the second-most costly threat for New
      most significant threats to the global economy are
                                                                               York ($2.47bn). Natural catastrophe risks effect on
      consistent with last year’s risk outlook: Financial,
                                                                               cities regardless of their solvency, however. With the
      Economics & Trade risks are mitigated compared to
                                                                               exception of cities in Japan, all Asian cities in the top
      the long-term trend as baseline commodity prices are
                                                                               20 ranking have a natural catastrophe risk as its top
      lower than the average of the past decade and severe
                                                                               threat.
      financial shocks are likely to be contained as banking
      liquidity returns and capital buffers continue to be                     The only category of threats in the 2018 outlook
      put in place. Market Crash risk remains as the top                       that has increased materially year-over-year is
      threat overall. While there has been no notable                          Geopolitics and Security. The total expected loss from
      increase in this risk year-over-year, we should be                       this category is nearing that of Financial, Economic
      reminded of the severity of a financial crisis on GDP,                   & Trade risk – another category of man-made risks.
      especially as these crises happen with relatively high                   Man-made risks have shorter time scales compared
      frequency throughout history.                                            to natural risks such as Natural Catastrophes and
                                                                               can escalate (and de-escalate) quickly. The events
      Cyber attacks also remain top of mind. Risk levels
                                                                               highlighted in this report in East Asia, United States
      for this threat were raised in last year’s Global
                                                                               and the Middle East demonstrate the near-term
      Risk Index. The events that occurred in 2017, e.g.
                                                                               increase in these risks. The likelihood of intense,
      WannaCry, NotPetya, illustrate this elevated threat.
                                                                               multipolar conflict is still very low, especially ones
      Cyber protection capabilities are slowly improving
                                                                               which would directly impact militarily strong
      in response to the proliferation of cyber criminals,
                                                                               countries such as the United States or Japan.
      providing a steady but relatively high level of risk,
                                                                               However, that likelihood is increasing and the
      coming in 7th overall out of the 22 threat categories.
                                                                               physical and economic impact in the event of such a
      Natural catastrophes risks together inflict the                          war would be undoubtedly severe.
      most damage to the global economy, with tropical
      windstorms (3rd), floods (5th) and earthquakes
      (8th) as the most financially damaging types. The
      increase year-over-year is mostly due to the growth
      in GDP of the cities exposed to natural catastrophes.
      Many wealthy city economies are vulnerable to

      Cambridge Centre for Risk Studies
Cambridge Centre for Risk Studies
Figure 5: Cambridge Global Risk Index 2018, change in GDP from 2015 to 2018Conclusion The risk landscape is changing. The Index provides guidance on where future disruptions to revenues and economic activity are most likely to occur. It provides a framework for incorporating the frequency and severity of future shocks into resilience planning, and inputs into risk registers and formal reporting of risks to shareholders and regulators. The Index is structured to help with the cost benefit justification of improving resilience. Policy makers can use the Index for civic continuity, economic security, and preparedness, particularly city administrations in identifying the key drivers of risk to the economic prosperity of their metropolis. Financial services companies providing risk capital can incorporate this type of analysis into their own techniques and country threat assessments. Some risks included in the analysis are not incorporated in conventional risk management products and standard perils covered in traditional insurance. Better understanding of these risks may provide opportunities for insurers to create new product offerings and address new markets. A Map of the Future Risk Landscape The Index provides a map of the risk landscape ahead. Understanding the patterns of future risk is the key to successful risk management. We provide these analytics to help businesses, policy-makers, financial services providers, insurers, and other professional risk managers gauge their planning decisions, strategies and investments. We estimate that over half of this risk can be mitigated by improvements in resilience and investment in risk management. Heightened awareness and improved understanding of risks is the key to building resilience. The 2018 Global Risk Index is unique in quantifying the GDP impact of unpredictable shocks on 279 of the world’s most prominent cities. The Index compiles the impacts of 22 types of threats into a single measurement of economic loss called GDP@Risk. This annual update standardises the tracking of a wide variety of systemic types of shocks to the economy. The underlying analytics provide a methodology to quantify the economic value of improvements in city resilience; this has significance for governments, infrastructure providers and insurers, and development organisations. Cambridge Centre for Risk Studies
Cambridge Centre for Risk Studies Publications                                                                                                                         20

Taxonomy of Threats             Geopolitical Conflict                 Pandemic                     Cyber Catastrophe                        Social Unrest
                                   Emerging Risk Scenario          Emerging Risk Scenario              Emerging Risk Scenario               Emerging Risk Scenario

         Ebola                    Climate Change               Global Property Crash             Eurozone Meltdown                      High Inflation World
   Emerging Risk Scenario         Investor Sentiment Shock         Financial Risk Scenario             Financial Risk Scenario              Financial Risk Scenario

  Dollar Deposed                Cyber Accumulation               Business Blackout                 UK Cyber Blackout                    World City Risk 2025
   Financial Risk Scenario          Insurance Risk Report        Lloyd’s Emerging Risk Report   Lockheed Martin UK co-branded report       Lloyd’s co-branded report

 Helios Solar Storm          2017 Cyber Risk Landscape            Cyber Terrorism                  Impacts of Severe                   Cyber Risk Outlook 2018
   Emerging Risk Scenario         Co-branded with RMS, Inc.       Pool Re co-branded report                                                Co-branded with RMS, Inc.
                                                                                                  NatCats on Markets

                                Multi-Threat Risk             Multiline Data Insurance            Steering the course
                                                                                                   New approaches to marine risk
                              Analysis and Insurance            Schema Surveying
Acknowledgements
Cambridge Centre for Risk Studies gratefully acknowledges the expertise provided for the Pandora global risk
research programme by our subject matter specialists. Any misinterpretation in use of the advice provided is
entirely the responsibility of Cambridge Centre for Risk Studies.
Finance, Economics and Trade Risks Natural Catastrophe and Climate
• Risk Management Solutions Inc.
• Cambridge Centre for Financial History,
Dr Duncan Needham, Director
• Cambridge Architectural Research Ltd, Dr
Robin Spence, Director; Luca Leone, Director,
Antonios Pomonis, Director, Hannah Baker,
Associate
• Oxford Economics, Keith Church, Senior
Economist
• CatInsight, Dr Richard Dixon, Director
Cyber and Technology
• Financial Networks Analytics Ltd., Dr
Kimmo Soramaki, CEO and Founder • Concinnity Risks Ltd., Eireann Leverett, CEO
• Office of Financial Research, US Federal • University of Cambridge Computer Labs,
Reserve, Dr Mark Flood, Director Dr Frank Stajano, Reader in Security and
Geopolitics and Society Privacy, Graham Rymer, Ethical hacker and
penetration tester
• CyberCrime Centre, Dr Alice Hutchins,
Criminologist and Senior Research Associate,
• Cytora Ltd., Richard Hartley, CEO and Joshua
Dr Julia Powles, Postdoctoral Researcher
Wallace, Product Director
Space Weather
Terrorism
• British Antarctic Survey, Dr Richard Horne,
Science Leader, Space Weather and Atmosphere
• International Centre for Political Violence team; Dr Mark Clilverd, Senior Scientist, Space
and Terrorism Research, S. Rajaratnam Weather and Atmosphere Team.
School of International Studies (RSIS) at
Nanyang Technological University, Singapore,
Prof. Rohan Gunaratna, Director
• Department of Applied Mathematics and
Theoretical Physics, University of Cambridge,
Dr Helen Mason, Assistant Director of Research.
Infrastructure
• Risk Management Solutions Inc., Dr
Gordon Woo, Catastrophist
• Infrastructure Transitions Research
Consortium, University of Oxford, Scott Thacker,
Infrastructure Systems Modeller, Dr Raghav Pant,
Senior Postdoctoral Researcher - Infrastructure
Risk Analyst, Professor Jim W Hall, Professor of
Climate and Environmental Risks, Director of the
Environmental Change Institute22
Health and Disease
• Cambridge Infectious Disease
Interdisciplinary Research Centre, Dr
Colin Russell, Royal Society Research Fellow,
Department of Veterinary Medicine
• Department of Plant Sciences, University
of Cambridge, Dr Matt Castle, Senior Research
Fellow
• AgRisk, Dr Claire Souch, Product ManagerCambridge Centre for Risk Studies Research Team Executive Team Dr Michelle Tuveson, Executive Director Professor Daniel Ralph, Academic Director Dr Andrew Coburn, Director of Advisory Board Simon Ruffle, Executive Director of Research & Innovation Research Associates Jennifer Copic, Research Associate Dr Jennifer Daffron, Research Associate Risk Researchers Dr Jay Chan Do Jung, Risk Researcher Dr Scott Kelly, Senior Risk Researcher Eireann Leverett, Senior Risk Researcher Dr Duncan Needham, Risk Researcher Dr Andrew Skelton, Senior Risk Researcher Research Assistants James Bourdeau, Research Assistant Oliver Carpenter, Research Assistant Timothy Douglas, Research Assistant Tamara Evan, Research Assistant Arjun Mahalingam, Research Assistant Olivia Majumdar, Research Assistant Kelly Quantrill, Research Assistant Andrew Smith, Research Assistant Kayla Strong, Research Assistant Advisors and Fellows Professor Kern Alexander, Professor of Banking and Financial Market Regulation, University of Zurich Lee Coppack, Senior Advisor, Risk Communication Andrew Freeman, Risk Fellow Centre Operations Jayne Tooke, Centre Administrator Ruth Newman, Web Editor Georgie Cohen, Communications Officer Cambridge Judge Business School, Finance, Legal and Administration Offices Cambridge Centre for Risk Studies Website and Research Platform http://jbs.cam.ac.uk/risk
Cambridge Centre for Risk Studies
Cambridge Judge Business School
University of Cambridge
Trumpington Street
Cambridge
CB2 1AG

T: +44 (0) 1223 768386
F: +44 (0) 1223 339701
enquiries.risk@jbs.cam.ac.uk
www.jbs.cam.ac.uk/risk

Join our LinkedIn group at Cambridge
Centre for Risk Studies

Follow us @Risk_Cambridge
You can also read