Can poachers find animals from public camera trap images?
←
→
Page content transcription
If your browser does not render page correctly, please read the page content below
Can poachers find animals from public camera trap images?

                                                                                   Sara Beery*† , Elizabeth Bondi*‡
                                                                      California Institute of Technology† Harvard University‡
                                                                                          *Equal contribution

                                                                  Abstract                                      page [10], “Won’t Wildlife Insights images reveal the lo-
arXiv:2106.11236v1 [cs.CV] 21 Jun 2021

                                                                                                                cations of endangered species to poachers?” They answer
                                            To protect the location of camera trap data containing              that “While Wildlife Insights is committed to open data
                                         sensitive, high-target species, many ecologists randomly               sharing, we recognize that revealing the location for cer-
                                         obfuscate the latitude and longitude of the camera when                tain species may increase their risk of threat. To protect the
                                         publishing their data. For example, they may publish a ran-            location of sensitive species, Wildlife Insights will obfus-
                                         dom location within a 1km radius of the true camera loca-              cate, or blur, the location information of all deployments
                                         tion for each camera in their network. In this paper, we in-           made available for public download1 so that the exact lo-
                                         vestigate the robustness of geo-obfuscation for maintaining            cation of a deployment containing sensitive species cannot
                                         camera trap location privacy, and show via a case study                be determined from the data. Practices to obfuscate the lo-
                                         that a few simple, intuitive heuristics and publicly avail-            cation information associated with sensitive species may be
                                         able satellite rasters can be used to reduce the area likely           updated from time to time with feedback from the commu-
                                         to contain the camera by 87% (assuming random obfusca-                 nity.” Community science (also known as citizen science)
                                         tion within 1km), demonstrating that geo-obfuscation may               initiatives have also obfuscated locations to protect endan-
                                         be less effective than previously believed.                            gered species, such as eBird and iNaturalist, as there have
                                                                                                                been cases where community science and/or other open
                                                                                                                source data has informed poaching [4].
                                         1. Introduction                                                            While obfuscating locations is encouraging, it is not
                                                                                                                clear whether it is sufficient to prevent geolocalization, or
                                             Monitoring biodiversity quantitatively can help us under-          whether it is also necessary to blur or otherwise obfuscate
                                         stand the connections between species decline and pollu-               portions of the images themselves. For example, for images
                                         tion, exploitation, urbanization, global warming, and con-             in cities, geolocalization is typically based on recognizable
                                         servation policy. Researchers study the effect of these fac-           landmarks and geometries, such as relationships between
                                         tors on wild animal populations by monitoring changes in               buildings and roads, heights of buildings, and strong archi-
                                         species diversity, population density, and behavioral pat-             tectural features or signage. The more recognizable a fea-
                                         terns using camera traps. Camera traps are placed at spe-              ture (such as a famous landmark or horizon), the easier an
                                         cific, often hard-to-reach locations in the wild, and capture          image is to geolocate. If you see an image containing the
                                         images when there is movement. Recently, there has been a              Chrysler building, it’s easy to know that you’re most likely
                                         large effort in the biology community to open-source cam-              in NYC. If you can see the outline of Mount Rainier, you’re
                                         era trap data collections to facilitate reproducibility and pro-       most likely in or near Seattle. An image of the exterior of
                                         vide verification (since mistakes can cause overestimates              a nondescript chain hotel or stretch of highway might be
                                         [5]), as well as promote global-scale scientific analysis. By          more difficult to place. We believe both human intuition
                                         open-sourcing the images - not just metadata - collected               and automated methods such as [8] take advantage of these
                                         across organizations, scientists studying a specific taxa can          features. The same might be said of camera trap imagery: if
                                         pool resources and leverage bycatch (images of species that            your image contains a noticeable landmark (for example a
                                         were not the target of the original study, but are still scien-        set of large rocky outcroppings or a body of water), it might
                                         tifically valuable) from other camera trap networks. They              be easier to estimate its location. In contrast, an image of
                                         will also be able to study animal behavior. A great deal of            dense undergrowth is only as potentially geolocalizable as
                                         camera trap images are publicly available from all over the            your ability to recognize and model the distributions of its
                                         world, including via websites hosted by Microsoft AI for               visible flora and fauna, and your ability to estimate a lati-
                                         Earth and University of Wyoming [13] and Google [9].
                                             However, as mentioned on the Wildlife Insights FAQ                   1 Public   downloads are not yet available in Wildlife Insights

                                                                                                            1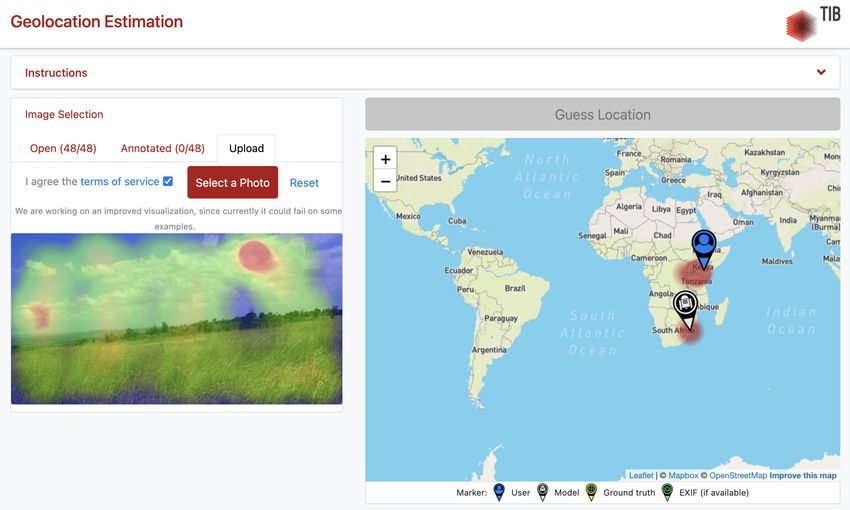
tudinal band based on the timings of sunrise and sunset. In
order to make these data publicly available, it is imperative
that we understand whether these camera trap images can
reveal locations, and if so, how to prevent locations from
being revealed.
In this paper, we investigate how “obfuscated” these
camera locations are, both with existing off-the-shelf geolo-
calization models and with a human-in-the-loop algorithmic
approach we define as a proof-of-concept. We show that
while existing models struggle to accurately locate camera
trap images, a systematic method of filtering targeted to
a specific conservation area using publicly available satel-
lite rasters can be used to find specific candidate areas that
are quite accurate, rendering the geo-obfuscation ineffective
and indicating that the answer to our titular question is yes.
2. Related Work
It has been shown in prior work that geolocation can be
determined from images. For example, PlaNet [8], an open-
source deep learning approach pairing ground-level views
and satellite data (see examples in Fig. 2), can predict a
set of plausible locations of any image, including nature
scenes. Most of these methods require multiple images for
better performance, which are readily available for camera
trap image collections. Other approaches focus on iden-
tifying objects in the scene, and using those identities to
predict the locations [11]. Preventing locations from being
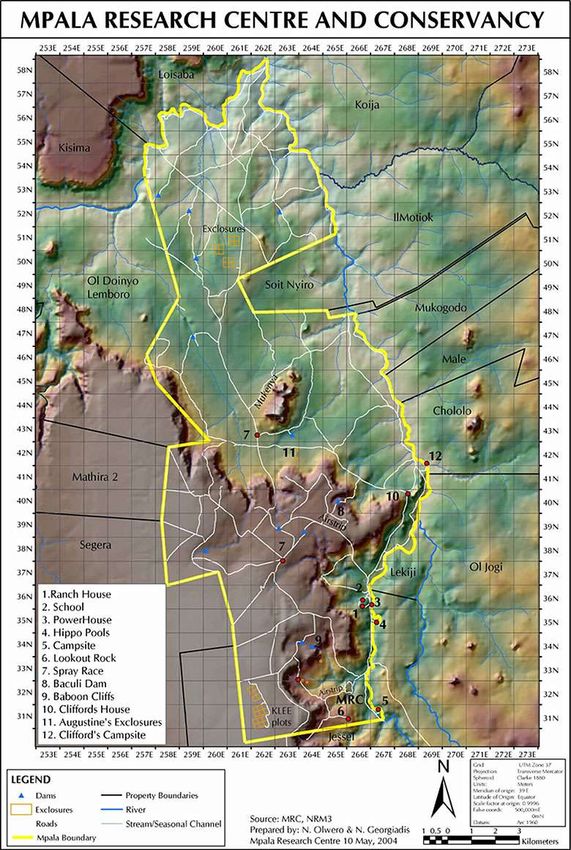
Figure 1: Map of Mpala Research Centre in Laikipia,
revealed from images has also been considered in previous
Kenya, where the camera traps we studied were located.
work, should this be necessary for camera trap images [12].
In particular, [12] applies to general image collections, such
as those that might be posted to social media by users, and of the 2020 Great Grevy’s Rally, and have been continually
strategically deletes images until the location is ambiguous. collecting data over the past year. They capture a variety
However, all camera trap images taken from a single camera of habitats and backgrounds, including open savanna, two
will have the same background, making it difficult to strate- types of forested area, changes in elevation, and sites with
gically remove images to reduce geolocalizability in a set visible horizon and without. You can see the diversity of
of camera trap images. Camera trap images may also have landscapes across Mpala in the map in Fig. 1.
very specific local landmarks, such as a well-known rock
or tree, known to those familiar with an area but potentially 3.2. Off-the-shelf results
hidden from generic deep learning methods.
We tried the existing PlaNet model on examples of cam-
3. Case study with Mpala Research Center era trap data from Mpala, with results in Fig. 2. Given im-
ages from Mpala, PlaNet predicted large potential location
Our goal with this case study is to simply prove that ge- areas covering Kenya, Tanzania, and South Africa. This
olocation is possible from camera trap imagery and meta- may be due to the large amount of animal safari-based eco-
data, indicating that sensitive animal locations could be vul- tourism in these countries. These areas are much larger than
nerable. We focus on Mpala Research Center and explore the potential randomness in location prescribed by most
both an off-the-shelf deep learning method for geolocaliza- geo-obfuscation policies, rendering the off-the-shelf model
tion, as well as a human-in-the-loop method. unhelpful in further localizing the cameras. However, given
camera trap-specific training data, similar deep learning-
3.1. Mpala camera traps
based methods may prove significantly more accurate. It is
The network of cameras we selected for our proof-of- also interesting to note that the model seems to focus atten-
concept is located at Mpala Research Center in Laikipia, tion on the sky, which may imply that we should minimize
Kenya. These 100 camera traps were initially placed as part the visibility of landmarks and horizons.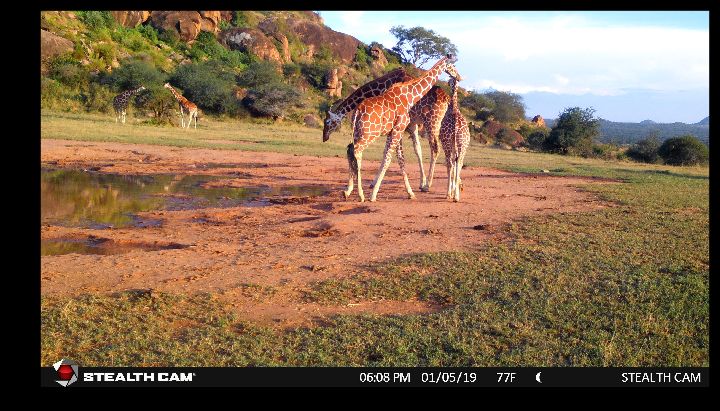
Figure 2: PlaNet results on an image from a Mpala camera
trap. The blue marker is an approximation of the ground
truth location, the white marker is the model prediction.
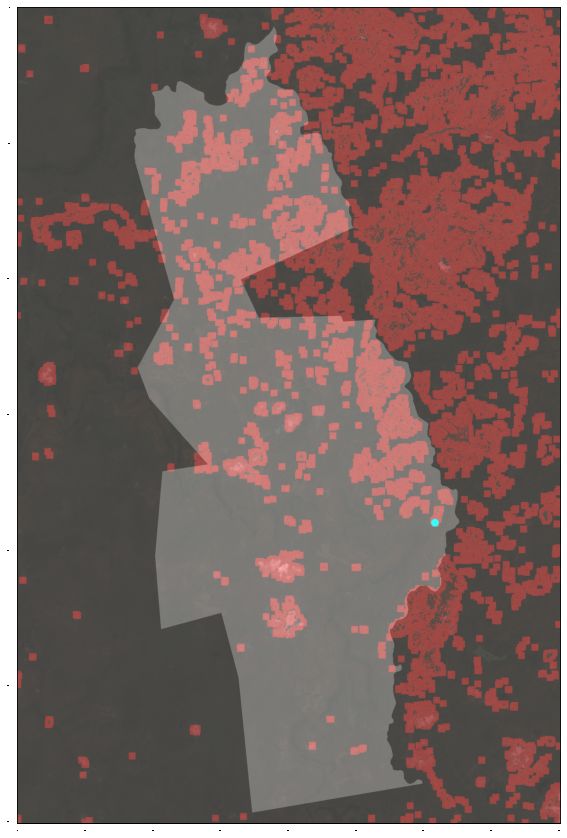
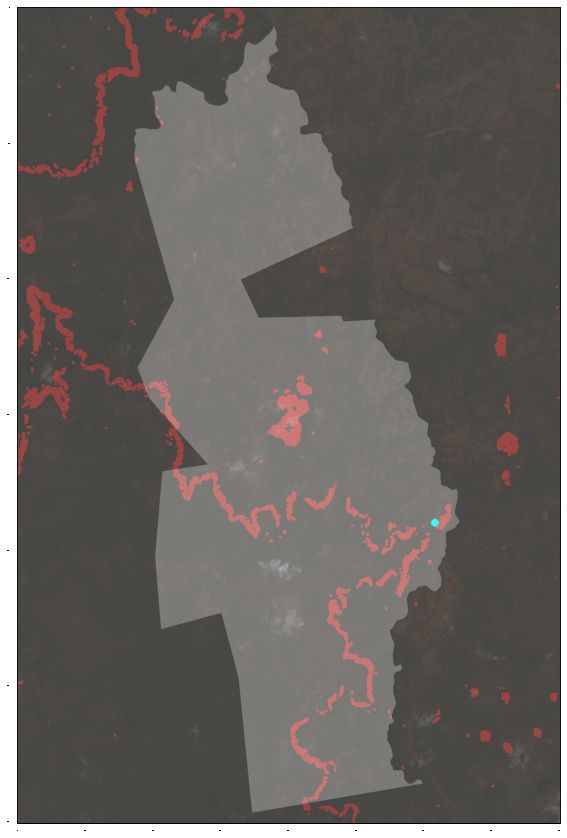
(a) Elevation change (EC) (b) Red dirt (RD)
3.3. Satellite Rasters
We primarily utilized two sources of imagery from
Google Earth Engine, specifically, (i) elevation data [6],
which were collected in 2000 with a native resolution of
30 m and ranging from about 1600-1800m in our region,
and (ii) Sentinel data [3], specifically the red, green, and
blue bands, which were collected in 2020 at a native reso-
lution of 10 m. We downloaded each through Google Earth
Engine’s platform at 10 m resolution (the minimum of the
two) over the same area to cover Mpala Research Centre,
and all 100 camera traps. We then stacked these to form a
multi-layer GeoTIFF.
We also considered using a landcover map from Google
Earth Engine [1], but we found that the classes did not have
a great deal of distinction or resolution over our particular
area of interest. We also note that if you know what part (c) RD near EC (d) RD near EC, within Mpala
of the world you are in, and approximate sunrise and sun-
set directions, then it is possible to guess the approximate
camera facing from just a few images (see Fig. 4). Methods
for automatically determining sun direction [7] and cam-
era position [2] based on shadows have been investigated in
the computer vision literature, and could be used to scale
up facing estimation for a large set of cameras. These and
other data could certainly be included in the future to further
improve geolocation results.
3.4. Human-in-the-loop geolocalization
We manually sampled one location from the camera
traps to attempt to geolocate. We chose this location be-
cause it seemed to have recognizable features, for exam-
ple, red-tinted soil and a large rock nearby (see examples in (e) RD near EC, 10km obfuscation (f) RD near EC, 1km obfuscation
Fig. 4), as we discussed in Sections 1 and 2. We decided
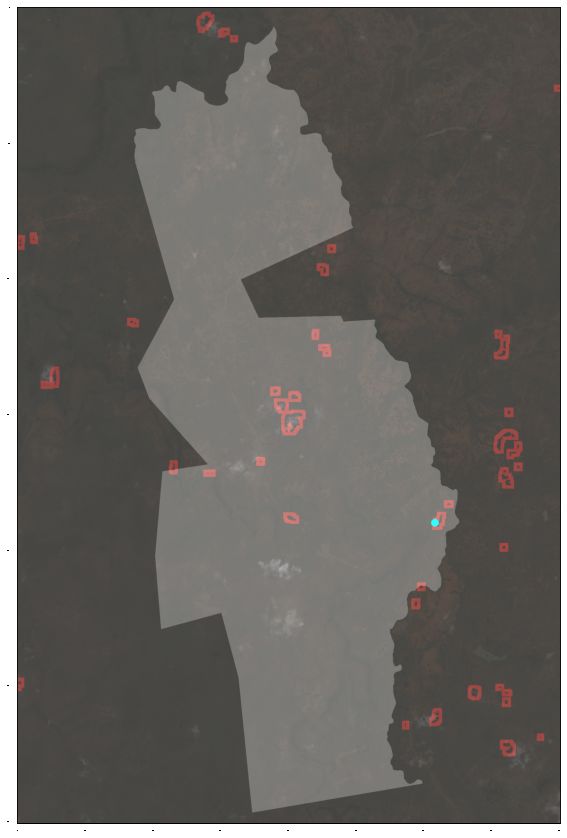
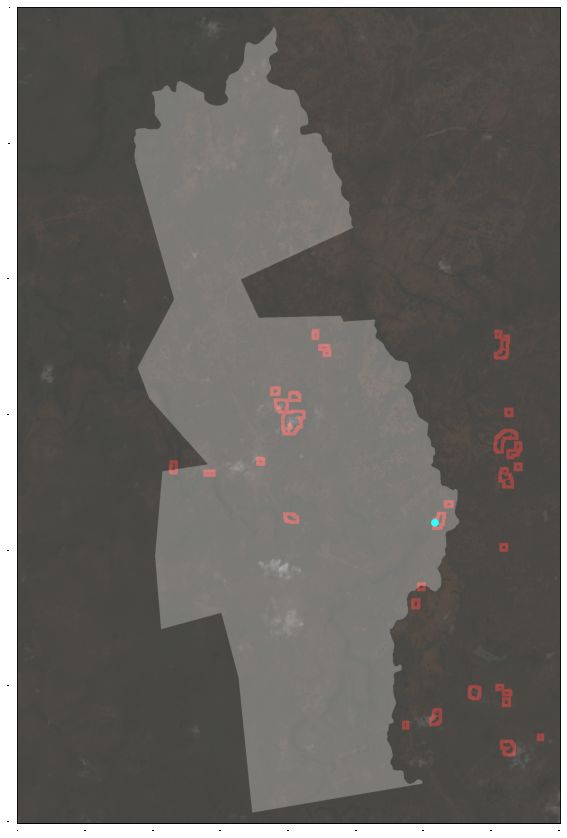
to look for exactly these traits based on our observations. Figure 3: Human-in-the-loop geolocation filtering. In each
First, we computed the gradient of the elevation band and example, the park boundary has been overlaid for context,
filtered for steep elevation change. We next searched for ar- and the camera location is represented by a small blue dot.
eas that were primarily red by thresholding the red band of The red portions of the image are “potential locations” for
the Sentinel data. We knew from our image that the camera the camera.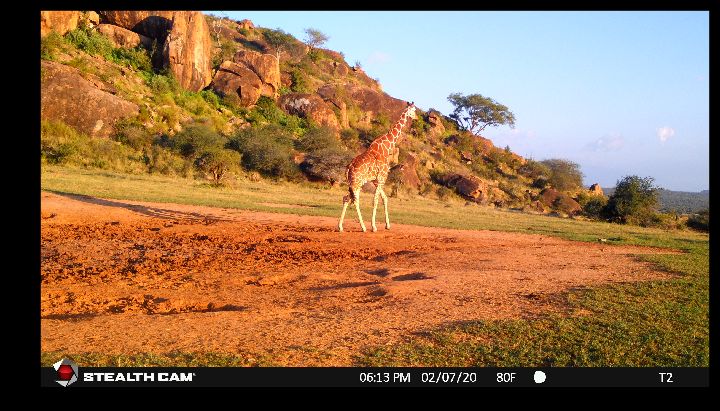
Filter type                          Area (km2 )
      RD near EC                               6.8301
      RD near EC, within Mpala                 2.0688
      RD near EC, 10km obfuscation             5.1373
      RD near EC, 1km obfuscation              0.2641

Table 1: Remaining area (in square kilometers) needed
to search on foot to find the camera location, using our
“red dirt near elevation change” human-in-the-loop filtering
method and varying levels of geo-obfuscation.

trap was not in the red area itself, so we used morpholog-
ical operators to select a small area surrounding red areas.      Figure 4: Images taken at sunrise (above) and sunset (be-
In particular, we first did a closing operation to fill in gaps   low) imply that this camera is facing south by southeast.
between small areas of the mask, then dilated this twice:
first to represent a minimum distance away from the red
area, then to represent a maximum distance away from the          2 sq km, and if the provided coordinates are known to be
red area. We then subtracted the minimum dilation to get a        obfuscated by 1km this can narrow the search space to 0.26
“donut” shape around the red areas. We needed to do this          sq km. For reference, 0.005 sq km is the area of an Ameri-
for at least one of the two features in order to observe the      can football field, meaning 0.26 sq km is about 52 football
areas of overlap (i.e., a red area nearby a rock).                fields. While this is still large, we believe that it would be
    Once we found these two areas, we simply carried out          possible to traverse this already, and likely further refine the
an AND operation between the two masks. The remain-               predictions from satellite imagery with more sophisticated
ing mask represented our candidate locations for the cam-         methods, including estimating camera facing and/or land-
era trap view. However, the camera is placed at some dis-         cover, which could cut the search area in half. We empha-
tance to view this scene. Therefore, we carried out the same      size that this reduction in search space was largely due to
operation as when searching for “near red” areas. In partic-      the presence of features in the image, especially the rock
ular, we estimated the distance of the camera from the land-      and soil landmarks. Again, this implies that we should fur-
marks in the image, and set the minimum and maximum               ther investigate avoiding or hiding such landmarks in cam-
dilation distances accordingly. We also adjusted the dila-        era trap imagery to protect the geolocation.
tion distances to account for the fact that the camera might
be located diagonally from the area of interest, and the ker-
nels used for dilation are pixel- rather than distance-based,
resulting in differing growth distance with each dilation di-     4. Conclusions
agonally vs. horizontally and vertically.
    This provided us with final candidate locations for the          Using a very simple set of operations on human-
camera trap. We therefore calculated the area of these loca-      generated heuristics based on publicly-available satellite
tions by simply computing the final number of candidate           rasters, we have shown that it is possible to drastically re-
pixels, and then multiplying by the area of these pixels,         duce the potential areas in which a camera may have been
which is 10m ∗ 10m = 100m2 . This gives us the final              placed, meaning that poachers could theoretically find an-
“searchable area,” which we report in Table 1, row 1.             imals from public camera trap images. Based on our find-
                                                                  ings, one simple way to restrict the potential geolocalizabil-
3.5. Geo-obfuscation
                                                                  ity of your camera trap data could be to consciously place
    Mpala Research Centre is about 200 sq km in area, and         cameras in positions where the horizon and/or landmarks
the result from Table 1, row 1 contains a slightly larger re-     are not visible. In future work, we hope to further analyze
gion due to the rectangular image encompassing the park.          the performance of human-in-the-loop methods and investi-
To synthesize the case where we release imagery and don’t         gate fully-automated methods for geolocalization based on
provide coordinates but do provide the park name, we re-          deep learning to better understand how to protect sensitive
strict our final candidate locations by the boundaries of the     species while promoting scientific understanding. We there-
park exactly. Similarly, we repeat the calculation as though      fore bring this new challenge to the computer vision com-
we were provided the coordinate geo-obfuscated by 10km            munity: Can we analyze which types of features in a camera
and 1km. Our full results can be found in Table 1. Provid-        trap view lead to easier geolocalization? And if so, can we
ing the park name and using these simple image processing         adversarially remove the localizeable features to preserve
techniques can narrow the search space from 200 sq km to          privacy without removing vital ecological information?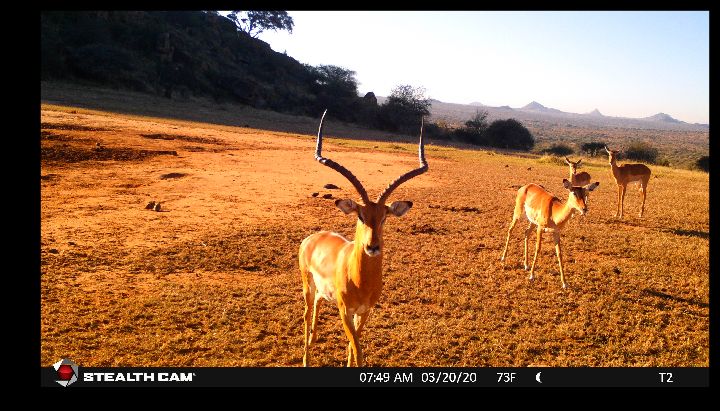
5. Acknowledgements                                                  Center, Snapshot Safari, and Microsoft AI for Earth. LILA
                                                                     BC: Labeled Information Library of Alexandria: Biology
   We would like to thank the entire team at Mpala Re-               and Conservation. http://lila.science/. 1
search Centre, and specifically Dan Rubenstein, Rosemary
for their help managing the camera traps used to collect
the data used in this case study. This work was supported,
through funding, data storage, and computing resources,
by Google AI for Nature and Society, Wildlife Insights,
the Caltech Resnick Sustainability Institute, and NSFGRFP
Grant No. 1745301, the views are those of the authors and
do not necessarily reflect the views of these organizations.

References
 [1] Marcel Buchhorn, Myroslava Lesiv, Nandin-Erdene Tsend-
     bazar, Martin Herold, Luc Bertels, and Bruno Smets. Coper-
     nicus global land cover layers—collection 2. Remote Sens-
     ing, 12(6):1044, 2020. 3
 [2] Darren Caulfield and Kenneth Dawson-Howe. Direction of
     camera based on shadows. In Proceedings of the Irish Ma-
     chine Vision and Image Processing Conference, pages 216–
     223. Citeseer, 2004. 3
 [3] European Union/ESA/Copernicus.              Sentinel-2 MSI:
     MultiSpectral Instrument,        Level-2A.           https:
     //developers.google.com/earth-engine/
     datasets/catalog/COPERNICUS_S2_SR. 3
 [4] April     Glaser.             Online     privacy     is   for
     the       birds.                    hcn.org/articles/
     climate-desk-online-privacy-is-for-the-birds.
     1
 [5] Örjan Johansson, Gustaf Samelius, Ewa Wikberg, Guillaume
     Chapron, Charudutt Mishra, and Matthew Low. Identifica-
     tion errors in camera-trap studies result in systematic popu-
     lation overestimation. Scientific reports, 10(1):1–10, 2020.
     1
 [6] NASA / USGS / JPL-Caltech. NASADEM: NASA NASA-
     DEM Digital Elevation 30m. 3
 [7] Scott Wehrwein, Kavita Bala, and Noah Snavely. Shadow
     detection and sun direction in photo collections. In 2015 In-
     ternational Conference on 3D Vision, pages 460–468. IEEE,
     2015. 3
 [8] Tobias Weyand, Ilya Kostrikov, and James Philbin. Planet-
     photo geolocation with convolutional neural networks. In
     European Conference on Computer Vision, pages 37–55.
     Springer, 2016. 1, 2
 [9] Wildlife Insights.       Bringing Cutting-Edge Technol-
     ogy to Wildlife Conservation.               https://www.
     wildlifeinsights.org. 1
[10] Wildlife Insights.           FAQ.           https://www.
     wildlifeinsights.org. 1
[11] Scott Workman, Richard Souvenir, and Nathan Jacobs.
     Wide-area image geolocalization with aerial reference im-
     agery. In Proceedings of the IEEE International Conference
     on Computer Vision, pages 3961–3969, 2015. 2
[12] Jinghan Yang, Ayan Chakrabarti, and Yevgeniy Vorobey-
     chik. Protecting geolocation privacy of photo collections.
     In Proceedings of the AAAI Conference on Artificial Intelli-
     gence, volume 34, pages 524–531, 2020. 2
[13] Zooniverse, Evolving AI Lab, University of Minnesota Lion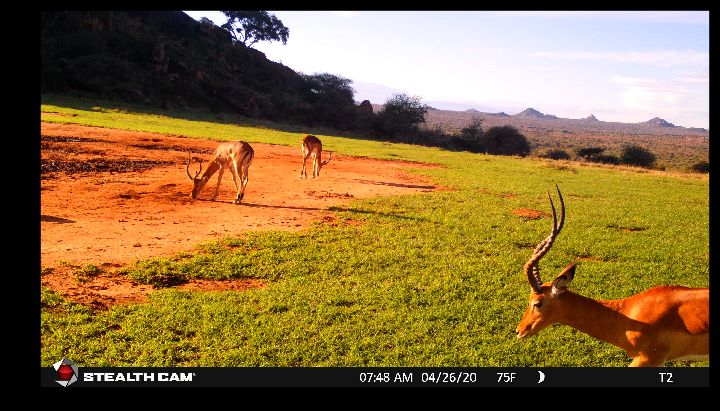
You can also read


