CFORES Cuban Journal of Forest Sciences - SciELO Cuba
←
→
Page content transcription
If your browser does not render page correctly, please read the page content below
S C I E N T I F I C P U B L I C A T I O N S D E P A R T A M E N T

 Cuban Journal of
 Forest Sciences

 CFORES
 Volume 9, Issue 2; 2021

 Director: DrC. Marta Bonilla Vichot
University of Pinar del Río “Hermanos Saíz Montes de Oca” Email: mbon@upr.edu.cu
ISSN: 1996–2452 RNPS: 2148
CFORES Journal, May-August 2021; 9(2):193-204

Translated from the original in spanish Original article

Preliminary evaluation of the efficacy of the variable
probability method in Miombo woodland

Evaluación preliminar de la eficacia del método con probabilidad
variable en bosque de Miombo

Avaliação preliminar da eficácia do método da probabilidade variável na
floresta de Miombo

Marisela Frías Tamayo1* https://orcid.org/0000-0002-3854-5888

Nheza Filomena Pereira Jay1 https://orcid.org/0000-0003-3421-7833

Edilio Aldana Pereira1 https://orcid.org/0000-0002-3218-3302

1University of Pinar del Río "Hermanos Saíz Montes de Oca". Pinar del Río, Cuba.

*Corresponding author: mfrias@upr.edu.cu

Received: 07/17/2020.
Approved: 06/05/2021.

ABSTRACT

In the research, three factors of basal area were analyzed according to the theoretical
basis of sampling with variable probability, with the objective of preliminarily evaluating
the effectiveness of Bitterlich's variable probability method for the estimation of basal
area in forests of the Miombo formation. By means of systematic sampling, 11 temporary
circular plots of fixed area of 500 m2 were established. In the center of each of these
plots, measurement points were established with a mirror relascope, where the basal
area factors (FAB) 1, 2 and 4 were used. The fixed area plots were taken as references
and the results were compared for which the analysis was performed with the statistical

 http://cfores.upr.edu.cu/index.php/podium/article/view/635
ISSN: 1996–2452 RNPS: 2148
CFORES Journal, May-August 2021; 9(2):193-204

package SPSS for Windows Version 19.0. There were no significant differences in the
results of basal areas obtained between the different factors of basal area 1, 2 and 4,
with respect to those obtained in the plots of fixed areas. In the time analysis, basal
area factor number four was the best with the least number of minutes during the
measurement of the sampling unit.
Keywords: Horizontal point sampling; Basal area; Systematic sampling; Miombo.

RESUMEN
En la investigación, se analizaron tres factores de área basal conforme el fundamento
teórico del muestreo con probabilidad variable, con el objetivo de evaluar
preliminarmente la efectividad del método de probabilidad variable de Bitterlich para la
estimación del área basal en bosques de la formación de Miombo. Mediante un muestreo
sistemático se establecieron 11 parcelas temporales circulares de área fija de 500 m 2.
En el centro de cada una de estas parcelas, se establecieron los puntos de medición con
relascopio de espejos, donde se utilizaron los factores de área basal (FAB) 1, 2 y 4. Se
tomaron como referencias las parcelas de área fija y se compararon los resultados para
lo cual se realizó el análisis con el paquete estadístico SPSS para Windows Versión 19.0.
No se presentaron diferencias significativas de los resultados de áreas basales obtenidos
entre los diferentes factores de área basal 1, 2 y 4, con respecto a los obtenidos en las
parcelas de áreas fijas. En el análisis del tiempo, el factor de área basal número cuatro
resultó el mejor con la menor cantidad de minutos durante la medición de la unidad de
muestreo.
Palabras clave: Muestreo puntual horizontal; Área basal; Muestreo sistemático;
Miombo.

RESUMO

Nesta investigação, foram analisados três factors de área basal de acordo com a base
teórica da amostragem de probabilidade variável, a fim de avaliar preliminarmente a
eficácia do método de probabilidade variável de Bitterlich para a estimativa da área basal
nas florestas de formação de Miombo. Onze parcelas circulares temporárias de área fixa
de 500 m2 foram estabelecidas por meio de amostragem sistemática. No centro de cada
uma destas parcelas, os pontos de medição foram estabelecidos com um relascópio
espelho, onde foram utilizados os fatores de área basal (FAB) 1, 2 e 4. As parcelas de
área fixa foram tomadas como referência e os resultados foram comparados para os
quais a análise foi realizada com o pacote estatístico SPSS para Windows Versão 19.0.
Não houve diferenças significativas nos resultados das áreas basais obtidos entre os
diferentes fatores de área basal 1, 2 e 4, em relação aos obtidos nas parcelas de áreas
fixas. Na análise temporal, o factor de área basal número quatro foi o melhor com a
menor quantidade de minutos durante a medição da unidade de amostragem.
Palavras-chave: Amostragem pontual horizontal; Área basal; Amostragem
sistemática; Miombo.

 http://cfores.upr.edu.cu/index.php/podium/article/view/635
ISSN: 1996–2452 RNPS: 2148
CFORES Journal, May-August 2021; 9(2):193-204

INTRODUCTION
In the Upper Central Plan of Angola, where Huambo province is located, forest resources
are exploited without adequate management. This area is constituted by an ecosystem
called Miombo, which is distributed by several African countries, with an approximate
extension of 270 million hectares (Campbell, 1996).

One of the main causes of deforestation in the Miombo is the exploitation of wood for
conversion into charcoal, since the lack of economic alternatives often makes this
resource the only source of income for rural communities.

The proper management of forest resources requires, for its planning and execution,
quantitative and qualitative information obtained through the forest inventory, which is
based on sampling and statistics, to obtain estimators of the variables of interest
(Druszcz, 2008).

Traditionally, inventories are carried out using plots of fixed dimensions and various
forms, temporary or permanent, and although the use of the variable probability method
has spread throughout the world, fixed area plots are still the most widely used. Despite
the wide application of this method, in forest inventories, there are some disadvantages
regarding the time of establishment and measurement of trees in the plots, compared
to variable probability methods (Vastaranta et al., 2015); Fiorentin et al., (2015).

Currently, for the evaluation of forest resources, there is a tendency to use variable
probability sampling points, based on the theoretical foundation of Dr. Grosenbaugh's
method and implemented by Walter Bitterlich when constructing the mirror relascope
(Aldana, 2010).

The sampling method using the horizontal point type allows obtaining the basal area per
hectare of the forest mass where the observation is made; complemented with some
additional observations and measurements, information on the quantification of volumes
per unit area and other characteristics linearly associated with the basal area can be
obtained.

Tropical native forests require effective and direct methods for the estimation of
dendrometric and dasometric attributes, which facilitate information for the
management of this resource in a reliable and accurate manner.

Little is known about dasometric studies in the Miombo formation, specifically in the area
of this research in the Cuima community of Huambo province in Angola.

The mirror relascope (Bitterlich) allows estimating the basal area per hectare, which is
a very important variable, since it is an indicator of the occupation of the growing space.
With the morphic coefficient and the height of the average basal area tree, an estimate
of the volume of the forest mass is quickly obtained.

Considering the low cost and easy to operate in the field the variable probability method
is used in forest inventory (Mulyana et al., 2018).

 http://cfores.upr.edu.cu/index.php/podium/article/view/635
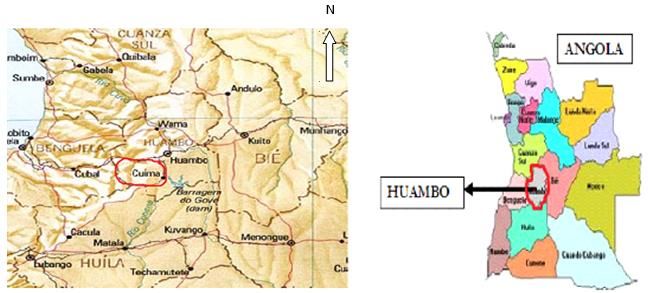
ISSN: 1996–2452 RNPS: 2148
CFORES Journal, May-August 2021; 9(2):193-204

The objective of this paper is to preliminarily evaluate the effectiveness of Bitterlich's
variable probability method for basal area estimation in forests of the Miombo formation.

MATERIALS AND METHODS
The Miombo open forest occupies about 45.2 % of the total forest area of Angola,
scattered over vast areas of the country and presents innumerable dominant
associations, where the most frequent is constituted by the genera Isoberlínea,
Brachystegia and Julbernardia; Brachystyergia speciformis, Brachystegia tamarindoides,
Brachystyergia floribunda, Brachystegia boehmii, Brachystegia utilis, Julbernardia
paniculata and Ficus sansibarica.

The Miombo formation is of medium productivity in terms of commercial timber, but has
a high social value in terms of woody fuel, construction materials, food products and
medicinal plants (Caetano, 2012).

The forest area covered by this study covers an area of 308 hectares and consists entirely
of natural forests of the Miombo formation in the village of Calombo in the province of
Huambo, located between the geographical coordinates: 13° 14' 40'' South and 15° 38'
29" East (Figure 1).

 Figure 1. - Location of the Miombo formation in Calombo village in Cuima, Huambo

Eight plots were pre-sampled and used as the basis for calculating the final sample size
using the formula (Equation 1).

For a finite population, this resulted in a final sample size of 11 circular plots of 500 m2.
The location of the plots was done by systematic sampling, where the slope of the terrain

 http://cfores.upr.edu.cu/index.php/podium/article/view/635
ISSN: 1996–2452 RNPS: 2148
CFORES Journal, May-August 2021; 9(2):193-204

was taken into account to determine the radius of the plots, which were distributed
throughout the area. The first plot was located randomly.

For the establishment of the variable probability plots with each of the basal area factors,
the midpoint of the fixed area circular plots was taken as the center.

The Bitterlich mirror relascope with three basal area factors (FAB = 1 m 2ha-1, FAB = 2
m2ha-1 and FAB = 4 m2ha-1) was used for the survey.

Fixed area sampling plots

All the diameters at 1.30 m from the ground of all the trees included in each plot were
measured with a forcepod. The basal area (G) was obtained by the diameters at 1.30 m
height of the trees within the sampling unit and converted to cross-sectional areas (g),
summed for the trees measured (m) and multiplied by the proportionality factor (F), to
convert it to values per hectare using the following formula (Equation 2).

Bitterlich variable-probability sampling points

For the variable probability sampling points, all trees were counted whose diameters
were greater than or equal to a given angle projected at a height of 1.30 m of the stem
from the ground, known as the critical angle or basal area factor. The basal area by this
method is easily obtained as follows (Equation 3).

Where:
m = number of trees included in the sampling point;
FAB = basal area factor (m2ha-1).

The SPSS program (Statistica) was used to compare the results obtained by the methods
studied. The results were evaluated by analysis of variance (ANOVA) and the comparison
means by means of Tukey's test for a p≤0,05.

RESULTS AND DISCUSSION
Evaluation of basal areas per hectare

The variable probability method is not known to be used in Miombo woodlands. However,
Couto et al., (1990) used it to measure the height of dominant trees and number of
trees per hectare in stands of Eucalyptus saligna; Monteiro and Santos (2012) used it in
plantations of Eucalyptus grandis and Peña (2000) used the Bitterlich mirror relascope
in the cubication of trees.

 http://cfores.upr.edu.cu/index.php/podium/article/view/635
ISSN: 1996–2452 RNPS: 2148
CFORES Journal, May-August 2021; 9(2):193-204

Taking into account that all the trees were measured in the fixed area plots, they were
used as a standard to evaluate the effectiveness of the different basal area factors (FAB)
corresponding to the Bitterlich variable probability method.

The dasometric variable to be evaluated is the mean basal area per hectare (m 2 ha-1) as
shown in Table 1 where the mean values per hectare of basal area in each of the 11
plots of fixed area and those obtained with the basal area factors (FAB) 1, 2 and 4)
respectively (Table 1).

 Table 1. - Mean basal areas in m2 ha-1 in the fixed area plots and with the variable
 probability method with FAB 1, 2 and 4
 Basal area (m2 ha-1)
 N0 Plots Fixed area Bitterlich
 (Gm2h-1) FAB = 1 FAB = 2 FAB = 4
 m Gm h 2 -1
 m Gm h 2 -1
 m Gm2h-1
 1 21,12 19,5 19,5 9 18 4 16
 2 9,59 10,5 10,5 6,5 13 3,5 14
 3 17,47 13 13 7 14 3 12
 4 20,75 10,5 10,5 6,5 13 3,5 14
 5 6,12 3,5 3,5 1 2 1 4
 6 11,68 3,5 3,5 1 2 1 4
 7 19,34 11,5 11,5 6 12 3,5 14
 8 8,98 3 3 1 2 0,5 2
 9 15,96 7,5 7,5 4 8 1,5 6,0
 10 14,33 20,5 20,5 7,5 15 4,5 18
 11 20,53 17,5 17,5 9 18 5,0 20
 Total 165,9 120,5 117 125,5

 ̅
 15,1 11,0 10,6 11,6

 S 2x 3,39 5,41 4,33 6,05
 Sx ±1,84 ±2,33 ±2,08 ±2,46
 0,55 0,70 0,63 0,74
 sx
 Cv% 12,2 15,4 13,8 16,3
 LE% ±10 ±10 ±10 ±10
 Er ±8,48 ±14,31 ±11,08 ±12,05
 N 8 22 16 13
 Where:
 = mean (m2 ha-1), S2x = variance (m2 ha-1)², Sx = standard deviation (m2 ha-1), Cv = coefficient
 of variation (%), = standard error, LE%= limit of expected error, Er = relative sampling error
 (%), n = required sample size.

 http://cfores.upr.edu.cu/index.php/podium/article/view/635
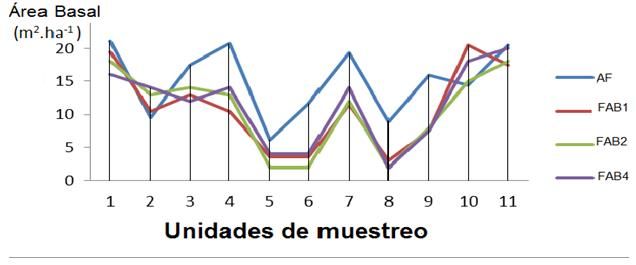
ISSN: 1996–2452 RNPS: 2148
CFORES Journal, May-August 2021; 9(2):193-204

Table 1 shows that, with respect to the fixed area plots, there is an underestimation of
the basal area with the three FABs of Bitterlich's variable probability method, with a
difference of 4.1 m2h-1 with respect to FAB 1, 4.5 m2h-1 with respect to FAB 2 and 3.5
m2h-1 with respect to FAB 4. However, between the basal areas obtained with the three
FAB 1, 2 and 4, there is practically no difference.

With the three FABs researched, error limits above ±10 % were obtained. The reason
for these results regarding the high values of the relative error lies in the fact that the
necessary number of sampling points with the different factors of basal areas was not
raised, because as shown at the end of the table, it was necessary to establish 22, 13
and 16 points for FAB 1, 2 and 4 respectively and only 11 sampling points were
established, since they were made to coincide with the number of plots of variable area.

Carneiro et al., (2015) in a Tectona grandis plantation, to determine the basal area and
volume per hectare obtained that the best method was the Bitterlich variable probability
method, as well as the relative efficiency for the estimation of all the variables studied.

Figure 2 shows the distribution of basal areas, where it is observed that except in plots
2 and 10 in the fixed area method, the estimated basal areas are higher than those
obtained with the three FABs of Bitterlich, there is practically no difference between the
three FABs (Figure 2).

 Figure 2. - Distribution of basal areas in the sampling units, where FAB = fixed area
 and FAB 1, FAB 2 and FAB 4 are equivalent to Basal area factors 1, 2 and 4
 respectively.

Looking at the distribution of Gha-1 in Figure 2, it is not possible to select the best FAB
to estimate the basal areas in Miombo.

Therefore, an ANOVA and multiple comparisons of means were performed for the
dependent variable G ha-1 with the three factors of basal areas.

Table 2 shows the analysis of variance where it is shown that there is a significant inter-
group and intra-group difference (Table 2).

 http://cfores.upr.edu.cu/index.php/podium/article/view/635
ISSN: 1996–2452 RNPS: 2148
CFORES Journal, May-August 2021; 9(2):193-204

 Table 2. - ANOVA for G ha-1

Table 3 shows the multiple comparisons of the basal area means obtained with the
Bitterlich method and with the fixed area plot method (Table 3).

 Table 3. - Multiple comparisons of means for the dependent variable G ha -1

It can be seen in Table 3 that for the estimation of basal areas with Bitterlich's variable
probability method, FAB 1 or FAB 2 can be used, with a significance of 0.998, and the
use of FAB 4 is rejected. However, when comparing the mean differences of the fixed
area plot method with Bitterlich's variable probability method; it is observed that FAB 4
is the best, with a significance of 0.967.

Table 4 shows the time in minutes taken to measure all the trees in each of the fixed
area plots and each of the trees that fell in the count with the respective FAB 1, 2 and
4.

As shown in Table 4, the time consumed in the survey with each of the FABs is much
less than that consumed in the fixed area plots due to the reduction in the number of
trees to be measured, decreasing this number from FAB 1 to FAB 4, registering in the
latter the least time since very few trees were counted (Table 4).

 http://cfores.upr.edu.cu/index.php/podium/article/view/635
ISSN: 1996–2452 RNPS: 2148
CFORES Journal, May-August 2021; 9(2):193-204

Table 4. - Average time consumed in the survey of the fixed area plots and in each of
 the FAB 1, 2 and 4

Table 5 shows the multiple comparisons of means for the dependent variable of time
and an analysis of variance is presented where there is no significant intragroup or
intergroup difference (Table 5).

 Table 5. - ANOVA for the time consumed in the survey of the plots

In Table 6, it is observed that the difference of the mean of the fixed area plot with the
three basal area factors of the Bitterlich variable probability method is significant at the
0.05 level. However, there are no differences in the means between the three basal area
factors FAB 1, FAB 2 and FAB 4 (Table 6).

In the comparison of the means of the different FABs, there is a high correlation of 0.997
between FAB 1 and FAB 2, 0.987 between FAB 1 and FAB 4 and 0.999 between FAB 2
and FAB 4.

 http://cfores.upr.edu.cu/index.php/podium/article/view/635
ISSN: 1996–2452 RNPS: 2148
CFORES Journal, May-August 2021; 9(2):193-204

Silva et al., (2016) point out that they found no statistically significant difference for the
estimation of basal area and volume per hectare between the fixed-area and Bitterlich
methods, independent of the basal area factor used in Eucalyptus grandis stands.

 Table 6. - Multiple comparisons of the means of time as the dependent variable
 (I) FAB (J) Difference of Typical Sig. Interval of confidence to
 FAB means error 95 %
 (I-J) Upper limit Lower limit

 1 2 4,00000 20,28014 ,997 -50,3593 58,3593
 4 6,79091 20,28014 ,987 -47,5684 61,1502
 Fixed -147,79091(*) 20,28014 ,000 -202,1502 -93,4316
 area
 2 1 -4,00000 20,28014 ,997 -58,3593 50,3593
 4 2,79091 20,28014 ,999 -51,5684 57,1502
 Fixed -151,79091(*) 20,28014 ,000 -206,1502 -97,4316
 area
 4 1 -6,79091 20,28014 ,987 -61,1502 47,5684
 2 -2,79091 20,28014 ,999 -57,1502 51,5684
 Fixed -154,58182(*) 20,28014 ,000 -208,9411 -100,2226
 area
 Fixed 1 147,79091(*) 20,28014 ,000 93,4316 202,1502
 area 2 151,79091(*) 20,28014 ,000 97,4316 206,1502
 4 154,58182(*) 20,28014 ,000 100,2226 208,9411
 * Mean difference is significant at the .05 level.

From the results of the time analysis it can be concluded that the Bitterlich variable
probability method saves working time with respect to FAB 1 and 2 and more with
respect to the fixed area plot method.

CONCLUSIONS
The application of Bitterlich's variable probability method for the assessment of basal
area in the Miombo forest formation is feasible, provided that the sample to be taken is
representative of the forest stand.

For the estimation of basal areas with Bitterlich's variable probability method in the
Miombo, FAB 4 was better with a significance of 0.967 with respect to the fixed area plot
method that was used as a comparison standard, being also the most economical in
terms of time and with practically the same estimation of the mean basal area as FAB 1
and 2.

 http://cfores.upr.edu.cu/index.php/podium/article/view/635
ISSN: 1996–2452 RNPS: 2148
CFORES Journal, May-August 2021; 9(2):193-204

REFERENCES
ALDANA PEREIRA, E., 2010. Medición forestal [en línea]. S.l.: Félix Varela. ISBN 978-
 959-07-1321-7. Disponible en:
 https://books.google.com.cu/books/about/Medici%C3%B3n_forestal.html?id=Pv
 6OswEACAAJ&re dir_esc=y.

CAMPBELL, B.M., 1996. The Miombo in Transition: Woodlands and Welfare in Africa [en
 línea]. S.l.: CIFOR. ISBN 978-979-8764-07-3. Disponible en:
 https://books.google.com.cu/books/about/The_Miombo_in_Transition.html?id=rp
 ildJJVdU4C&redir_esc=y.

CARNEIRO MIRANDA, D.L., FRANCIO, J., SANTOS, J. de P., SANQUETTA, C.R. y CORTE,
 A.P.D., 2015. Precisão e eficiência relativa de métodos de amostragem em teca.
 Pesquisa Florestal Brasileira [en línea], vol. 35, no. 83, pp. 247-254. [Consulta: 2
 septiembre 2020]. ISSN 1983-2605. DOI 10.4336/2015.pfb.35.83.638. Disponible
 en: https://pfb.cnpf.embrapa.br/pfb/index.php/pfb/article/view/638.

COUTO, H.T.Z. do, BASTOS, N.L.M. y LACERDA, J.L., 1990. A amostragem por pontos
 na estimativa da altura de árvores dominantes e número de árvores por hectares
 em povoamentos de Eucalyptus saligna. Scientia Forestalis [en línea], vol. 44-43,
 pp. 50-53. ISSN 1413-9324. Disponible en:
 https://www.ipef.br/publicacoes/scientia/nr43-44/cap06.pdf.

LÓPEZ PEÑA, C., 2000. Utilización del Relascopio de Bitterlich para la cubicación de
 árboles. Forestalia [en línea], vol. 2. [Consulta: 2 septiembre 2020]. Disponible
 en: https://docplayer.es/36256105-Utilizacion-del-relascopio-de-bitterlich-para-
 la-cubicacion-de-arboles.html.

MONTEIRO, J. y SILVA SANTOS, J., 2012. Avaliação do método de amostragem de
 Bitterlich em plantio de Eucalyptus grandis [en línea]. Brasil: Universidade Federal
 do Espírito Santo. Disponible en:
 http://www.florestaemadeira.ufes.br/sites/florestaemadeira.ufes.br/files/field/an
 exo /tcc_jeangelis_silva_santos.pdf.

MULYANA, B., ROHMAN, R. y PURWANTO, R.H., 2018. Application of point sampling
 method in estimation of stand basal area in community forest. Journal of Sylva
 Indonesiana [en línea], vol. 1, no. 01, pp. 45-54. [Consulta: 2 septiembre 2020].
 ISSN 2622-5158. DOI 10.32734/jsi.v1i1.426. Disponible en:
 https://talenta.usu.ac.id/Jsi/article/view/426.

SILVA SANTOS, J., RIBEIRO DE MENDONCA, A., FERNANDES DA SILVA, G. y VIEIRA
 FRAGA FILHO, C., 2016. Método de amostragem de Bitterlich: uma alternativa de
 inventário florestal para pequenas propriedades rurais fomentadas. Revista
 Brasileira de Ciências Agrárias [en línea], vol. 11, no. 1, pp. 46-52. Disponible en:
 https://www.redalyc.org/pdf/1190/119045655008.pdf.

VASTARANTA, M., GONZÁLEZ LATORR, E., LUOMA, V., SAARINEN, N., HOLOPAINEN, M.
 y HYYPP, J., 2015. Evaluation of a smartphone app for forest sample plot
 measurements. Forest [en línea], vol. 6, pp. 1179-1194. [Consulta: 2 septiembre
 2020]. ISSN 1999-4907. DOI 10.3390/f6041179. Disponible en:

 http://cfores.upr.edu.cu/index.php/podium/article/view/635
ISSN: 1996–2452 RNPS: 2148
CFORES Journal, May-August 2021; 9(2):193-204

 https://www.researchgate.net/publication/275259702_Evaluation_of_a_Smartph
 one_App_for_Forest_Sample_Plot_Measurements.

 Conflict of interests:
 The authors declare not to have any interest conflicts.

 Authors' contribution:
 Marisela Frías Tamayo: Conception of the idea, literature search and review, instrument making,
 instrument application, compilation of information resulting from the instruments applied, statistic análisis,
 preparation of tables, graphs and images, general advice on the topic addressed, drafting of the original
(first version), review and final version of the article, article correction, authorship coordinator, translation of
 terms or information obtained, review of the application of the applied bibliographic standard.

Nheza Filomena Pereira Jay: Conception of the idea, literature search and review, instrument application,
 compilation of information resulting from the instruments applied, statistic análisis, preparation of tables,
 graphs and images, drafting of the original (first version), review of the application of the applied
 bibliographic standard.

 Edilio Aldana Pereira: Conception of the idea, mpilation of information resulting from the instruments
 applied, statistic análisis, review and final version of the article, article correction, authorship coordinator,
translation of terms or information obtained, review of the application of the applied bibliographic standard.

 This work is licensed under a Creative Commons Attribution-NonCommercial 4.0 International license
 Copyright (c) 2021 Marisela Frías Tamayo, Nheza Filomena Pereira Jay, Edilio Aldana Pereira

 http://cfores.upr.edu.cu/index.php/podium/article/view/635
You can also read