CHAPTER 5: Policy Monitoring - Horsham District Council
←
→
Page content transcription
If your browser does not render page correctly, please read the page content below

Horsham District Council – Authority Monitoring Report 2020/21

CHAPTER 5: Policy Monitoring
Horsham District Council – Authority Monitoring Report 2020/21
Chapter 5: HDPF Policy Monitoring
5.1 The AMR provides a baseline position of the social, environmental and economic
circumstances in the District. In addition, the AMR ensures that the policies of the
Horsham District Planning Framework (HDPF) and any significant effects identified
through the Sustainability Appraisal/Strategic Environmental Assessment (SA/SEA)
process1 are measured against a range of indicators. Under Part 8 of the Town and
Country Planning (Local Planning) Regulations 2012 (as amended) if a local planning
authority are not implementing a policy in a local plan, the AMR should identify that
policy, and include reasoning as to why a local planning authority are not implementing
that policy and any steps it intends to address that policy issue.
5.2 This chapter sets out the results of the monitoring of HDPF policies with the exception
of the monitoring of housing delivery, affordable housing and progress in delivering
land for Gypsy and Traveller accommodation, which is set out in Chapter 3.
5.3 Chapter 12 of the adopted Horsham District Planning Framework sets out the
‘Monitoring Framework’ against which it is proposed the planning policies will be
monitored. These are set out in Appendix 1 of this document for completeness. The
choice of indicators were based on a number of different factors that included:
Relevance;
Availability of data over time (including issues of costs and reliability);
Likely significant effects identified in the sustainability appraisal;
Policy target timescales; and
Proportionality
5.4 It has not yet been possible to collect information for the complete suite of indicators
included in the HDPF Monitoring Framework, therefore indicators have been reported
on as and where the information is available. The policies monitored are set out below
in the order in which they appear in the HDPF.
1
Please see the link attached - https://www.horsham.gov.uk/__data/assets/pdf_file/0003/28641/HDPF-SA-
SEA-2015.pdf
Horsham District Council – Authority Monitoring Report 2020/21

         HDPF Chapter 4 - Policies for Growth & Change

5.5      As set out in the HDPF Monitoring Framework, policies 1 and 2 of the HDPF will not be
         monitored given their overarching nature.

         Policy 3 – Strategic Policy: Development Hierarchy

5.6      The proposed indicator for Policy 3 was to monitor the number of planning permissions
         allowed outside the Built-Up Area Boundary (BUAB), which would not comply with the
         overarching settlement strategy of the HDPF. In general terms it would be expected
         that most development is focussed in built-up area boundaries, unless sites come
         forward as allocations in Neighbourhood Plans or as Allocations in the HDPF. The
         detailed list of planning permissions set out in Appendix 1 of Chapter 3 confirms the
         spread of committed development that has emerged.

5.7      It is possible to monitor the proportions of planning appeals that were allowed,
         dismissed, allowed in part or withdrawn for the 2021/21 monitoring year. This does not
         provide a context for the appeal decisions and encompasses all types of development,
         so it is not an accurate measure of progress against policy 3 of the HDPF.
         Nevertheless, when compared with the previous monitoring period, the total number
         (22) and percentage of appeals allowed (30.99%). has increased somewhat. The
         2019/20 figures were 24 and 25.26% respectively. Prior to the adoption of the HDPF
         the percentage of appeals which were allowed was 36%. This may therefore indicate
         that the HDPF policies are being used to successfully ensure that development comes
         forward in line with up to date planning policies.

         Table 1 Appeals Data 1st April 2020 to 31st March 2021

      AMR 2020/21                                         Appeal Decision
                                                              Enforcement
                                                                                               No Further
 Appeal Procedure       ALLOWED       DISMISSED        PART      Notice           WITHDRAWN
                                                                                                Action
                                                                Quashed
      Written
                            16             38            0             0                 2         0
  Representation
     Fast Track             6              8            0             0                  0         0
 Informal Hearing           0              1            0             0                  0         0
   Public Inquiry           0              0            0             0                  0         0
       Other                0              0            0             0                  0         0
       TOTAL               22             47            0             0                  2         0
      Total %            30.99%         66.20%        0.00%         0.00%              2.82%     0.00%
    Total No. of
                            71
      Appeals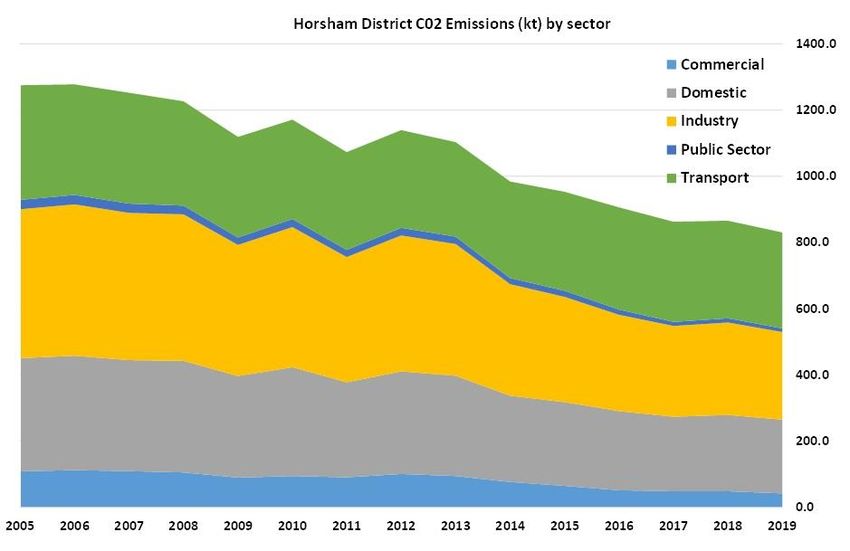
Horsham District Council – Authority Monitoring Report 2020/21

         Table 2 Total number of Dwelling Units Allowed on Appeal

                                         Appeals Allowed – Total Units

             Year                                                                      Total Units
                                 On Sites with fewer        On Sites with more
                                    than 6 units               than 6 units

      2020/21 AMR (HDPF)                   10                         14                   24
      2019/20 AMR (HDPF)                   10                          6                   16
      2018/19 AMR (HDPF)                   0                           0                   0
      2017/18 AMR (HDPF)                   8                           7                   15
   2016/17 AMR (HDPF)                      12                         80                   92
       2015/16 AMR
                                           18                        269                  287
       (Part HDPF)
 2014/15 AMR (Pre HDPF)                    15                        235                  250

5.8      In addition to increase in appeals which have been allowed, Table 2 shows there were
         24 dwelling units granted on appeal in the 2020/21 monitoring year.

5.9      As discussed above, Table 1 does not currently provide the context for the appeal
         decisions and it encompasses all types of development, meaning it is not an accurate
         measure of progress with regards to Policy 3 of the HDPF. However, the decrease in
         the total number of units allowed on appeal since adoption does seem to indicate that
         HDPF policies are still being upheld by inspectors. An analysis of all appeals between
         1 November 2015 and 18 May 2018 revealed inspectors quoted Policy 3 among the
         reasons for dismissal in 44 cases involving new builds and allowed appeals against
         Policy 3 in 3 cases.

         Policy 4 – Strategic Policy: Settlement Expansion

5.10     Policy 4 of the HDPF relates to settlement expansion and outlines the criteria for new
         developments, such as housing, employment or community developments, outside the
         built-up area boundary. It notes that such expansions of settlements will be supported
         where the site is either allocated in a Local Plan or in a Neighbourhood Plan and adjoins
         an existing settlement edge. Chapter four provides further detail on the plans which
         have been made and the allocations in each plan.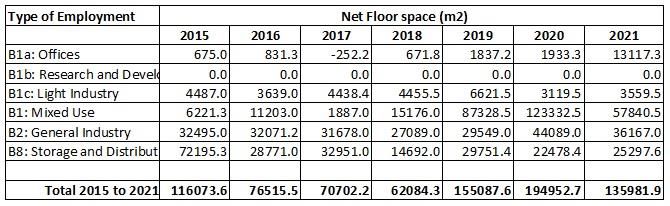
Horsham District Council – Authority Monitoring Report 2020/21

       Policy 5 – Strategic Policy: Horsham Town

5.11   Policy 5 of the HDPF relates to Horsham Town Centre and seeks to promote the
       prosperity of Horsham town by maintaining and strengthening its role as the primary
       economic and cultural centre in the district and wider economic area. From data
       provided by West Sussex County Council (WSCC) in Table 3, it is noted that there has
       been a small growth in retail floorspace.

       Table 3: Retail and Town Centre Uses Completed within Horsham Town Centre
       in 2020/21 Monitoring Period
                                                           Gross Floorspace          Net Floorspace
                   Horsham Town Centre
                                                                 (m2)                      (m2)
         Previously Developed Land
         A1: Retail (Horsham Floorings))                           183                    148
         A2: Financial/Professional Services                        70                     0

         Summary for Previously Developed Land                     233                    148

         Summary for Town Centre                                   233                    148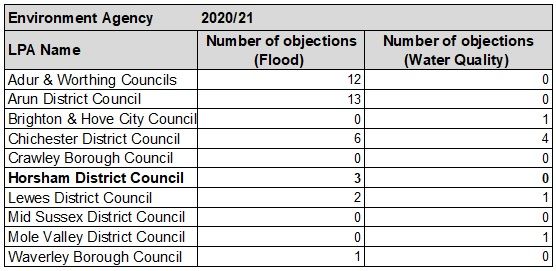
Horsham District Council – Authority Monitoring Report 2020/21

       Policy 6 – Strategic Policy: Broadbridge Heath Quadrant

5.12   Policy 6 of the HDPF relates to the Broadbridge Heath Quadrant. This area is identified
       as an ‘Opportunity Area’ where redevelopment will reinforce its role as a successful
       ‘out of town’ retail location. There are general guidelines as to the design and
       appearance of new development within this part of Broadbridge Heath and moreover,
       criteria relating to the scale and type of new retail (and other town centre) development
       permissible within the Broadbridge Heath Quadrant.

5.13   The planning application for the redevelopment of the existing leisure centre within the
       Broadbridge Heath Quadrant (see reference DC/16/1844) approved in November 2016
       was completed and the new leisure centre, “The Bridge”, opened on 20 October 2018.
       In order to assess the impacts of this policy in future monitoring years, completions
       within each use class will be monitored to ensure that a) the vitality and viability of the
       Horsham town centre is protected; and b) that this successful out of town retail location
       continues to be used for this purpose. There were no additions to retail floor space in
       the 2019/20 monitoring period.

       Table 4: Retail and Town Centre Uses Completed within Broadbridge Heath
       Quadrant in 2020/21 Monitoring Period
                                                           Gross Floorspace          Net Floorspace
                Broadbridge Heath Quadrant
                                                                 (m2)                      (m2)
         Land Not Previously Developed
         A1: Retailing (various)                                     0                     0

         Summary for Broadbridge Heath Quadrant                      0                     0
Horsham District Council – Authority Monitoring Report 2020/21
HDPF Chapter 5 - Economic Development
Policies 7 and 9 – Economic Growth and Employment Sites
5.14 Policies 7 and 9 of the HDPF relate primarily to economic growth within the District
including the retention of Key Employment Areas (KEAs). West Sussex County Council
(WSCC) provides comprehensive data on land developed for employment uses during
the monitoring period. This is presented in Table 4, overleaf.
5.15 The gross amount of employment floorspace completed on Previously Developed Land
(PDL) in 2020/21 was 6398.1 square metres, representing 32.6% of the total floorspace
completed in the monitoring year. This is an increase on the 2019/20 monitoring period
where 16% of the total floorspace completed for employment uses was on PDL. See
Table 5 for comparison over the last five years.
5.16 In total, the gross and net employment floorspace developed within the District for the
2020/21 monitoring period was 19614.0 square metres (the net figure is 18033.9
square metres). This is less than that last recorded for the 2019/20 monitoring year,
which was 24,803.2 square metres, and equivalent to the 2016/17 monitoring year
(16,352 sq. m.). Around 46% of new employment floorspace developed in the
monitoring year was for B8 use (Storage & Distribution). There is no discernible trend
from these figures, however the overall increase, particularly for non-storage uses, still
reflects the desirable nature of Horsham District as a location for businesses.Horsham District Council – Authority Monitoring Report 2020/21
Table 4: Land Developed for Employment by Type (m2) in the 2020/21 Monitoring
Period
Table 5: Land Developed for Employment by Type (m2)
Gross Employment Floorspace Completed in Horsham District
Year PDL % Not PDL % TOTAL
AMR 2020/21 6398.1 33% 13215.9 67% 19,614
AMR 2019/20 3,881 16% 20,922.2 84% 24,803
AMR 2018/19 12,911 81% 3,025 19% 15,936
AMR 2017/18 8,596 34% 16,474 66% 25,070
AMR 2016/17 12,694 66% 6,657 34% 19,352
AMR 2015/16 6,394 50% 6,487 50% 12,882
AMR 2014/15 3,602 54% 3,065 46% 6,667
AMR 2013/14 3,518 49% 3,643 51% 7,161
AMR 2012/13 9,771 100% 0.00 0% 9,771
5.17 In addition, WSCC, with assistance from HDC, also monitors the quantum and type of
employment land available for development in the district. This land includes sites
allocated for employment uses in Development Plan Documents (DPDs) and sites for
which planning permission has been granted for employment uses (excluding allocated
sites to avoid double counting).Horsham District Council – Authority Monitoring Report 2020/21
Table 6: Land Available for Employment Use by Type (m2)
5.18 Table 6 illustrates that the largest amount of net floorspace available for development
in the district at present is for B1 mixed use. There is also significant land available for
B2 (general Industry) and B8 (storage and distribution) uses. It is also notable in Table
6a that there has been further increase in office floorspace available since the end of
the 2016/17 monitoring period (which recorded a net loss of 252 square metres).
Table 6a: Historic Net Floor space Availability (m2)Horsham District Council – Authority Monitoring Report 2020/21
Policy 8 – Strategic Allocation: University Quarter Mixed Use Development
5.19 Policy 8 of the HDPF relates to a Strategic Allocation for a University Quarter Mixed
Use Development at a former pharmaceutical research development and
manufacturing site in Horsham, ‘the Novartis site’, which is bounded by Wimblehurst
Road, Parsonage Road and the railway lines. Policy 8 envisaged that the site would be
developed for a higher education facility that included complementary employment
uses and associated infrastructure. However, the university previously considering
purchase of the Novartis site confirmed that they were no longer looking to develop a
higher education facility on the site.
5.20 In December 2016, WSCC confirmed that it had completed the purchase of the 18.6
acre site and wished to transform the site into a quality employment and residential
space to provide a boost for small and innovative start-up businesses with the aim of
attracting businesses from the health and life science sector.
5.21 West Sussex County Council held two rounds of public consultations between
September and November 2018 with a view to submitting an outline planning
application later in 2018. An outline planning application (DC/18/2687) for up to 300
dwellings, up to 25,000sqm of employment (B1) floor space and provision of 618sqm
of flexible commercial/community space was submitted on 17 December 2018, was
granted planning permission at Full Council on 4th September 2019, and the S106 legal
agreement was signed on 11 February 2020. The covid pandemic and associated
lockdowns from March 2020 has slowed development but a contamination report was
discharged on 7 December 2021.
Policy 10 – Rural Economic Development
5.22 This policy relates to sustainable rural economic development and enterprise within the
District, which is encouraged in order to generate local employment opportunities and
economic, social and environmental benefits for local communities. The policy sets out
the criteria for when employment development within a countryside location is
acceptable.
5.23 The proposed indicator for the policy offset out within the HDPF monitoring framework
was to monitor the number of business uses granted planning permission outside of
the BUAB. To date, such data has been difficult to obtain to ensure it can be reliablyHorsham District Council – Authority Monitoring Report 2020/21
monitored, therefore a revised method of monitoring this policy indicator will be
investigated as part of the Local Plan Review.
Policy 11 – Tourism and Cultural Facilities
5.24 Policy 11 of the HDPF outlines where support from the Council will be given for
development proposals for tourism and cultural facilities within the district. The HDPF
monitoring framework (see Appendix 1) indicated that the number of C1 (Hotels), D1
(Non-Residential Institutions) and D2 (Assembly and Leisure) uses granted planning
permission in the monitoring year would be presented as a means to measure this
policy. To date, relevant data has been difficult to obtain to ensure it can be reliably
monitored, therefore a revised method of monitoring this policy indicator will be
investigated as part of the Local Plan Review.
5.25 In addition to the monitoring of policies set out above, the attendance rates at the
Horsham Museum, the Capitol and leisure centres were also identified as a measure
for this policy. The Council has recorded leisure centre attendance figures for the
2020/21 monitoring year and this is discussed later within this report under Policy 43.
Policies 12, 13 and 14 – Town Centre Uses
5.26 WSCC also monitors the total amount of floorspace which has come forward for ‘town
centre uses.’ This is illustrated in Table 7 for the 2020/21 monitoring year. This table
splits the sites into four key areas; town centres, sites outside town centres but within
built-up area boundaries, sites peripheral to built-up area boundaries, and sites outside
built-up area boundaries. Within these four categories, the table provides a breakdown
between previously developed land and not previously developed land and a summary
of each in each category.Horsham District Council – Authority Monitoring Report 2020/21 Table 7: Total Amount of Completed Floorspace for ‘Town Centre Uses’
Horsham District Council – Authority Monitoring Report 2020/21

       HDPF Chapter 6 - Housing

5.27   The monitoring of overall housing completions, affordable housing completions, the 5
       Year Housing Land Supply Position (5YHLS) and Gypsy, Traveller and Travelling
       Showpeople (GTTS) provision (i.e. policies 15, 16, 21, 22 and 23 of the HDPF) are
       dealt with in Chapter 3 of the AMR.

       Policy 17 – Exceptions Housing Schemes

5.28   Policy 17 of the HDPF relates to land that would not be released for general market
       housing, but may come forward for the development of affordable homes providing that
       the criteria within this policy are met. The HDPF monitoring framework states that the
       number of dwellings granted planning permission on ‘exceptions sites’ in accordance
       with Policy 17 of the HDPF would be monitored. There were no rural exceptions site
       permissions granted in the current monitoring year.

       Policy 18 – Retirement Housing and Specialist Care

5.29   Policy 18 of the HDPF outlines criteria for when proposals for retirement housing and
       specialist care would be supported, particularly where it is accessible by foot or public
       transport to local shops, services, community facilities and the wider public transport
       network. The HDPF monitoring framework states that the number of retirement
       dwellings/care homes approved would be monitored on an annual basis. See Table 8.

Table 8: Retirement Housing Permissions
   AMR                                                                                  Date
             Planning Ref   Site                                               Beds
   Year                                                                               Permitted
                            Land at Wellcross Farm Broadbridge
 2020/21     DC/19/1897                                                         141   27/5/2021
                            Heath

 2019/20     DC/19/0529     Riverside Court Station Road Pulborough              1    07/2/2020
 2018/19     DC/18/2131     Vehicle Garage Dukes Square Horsham                  7    08/03/209
                            Halebourne Development Site Old
 2016/17     DC/16/1329                                                         70    24/2/2017
                            Guildford Road Broadbridge Heath
                            The Anchorage Coombelands Lane
 2016/17     DC/16/1860                                                         40    21/12/2016
                            Pulborough
                            Berkeley Homes Development Site
 2014/15     DC/14/0590                                                         54    25/06/2015
                            Worthing Road Southwater
Horsham District Council – Authority Monitoring Report 2020/21
Policy 19- Park Homes and Residential Caravans
5.30 Policy 19 of the HDPF relates to park homes and residential caravan sites and
outlines where proposals for such development would be supported. The HDPF
monitoring framework confirms that the number of approved park homes and
residential caravans would be monitored on an annual basis. There were no park
home or residential caravan site permissions granted in the current monitoring year.
Policy 20 – Rural Workers’ Accommodation
5.31 Policy 20 of the HDPF relates to the development of rural worker accommodation
outside of the built-up area boundaries and outlines the criteria for where such
development would be supported. The HDPF monitoring framework proposes that the
number of planning permissions for dwellings outside the built-up area boundary would
be monitored to form an indicator for this policy.
Table 9: Rural Worker Dwellings Permissions
AMR Date
Planning Ref Site Dwellings
Year Permitted
2020/21 DC/20/1765 Millstones Stane Street Slinfold 1 19/3/2021
2020/21 DC/20/1008 Keepers Cottage Coltstaple Lane Horsham 1 9/10/2020
2020/21 DC/20/0937 Winterfold Farm Wimland Road Rusper 1 9/10/2020
2019/20 DC/19/1791 Aglands Farm Picts Lane Cowfold 1 29/10/2019
2019/20 DC/19/0610 The Meadows Fryern Road Storrington 1 17/07/2020
2018/19 DC/18/2733 Furnace Lake Stable Guildford Road Slinfold 1 13/03/2019
2018/19 DC/18/1326 Perrets Smithers Hill Lane Shipley 1 20/09/2018
High Copse Farm Broadford Bridge Road West
2018/19 DC/18/0466 1 23/05/2018
Chiltington
2017/18 DC/17/1452 Moralee Farm Haglands Lane West Chiltington 1 04/01/2018Horsham District Council – Authority Monitoring Report 2020/21
HDPF Chapter 7 - Strategic Allocations
Policy SD1 to SD9 – Strategic Policy: Land North of Horsham
5.32 Policy SD1 of the HDPF relates to the Land North of Horsham allocation, comprising
an area north of the A264, between Langhurstwood Road and Wimlands Road. This
area is allocated for a mixed used strategic development to accommodate at least
2,500 homes and associated infrastructure. Policy SD2 of the HDPF confirms that a
new high quality business park shall be provided of approximately 46,450m2, whilst the
local centre is intended to have retail provision of no more than 6,000m 2 under policy
SD3 of the HDPF.
5.33 An outline planning application for a mixed use scheme of 2,750 dwellings on Land
North of Horsham was permitted 1 March 2018 (DC/16/1677).
5.34 In December 2018 ownership of the site was transferred from Liberty Property Trust to
Legal & General.
5.35 Construction at the site is under way with the building of the new school under
application DC/19/1730 and 193 dwellings under application DC/20/2047.
5.36 It is currently projected that the first units will be delivered on the Land North of
Horsham site in 2021/22. The projected delivery trajectory for the land North of
Horsham strategic allocation is included in Table 8 below.
Table 8: Net Actual and Estimated Delivery of the Land North of Horsham Strategic
Development
2032-33+
2020-21
2021-22
2022-23
2023-24
2024-25
2025-26
2026-27
2027-28
2028-29
2029-30
2030-31
2031-32
Total
Land North Expected 0 30 150 150 150 131 100 100 100 100 100 100 1539 2750
of
Completed 0 0 0 0 0 0 0 0 0 0 0 0 0 0
HorshamHorsham District Council – Authority Monitoring Report 2020/21
Policy SD10 – Strategic Policy: Southwater Strategic Site
5.37 Policy SD10 of the HDPF relates to the Land West of Southwater site, which comprises
the area to the west of Worthing Road and to the south of Church Lane. This site was
allocated for housing, open space and community facilities to accommodate around
600 homes and associated infrastructure.
5.38 Since the publication of the HDPF in November 2015, 572 units on Land West of
Southwater has been granted in outline planning permission (DC/14/0590). Since the
granting of the outline permission, a reserved matters application for the erection 244
dwellings was approved in February 2016 (DC/15/2064) and development is underway.
In addition, a further reserved matters application for the provision of a sports pavilion,
community building and various sports pitches (DC/16/1919) was approved in March
2017. Another reserved matters application (DC/18/1246) for 214 dwellings was
approved in December 2018. The projected delivery trajectory for the Land West of
Southwater strategic allocation is included in table 9 below.
Table 9: Net Actual and Estimated Delivery of the Land West of Southwater Strategic
Development
2017-18
2018-19
2019-20
2020-21
2021-22
2022-23
2023-24
2024-25
2025-26
2026-27
2027-28
2028-29
2029-30
2030-31 Total
Land West Expected 0 0 0 0 62 62 62 62 62 37 0 0 0 0 347
of Southwater Completed 56 128 43 20 0 0 0 0 0 0 0 0 0 0 247
Policy SD11 – Strategic Policy: Land South of Billingshurst
5.39 Policy SD11 of the HDPF is a strategic policy in relation to the Land South of
Billingshurst allocation. It relates to two parcels of land located to the south of
Billingshurst, allocated for a housing development of around 150 dwellings. This land
comprises the area west of Marringdean Road to the south of Blackthorn Avenue and
land to the west of the recently approved A2 Dominion site.
5.40 A planning application on the Land South of Billingshurst allocation (2 separate sites)
for 87 dwellings (DC/15/0896) was approved (on the 9 September 2016) with a further
51 dwellings (DC/16/0274) approved in March 2017. The projected delivery trajectory
for the Land South of Billingshurst strategic allocation is included in table 10 below.Horsham District Council – Authority Monitoring Report 2020/21
The part of the allocation at Kingslea Farm, Marringdean Road (DC/15/0896) is
complete. The other part of the allocation still has 51 units left to build, and it is
expected that these will be completed between 2023 and 2025.
Table 10: Net Actual and Estimated Delivery of the Land South of Billingshurst Strategic
Development
2017-18
2018-19
2019-20
2020-21
2021-22
2022-23
2023-24
2024-25
2025-26
2026-27
2027-28
2028-29
2029-30
2030-31
Total
Land South Expected 0 0 0 0 0 0 25 26 0 0 0 0 0 0 51
of Billingshurst
74 10 3 0 0 0 0 0 0 0 0 0 0 0 87
(2 separate sites) CompletedHorsham District Council – Authority Monitoring Report 2020/21
HDPF Chapter 8 – Gypsy and Traveller Accommodation
5.41 Information on the monitoring of accommodation for Gypsies and Travellers is set out
in chapter three of the AMR.
HDPF Chapter 9 - Conserving and Enhancing the Natural and Built
Environment
Policy 24 – Strategic Policy: Environmental Protection
5.42 Policy 24 of the HDPF relates to environmental protection and states that
developments will be expected to minimise exposure to and the emission of pollutants
including noise, odour, air and light pollution, and moreover, to address land
contamination issues.
5.43 Within the district, there are declared Air Quality Management Areas (AQMAs) at
Cowfold and Storrington; the main reason for these designations comes from road
transport emissions. The air pollutant of most concern is nitrogen dioxide (NO2). The
Council’s Environmental Health Department provides an Annual Status Report2 for the
two AQMAs. The most recent report dates to June 2021 and is summarised in the
following paragraphs.
5.44 Significant reductions in NO2 concentrations were observed across all sites in 2020
averaging 15% relative to 2019. These can be attributed to reduced traffic volumes and
congestion due to the Covid pandemic. Long-term sites have shown a continuing
overall downward trend over the monitoring period, indicative of a gradual improvement
in fleet emissions.
5.45 The monitoring results for 2020 indicate that one monitoring location measured
concentrations within 10% of the annual mean objective for NO2: Storrington (jct of
Manley’s Hill and School Hill) which showed a 20% decrease from 2019. No other
monitoring sites within the district exceeded the air quality objectives for NO2 in 2020.
The Council would like to see the NO2 levels decrease to 10% below the annual mean
objective when corrected to the nearest residential exposure.
2
HDC Annual Status Report AQ 2020 - https://www.horsham.gov.uk/environmental-health/air-quality/what-
is-an-air-quality-management-areaHorsham District Council – Authority Monitoring Report 2020/21
5.46 Based on the 2020 monitoring data for NO2, the Council’s Environmental Health team
considered that the boundaries of the Storrington and Cowfold AQMAs can remain
unchanged. The Council is preparing a formal update of the Storrington and Cowfold
Air Quality Action Plan, which will involve public consultation.
5.47 In respect of particulate matter (PM10), automatic monitoring at the Horsham Park Way
site indicates that both the annual mean and 24-hour UK objective for PM10 were
compiled within 2020 and all the previous years of monitoring. Monitoring results
collated from three permanent monitoring sites in the South East region show that both
the annual mean and 24-hour UK objective for PM10 were complied with in 2020 and
all the previous years. Regional monitoring for PM2.5 has shown that the selected sites
complied with the national annual mean limit value in 2020 and all previous years.
5.48 Regional monitoring for PM2.5 has shown that the selected sites complied with the
national annual mean limit value in 2020 and all the previous years. All sites have
shown a decreasing trend throughout the monitoring period.
5.49 Detail of the actions the Council is taking to improve air quality in the district can be
found in the HDC Air Quality Annual Status report 20213.
Policy 25 and Policy 31 – Strategic Policy: The Natural Environment and District
Character; and Green Infrastructure and Biodiversity
5.50 Policy 25 of the HDPF relates to the natural environment and landscape character of
the District and aims to protect landscapes and habitats against inappropriate
development. Policy 31 of the HDPF relates to green infrastructure and biodiversity
which states that particular consideration will be given to the hierarchy of sites and
habitats in the district that includes Special Protection Areas (SPA), Special Areas of
Conservation (SAC), Sites of Special Scientific Interest (SSSIs), National Nature
Reserves (NNRs), Local Wildlife Sites (formally known as Sites of Nature Conservation
Importance (SNCIs)), Local Nature Reserves (LNR) and any areas of Ancient
Woodland.
3
HDC Annual Status Report AQ 2021 - https://www.horsham.gov.uk/environmental-health/air-quality/what-
is-an-air-quality-management-areaHorsham District Council – Authority Monitoring Report 2020/21
5.51 The Sussex Biodiversity Record Centre (SxBRC) monitors the condition of Sites of
Special Scientific Interest (SSSI) throughout Sussex. SSSIs are one of the most
important national environmental designations, covering sites of geological as well as
wildlife importance. The results are illustrated in tables 11 and 12 below, which allow
comparisons to be made between District and County levels. For Horsham District
41.1% of sites are considered to be in a favourable condition. This is a decrease of one
site compared to all previous AMRs.
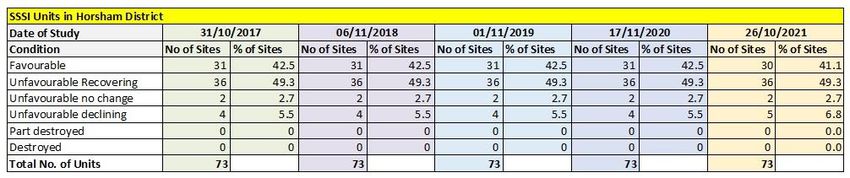
Table 11: Horsham District Sites Special Scientific Interest (SSSI) Site Condition
5.52 The remaining 58.9% of sites in Horsham are considered unfavourable. Although this
represents a majority of sites within the Horsham district, 49.3% are recovering through
careful management and there are no sites destroyed/part destroyed as there were in
previous monitoring years. Opportunities to maintain and enhance SSSI condition as
a consequence of nearby development will continue to be offered through the planning
system to continue the recovery process.
Figure 1: Horsham District SSSI Site Condition (2020/21)
5.53 At a wider county level, there has been a further marked drop (15) in the number of
favourable sites than last year. The number of recovering sites has increased by one.
There has been a further marked increase (14) in sites that are declining.
5.54 There is only a single destroyed SSSI Site in West Sussex (outside Horsham district)
and this is the same as previous monitoring periods.Horsham District Council – Authority Monitoring Report 2020/21
Table 12: West Sussex Sites of Special Scientific Interest (SSSI) Sites Condition
Figure 2: West Sussex County SSSI Site Condition 2020/21
Policy 26 – Strategic Policy: Countryside Protection
5.55 Policy 26 of the HDPF relates to the protection of the countryside from inappropriate
development and confirms that outside the built-up area boundaries, the rural character
and undeveloped nature of the countryside will be protected against inappropriate
development, unless it is essential to its countryside location and either supports the
needs of agriculture or forestry; enables the extraction of minerals or the disposal of
waste; provides a quiet informal recreational use; or enables the sustainable
development of rural areas.
5.56 The HDPF monitoring framework stated that the number of planning applications
approved outside the Built-up Area Boundary could be monitored in order to indicate
whether the policy was being complied with. The monitoring of this policy to date is set
out earlier in this chapter in relation to policy 3 in paragraphs 6.6-6.9.
Policy 27 – Strategic Policy: Settlement Coalescence
5.57 Policy 27 of the HDPF relates to settlement coalescence and confirms that
development between settlements will be resisted unless it meets the four criteriaHorsham District Council – Authority Monitoring Report 2020/21
listed. This includes whether there is no significant reduction in openness and that any
proposed development does not generate urbanising effects within the settlement gap.
5.58 The HDPF monitoring framework states that the district will monitor planning decisions
to note where ‘settlement coalescence’ has been considered as an issue in the
determination of a planning application/appeal. Two significant outline planning
applications (DC/18/0944) for 90 dwellings and (DC/18/2702) for 65 dwellings were
refused, in part, on settlement coalescence grounds. Further monitoring of these
policies will continue in the next monitoring period.
Policy 28 – Replacement Dwellings and House Extensions in the Countryside
5.59 Policy 28 of the HDPF relates to both replacement dwellings and house extensions
within the countryside (i.e. outside the Built-Up Area Boundary) and outlines the criteria
where such development would be supported.
5.60 The HDPF monitoring framework states that the number of new planning permissions
for replacement dwellings and/or extensions to dwellings within the countryside could
be monitored; however, given that no target has been set with regards to replacement
dwellings in the countryside (i.e. it is enabling policy), it is considered that an indicator
is unnecessary.
Policy 29 – Equestrian Development
5.61 Policy 29 of the HDPF is an enabling policy relating to equestrian development and
outlines the criteria where such development would be supported; namely that the
proposal would be appropriate in scale and level of activity, and be in keeping with its
location and surroundings.
5.62 The HDPF monitoring framework states that the number of new equestrian
developments could be monitored; however, given that no target has been set with
regards to new equestrian development, it is considered that an indicator is
unnecessary.Horsham District Council – Authority Monitoring Report 2020/21
Policy 30 – Protected Landscapes
5.63 Policy 30 of the HDPF relates to protected landscapes within the district. This includes
the High Weald Area of Outstanding Natural Beauty (AONB) within the north east
portion of the district, and the transition to the South Downs National Park (SDNP). The
SDNP is a separate planning authority area although the land remains in Horsham
District for other purposes. The policy states that: “Development proposals will be
supported in or close to protected landscapes where it can be demonstrated that there
will be no adverse impacts to the natural beauty and public enjoyment of these
landscapes as well as any relevant cross boundary linkages.”
5.64 The High Weald AONB body has completed a number of High Weald Joint Advisory
Committee (JAC) Annual Reviews, with the latest review published for the 2019/20
period4. The document identifies that the High Weald AONB responded to 158
planning application consultations received from local authorities across the AONB
during the 2019/20 period of which 19 were from Horsham District Council.
5.65 The review confirms that the High Weald AONB body were not engaged in any
Horsham District neighbourhood plans in the 2019/20 monitoring period. This is in part
because the Colgate Parish which is the main parish affected by the AONB is not
designated as a Neighbourhood Planning Area. Other relevant parishes are at the
early stages of plan preparation.
5.66 A revised High Weald AONB Management Plan5 was approved by the JAC in
December 2018 and adopted by Horsham District Council on 21 March 2019.
4
The High Weald Joint Advisory Committee Annual Review 2019/2020
http://www.highweald.org/about-the-high-weald-unit/annual-reviews/
5
The High Weald AONB Management Plan 2019-2024
http://www.highweald.org/high-weald-aonb-management-plan.htmlHorsham District Council – Authority Monitoring Report 2020/21
Policies 32 and 33 - The Quality of New Development and Development Principles
5.67 Policies 32 and 33 of the HDPF relate to good design and requires all development to
include high quality and inclusive design in the district based on a clear understanding
of the local, physical, social, economic, environmental and policy context for
development. Policy 33 (1) of the HDPF does aim to make efficient use of land, and
prioritise the use of previously developed land and buildings. The number and
percentages of new and converted dwellings on Greenfield and on previously
developed, ‘Brownfield’ land (PDL) has already been reported on in Chapter 3.
5.68 Policy 33 (9) of the HDPF relates to the incorporation of measures for new development
to reduce any actual or perceived opportunities for crime or antisocial behaviour on the
site and in the surrounding area. In general, Horsham district is a safe place to live.
Table 12 is a selective illustration of the crime type and notable offences reported in
the Horsham district from AMR Years 2015/16 to 2020/21 provided by the Police
recorded crime Community Safety Partnership6. (Note: this table differs from previous
AMRs as the source of the information and selected crime categories have changed)
Table 12: Horsham District selected recorded Crime Statistics
5.69 As can be seen from the table, the total number of recorded crimes in the selected
categories has decreased by 14.6% between the last two monitoring years. The biggest
increase related to drug offences while the biggest decreases related to robbery and
theft. It should be noted that although crime statistics can be affected by the design of
new buildings and public spaces (i.e. such a lack of public surveillance for new
development), crime rates are also substantially impacted by other factors, such as
economic recessions, poverty, deprivation, better reporting and an increasing
6
Police recorded crime Community Safety Partnership
https://www.gov.uk/government/statistics/police-recorded-crime-open-data-tablesHorsham District Council – Authority Monitoring Report 2020/21
population etc. The monitoring year 2020/21 was of course the first year of the Covid-
19 pandemic and associated lockdowns which may have affected these statistics.
Policy 34 - Cultural and Heritage Assets
5.70 Policy 34 of the HDPF relates to cultural and heritage assets and this policy states that
the Council will look to sustain and enhance its historic environment through positive
management of development affecting heritage assets. The policy outlines a number
of requirements for developments affecting cultural and heritage assets to satisfy.
5.71 Historic England holds a ‘Heritage at Risk’ register6 for the south east region that is
updated annually. To be considered for inclusion on the Register, buildings or
structures must be:
designated and included on the National Heritage List for England;
a grade I or II* listed building;
a grade II listed building in London;
a structural scheduled monument with upstanding remains; or
in secular (non-worship) use.
In addition, the risk assessment includes places of worship, conservation areas and
historic park and gardens. For Horsham District there were six entries on the risk
register that included one scheduled monument, two places of worship, two
archaeological entries and a single Conservation Area (Billingshurst). This is one less
than for the last period. The full details of the Risk Register are provided in Table 13
below.
6Historic England Heritage at Risk 2021 Registers
https://historicengland.org.uk/images-books/publications/har-2021-registers/Horsham District Council – Authority Monitoring Report 2020/21
Table 13: Historic England Heritage at Risk 2021 Register – South East
Site Address Designation Priority Previous Condition
Category Priority
Category
Ruins of Scheduled C C Poor
Sedgewick Monument, RPG
Castle, Moated grade II
site, Nuthurst
Parish Church of Listed Place of C C Poor
St Peter, Station Worship grade I,
Road, Cowfold CA
Parish Church of Listed Place of C C Poor
St Peter, Worship grade II*
Upper Beeding
Site Address Designation Trend Vulnerability Condition
Bowl Barrow on Scheduled Declining Plant Growth Generally
Black Hill, Colgate Monument unsatisfactory
with major
localised
problems
Alfoldean Roman Scheduled Declining Arable Extensive
site, Slinfold Monument Ploughing significant
problems
Billingshurst Conservation Deteriorating Medium Poor
Area
5.72 The priority categories are defined by Historic England in their report, with Category A
being the worst case and Category F being the best-case scenario. Category C that is
defined as ‘slow decay, no solution agreed’; and Category F that is defined as ‘repair
scheme in progress’. These heritage assets will be reviewed in 2022 by Historic
England. It is however considered that the majority of the sites at risk are in need of
repair. Some have received funding for these repairs to be completed.Horsham District Council – Authority Monitoring Report 2020/21
HDPF Chapter 9 -Climate Change
Policies 35, 36 and 37 - Strategic Policy: Climate Change
5.73 The Council is committed towards tackling climate change through land use policies
within the HDPF, that includes measures to improve the energy efficiency of new
developments, the promotion of decentralised, renewable and low carbon energy
supply systems (Policy 35 – Strategic Policy: Climate Change), the promotion of District
Heating and Cooling Systems (Policy 36 – Strategic Policy: Appropriate Energy Use)
and the sustainable construction and design of new development (Policy 37:
Sustainable Construction).
5.74 Horsham District Council sources its carbon emissions data from the Department for
Business, Energy & Industrial Strategy7 (DBEIS) and this information is considered to
be a key indicator pertaining to the above policies. However, there is a two-year time
delay in acquiring the information and such data is considered an ‘estimate’ and is
revised each year; the latest data was produced in June 2021 for the 2019 calendar
year. For a fifth consecutive year the figures have also retrospectively changed
compared to previous AMRs. This year's release also includes emissions from the
public sector. The figures in Table 14 are from a data subset which only includes
emissions estimates within the scope of influence of the Local Authority, and excludes
large industrial sites, railways, motorways and land-use.
5.75 As illustrated in the Table 14, per capita carbon emissions have been reduced
significantly since 2005 from 10.1 Kilotonnes per capita to 5.8 Kilotonnes per capita.
The industrial sector has seen the biggest reduction from a high in 2006 of 345.7
Kilotonnes of CO2 to 264.7 Kilotonnes of CO2 in 2019.
7Department for Business, Energy & Industrial Strategy
https://www.gov.uk/government/statistics/uk-local-authority-and-regional-carbon-dioxide-emissions-
national-statistics-2005-to-2019Horsham District Council – Authority Monitoring Report 2020/21
Table 14: Horsham District CO2 emissions 2005-2019
Units are in Kilotonnes of Carbon Dioxide.
Figure 14: Horsham District CO2 emissions 2005-2019
5.76 Policy 37 of the HDPF in part seeks to achieve satisfactory arrangements for all new
development for the storage of refuse and recyclable materials as an integral part of
the design, and moreover, seeks to minimise construction and demolition waste and to
utilise recycled and low impact materials.
5.77 In terms of recycling, Horsham district is performing well and for the 2020/21 monitoring
period, a total of 29,673 tonnes of household waste was recycled or composted. This
represents 55% of total household waste (53,785 tonnes) generated in the district.Horsham District Council – Authority Monitoring Report 2020/21
There has been a steady increase in the recycling rate since 2015. The overall amount
of household waste (including refuse, recycling and compost) collected per household
has increased by 5% since 2015.
Table 15: Horsham District Waste and Recycling 2020/21
AMR Year 2015/16 2016/17 2017/18 2018/19 2019/20 2020/21
Domestic Waste (t) 28,100 26,929 26,280 23,647 24,016 24,112
Domestic Mixed Dry
12,967 13,242 13,870 13,643 15,639
Recycling (t)
22,911
Garden Waste (t) 12,647 12,614 12,893 13,432 14,034
TOTAL (t) 51,090 52,543 52,136 50,229 51,091 53,785
Total Recycled (t) 22,991 25,614 25,865 26,676 27,231 29,673
Recycling Rate (%) 45% 49% 50% 53% 53% 55%
Total per Household (kg) 850 909 896 813 1010 856
5.78 West Sussex’s non-recycled household waste is currently taken to a landfill site at
Brookhurst Wood. Biffa and West Sussex County Council have signed a 25-year
contract to treat the County’s non-recycled black bag household rubbish at a
Mechanical Biological Treatment (MBT) facility at Brookhurst Wood, to the north of
Horsham. This flagship facility for West Sussex will ensure that the site continues to
process non-recycled waste, but in a more environmentally friendly and cost-effective
way. It will use a combination of sorting and treatment technologies to maximise the
amount of rubbish that is recycled or used as a resource by separating out metals which
will be sent for recycling, and using waste to create alternatives to fossil fuels for
industry and homes.
5.79 Planning permission was granted on appeal7 for a recycling, recovery and renewable
energy facility and ancillary infrastructure at the site of the Former Wealden Brickworks,
7
Appeal Decision WSCC/015/18/NH
https://acp.planninginspectorate.gov.uk/ViewCase.aspx?CaseID=3218965Horsham District Council – Authority Monitoring Report 2020/21
Langhurstwood Road, Horsham, under West Sussex County Council planning
application WSCC/015/18/NH on 27 February 2020.
Policy 38 – Strategic Policy: Flooding
5.80 During the 2020/21 monitoring year, there were three objections to planning
applications from the Environment Agency8 on flooding grounds and there were no
objections on water quality grounds. Table 16 shows Horsham District Council in
comparison to other local planning authorities within West Sussex.
Table 16: Environment Agency Objections (Flooding and Water Quality)
5.81 Of the objections in the Horsham Area two were due to an unsatisfactory Flood Risk
Analysis or Flood Consequence Assessment (FRA/FCA) and one was due to no
FRA/FCA being submitted.
8
Environment Agency objections to planning on the basis of flood risk
https://www.gov.uk/government/publications/environment-agency-objections-to-planning-on-the-basis-of-
flood-riskHorsham District Council – Authority Monitoring Report 2020/21
HDPF Chapter 10 - Infrastructure, Transport and Healthy Communities
Policy 39 – Strategic Policy: Infrastructure Provision
5.82 Policy 39 of the HDPF relates to infrastructure provision and confirms that
arrangements for new or improved infrastructure provision, will be secured by planning
obligations (S106 agreements), the Community Infrastructure Levy (CIL) and in some
circumstances, through planning conditions attached to a planning permission.
5.83 The Council publishes a separate Infrastructure Funding Statement9 on S106 and CIL
contributions and a summary is presented in Table 17.
Table 17: S106 and CIL Contributions Secured for the 2020/21 Monitoring Year
5.84 As illustrated in the table, the total monetary contribution towards infrastructure secured
through planning applications in the 2020/21 monitoring period was £4,337,876.69 with
by far the largest proportion (34.9%) of this income being collected for West Sussex
County Council education. In addition, this is the third full year of CIL receipts
amounting to £1,990,678.66, which is a 17.6% increase over the 2019/20 income of
£1,693,305.77.
9
Community Infrastructure Levy Report
https://www.horsham.gov.uk/planning/planning-policy/community-infrastructure-levy/cil-annual-reportHorsham District Council – Authority Monitoring Report 2020/21
Policy 40 – Sustainable Transport
5.85 Policy 40 of the HDPF relates to sustainable transport and confirms that in order to
manage the anticipated growth in demand for travel, development proposals which
promote an improved and integrated transport network, with a re-balancing in favour of
non-car modes as a means of access to jobs, homes, services, and facilities will be
encouraged and supported.
5.86 The Census for 2011 provides information on both the distance travelled to work by
residents in Horsham district, together with the mode of transport used to travel to work.
Of the 66,229 residents in employment aged between 16 and 74 the average distance
travelled to work in 2011 was 19km. Table 18 shows all the categories for the distances
travelled to work, out commuting from Horsham district.
Table 16: Distance Travelled to Work (Census 2011)
Percentages of
Distance Travelled Total Population population in
employment
Less than 2km 9,117 13.8%
2km to less than 5km 6,810 10.3%
5km to less than 10km 6,815 10.3%
10km to less than 20km 12,849 19.4%
20km to less than 30km 6,075 9.2%
30km to less than 40km 2,779 4.2%
40km to less than 60km 4,281 6.5%
60km and over 2,107 3.2%
Work mainly at or from home 9,683 14.6%
Other 5,783 8.7%
All categories 66,229 100%
5.87 The table illustrates that the distance most travelled to reach employment is 10 – 20km,
with 19.4% of the working population undertaking such a journey. The second highest
category are based at or close to home, (14.6% of the working population). It is noted
that there is a substantial proportion of people who travel a significant distance to work,
with at least 9,167 people travelling over 30km to get to work (or 13.9% of the working
population), and 2,107 people travelling 60km or more (3.2%).Horsham District Council – Authority Monitoring Report 2020/21
5.88 The 2011 Census also provides information on the modes of travel used to get to their
work destination. Table 19 illustrates which travel modes were the most used in the
district.
Table 19: Method of Travel to Work (Census 2011)
Method of Travel to Work Total Population Percentage of
working population
Underground, metro, light 102 0.2%
rail, tram
Train 4,719 7.1%
Bus, minbus or coach 1,161 1.8%
Taxi 77 0.1%
Work mainly at or from home 409 0.6%
Driving a car or van 43,221 65.3%
Passenger in a car or van 2,817 4.3%
Bicycle 1,121 1.7%
On foot 6,607 10.0%
Other method of travel to 370 0.6%
work
All categories 66,229 100%
5.89 As illustrated in the table, the main mode of transport used within Horsham district to
get to work was the private motor vehicle, at 65.3% of the working population. There is
a significant minority of the working population 10% (or 6,607 people) who walk to work,
and some 7.1% (or 4,719 people) who use the train. The overall results, and particularly
the reliance upon the private motor vehicle is not surprising given the rural nature of
the district, and moreover, the distances travelled by the working population outside of
the district, particularly to London and the south coast.Horsham District Council – Authority Monitoring Report 2020/21
Policy 41 – Parking
5.90 Horsham District Council operates several pay car parks in Horsham for which usage
data can be obtained. The data and indicator summarised below can also be used as
a proxy for the vitality and viability of Horsham Town Centre (see policies 12 and 13 of
the HDPF) more generally. Table 20 shows car parking ticket sales per annum and
compares that with previous years.
Table 20: Car Parking Figures (Horsham Town) since 2007/08
Year 2007/08 2008/09 2009/10 2010/11 2011/12 2012/13
Total
number
1,514,301 1,435,283 1,346,466 1,338,266 1,349,298 1,356,836
of ticket
sales
Year 2013/14 2014/15 2015/16 2016/17 2017/18 2018/19
Total
number
1,559,618 1,460,473 1,499,788 1,677,872 1,620,838 1,408,000
of ticket
sales
Year 2019/20 2020/21
Total
number
1,387,000 750,000
of ticket
sales
5.91 The figures for 2020/21 were down due to the impact of the Covid-19 pandemic. Both
the maintenance and refurbishment of existing car parks can impact the number of car
parking tickets sold each year; however, the indicator is considered to be robust given
the length of time over which monitoring has taken place. After the 2007/08 period the
number of visitors fell and remained around 1,350,000 until 2012/13, which was likely
due to the economic recession over this period post the 2008 financial crash. It also
predates the increase in housing numbers that have recently been developed in and
around Horsham town. The number of visitors to the town appeared to have recovered
from 2013/14 reaching a peak in 2016/17. However, the figures since then show a
downward trend over previous years and in 2019/20 were down 14.5% from the
2016/17 peak. This may in part be due to the demolition and rebuilding of Piries Place
Car Park between 18 June 2018 and 9 October 2019. The lockdowns related to the
Covid-19 pandemic has resulted in car park usage in 2020/21 dropping 46% year on
year to 750,000.Horsham District Council – Authority Monitoring Report 2020/21
Policy 42 – Strategic Policy: Inclusive Communities
5.92 Policy 42 of the HDPF aims to aid inclusive communities and to provide positive
measures which help create a socially inclusive and adaptable environment where the
needs of specific groups are met, such as Gypsies and Travellers, faith groups etc.
5.93 The Index of Deprivation10 produced by the former Ministry of Housing Communities
and Local Government (MHCLG) provides a useful indication of the overall level of
deprivation in a district by scoring a set of 38 indicators across seven distinct domains;
income, employment, health, education, housing, living environment and crime. To
allow districts to be compared, the Index combines all topics to produce a ranking
system containing all 326 local authorities within England. The ranking system is
presented on a scale of 1 (most deprived) to 326 (least deprived).
5.94 As the indices is a ranking system, it is important to remember that it is a comparison
against other local authorities; therefore, a high ranking does not necessarily mean
there is no deprivation within the district, it just means there is less deprivation
compared to that of other areas. The local authority level result also combines scores
from numerous smaller areas within that location, meaning that a high score could in
some circumstances, mask the fact that there are very localised pockets of severe
deprivation hidden within the district.
5.95 The Indices of Deprivation, 2019, is the latest year for figures to have been produced
by the former MHCLG and shows overall deprivation within the Horsham District to be
relatively low with only 36 local authorities in the rest of the UK considered to be less
deprived. However, this is a reduction to that reported in the 2015 Indices where only
31 authorities were considered to be less deprived.
5.96 Table 21 below compares 2019 County and local authority levels of deprivation against
the previous 2015 and 2010 results. Whilst the study only measures deprivation in
relative terms, all local authorities in West Sussex have declined in rankings from 2015-
2019 with the exception of Adur & Worthing which improved.
10
English indices of deprivation
https://www.gov.uk/government/collections/english-indices-of-deprivationHorsham District Council – Authority Monitoring Report 2020/21
Table 21: Indices of Multiple Deprivation (2010 - 2019)
County Level (ranking out of 152 upper tier authorities)
Change
Rank Rank Rank
2015-
2019 2015 2010
2019
West Sussex 125 130 130 -5
East Sussex 93 99 90 -6
Hampshire 136 141 141 -5
Brighton & Hove 89 76 53 13
Surrey 147 150 150 -3
Local Authority (ranking out of 317)
Published Published Published Change
Rank Rank Rank 2015-
2019 2015 2010 2019
Adur 169 150 145 19
Arun 156 174 154 -18
Chichester 225 231 222 -6
Crawley 149 151 170 -2
Horsham 290 295 304 -5
Mid Sussex 311 321 315 -10
Worthing 175 172 160 3
5.97 Table 21 shows that in 2019, Horsham was ranked 290 out of 317 authorities. This
means that approximately 90 % of all local authorities within the UK experienced higher
levels of deprivation than can be found in Horsham District. It should be noted that this
is an average; therefore, a wide range of deprivation scores could be present within
the smaller area of Horsham district.Horsham District Council – Authority Monitoring Report 2020/21
Policy 43 – Community Facilities, Leisure and Recreation
5.98 Policy 43 of the HDPF relates to community facilities, leisure and recreation and
outlines where the provision of new and improved community facilities or services will
be supported, particularly where developments of this nature would be in accordance
with the Development Hierarchy (policy 3 of the HDPF) or Strategic Development
locations.
5.99 Horsham District Council monitors the throughput for the district’s leisure centres each
year. Due to the lockdown imposed as a response to the Covid-19 pandemic the sports
and leisure centres were closed for much of the time and consequently the usage figure
of 396,420 is well down on the previous record total of 1,134,600 visitors in the 2019/20
monitoring period. Table 22 below shows the total throughput for HDC Leisure Centres
per annum since 2011/12.
Table 22: Horsham District Council Leisure Centres Attendance since 2011/12
HDC Sport Centres
Monitoring Total Per cent
Year throughput change
2020/21 396,420 -65.0%
2019/20 1,134,600 4.2%
2018/19 1,087,307 2.8%
2017/18 1,057,591 6.5%
2016/17 993,335 -2.9%
2015/16 1,023,524 -2.7%
2014/15 1,052,102 -1.7%
2013/14 1,069,978 10.2%
2012/13 970,771 -2.3%
2011/12 993,697
5.100 There were two leisure developments completed within the 2020/21 monitoring period
with a gross floor space of 633 sq. m. as detailed in Table 22a. The majority of which
(578 sq.m.) was from the opening of the Moving Mountains Ski Centre in Small Dole.You can also read