NAPIER WASTEWATER TREATMENT PLANT - Independent Evaluation of Performance June 2021 - Say It Napier logo
←
→
Page content transcription
If your browser does not render page correctly, please read the page content below
NAPIER WASTEWATER TREATMENT PLANT
                         Independent Evaluation of Performance
                                                     June 2021

                                                   Prepared for:
                                              Napier City Council
                                                Private Bag 6010
                                                     Napier 4142

SLR Ref: 710.30134-R01
Version No: -v0.6
July 2021
Napier City Council                                                                         SLR Ref No: 710.30134-R01-v0.6-20210701.docx
Napier Wastewater Treatment Plant                                                                                               July 2021
Independent Evaluation of Performance
June 2021

PREPARED BY
                                               SLR Consulting NZ Limited
                                               Company Number 2443058
                                               Level 4, 12 O'Connell Street
                                               Auckland 1010 New Zealand

                                               T: 0800 757 695
                                               E: auckland@slrconsulting.com www.slrconsulting.com

BASIS OF REPORT
                                               This report has been prepared by SLR Consulting NZ Limited (SLR) with all reasonable skill,
                                               care and diligence, and taking account of the timescale and resources allocated to it by
                                               agreement with Napier City Council (the Client). Information reported herein is based on
                                               the interpretation of data collected, which has been accepted in good faith as being
                                               accurate and valid.

                                               This report is for the exclusive use of the Client. No warranties or guarantees are
                                               expressed or should be inferred by any third parties. This report may not be relied upon
                                               by other parties without written consent from SLR.

                                               SLR disclaims any responsibility to the Client and others in respect of any matters outside
                                               the agreed scope of the work.

DOCUMENT CONTROL
Reference                       Date                     Prepared                   Checked                    Authorised
710.30134-R01-v0.6              1 July 2021              Neville Tawona and Dr.     Peter Cupitt               Peter Cupitt
                                                         Lisa Hack
710.30134-R01-v0.6              29 June 2021             Neville Tawona and Dr.     Peter Cupitt               Peter Cupitt
                                                         Lisa Hack
710.30134-R01-v0.5              22 June 2021             Dr. Lisa Hack and          Draft
                                                         Neville Tawona
710.30134-R01-v0.4-v0.2         22 June 2021             Dr. Lisa Hack and          Draft
                                                         Neville Tawona

                                                                 Page 2
Napier City Council                                                        SLR Ref No: 710.30134-R01-v0.6-20210701.docx
 Napier Wastewater Treatment Plant                                                                              July 2021
 Independent Evaluation of Performance
 June 2021

EXECUTIVE SUMMARY
Approval for marine discharge was granted by Hawkes Bay Regional Council via the 2012 Resource Consent
Coastal Permit (RCCP) (No. CD090514W (now referred to as AUTH-118503-02)). The RCCP had 37 conditions
which described requirements for effluent quality and environmental monitoring at the Napier Wastewater
Treatment Plant (WWTP). The RCCP was reviewed on 30 May 2019, taking effect on 02 October 2019 with
Conditions 38 - 41 added in relation to updating the Quantitative Microbial Risk Assessment (QMRA). Conditions
38-41 relating to the Quantitative Microbial Risk Assessment (QMRA) have been addressed in a separate report
to Napier City Council.

Conditions 1 to 5 relate to maximum discharge via the ocean outfall, and diffusion.

         All conditions relating to flow rates and diffusion have been complied with.

Conditions 6 to 16 describe the approved treatment methods and loadings; concentration and load limits for
pollutants and analytes at discharge; and toxicity effects of the combined wastewater discharged at Hawkes Bay.

         The treatment process complies with the approved methods, however annual average loading rates to
         the BTF filter media consistently exceeded the RCCP limit of 0.6 kg/m3 media/day. The exceedances have
         been linked to industrial flows from the Pandora Industrial Area. Notwithstanding the higher loading
         rates to the BTF plant, the cBOD5 removal efficiency of the BTF system is high, indicating that the
         biological treatment process is performing adequately. It is understood the design capacity of the BTF
         is 50% higher which confirms the results under these conditions.

         Funding has been allocated over a three-year period to investigate additional treatment options for both
         the Pandora and Awatoto tradewaste customers in addition to re-routing the Awatoto tradewaste
         influent to the headworks of the WWTP. Masterplanning for the WWTP is also being undertaken to look
         at the present level of treatment, account for potential future treatment levels in conjunction with
         projected population growth, sea level rise and climate change over the next thirty years.

         Concentrations of pollutants in combined wastewater complied with the RCCP limits except for Total
         Ammonia-N and Zinc (Condition 7). NCC increased engagements with tradewaste customers along
         Pandora Industrial Area following the Total Ammonia-N exceedances (note that these exceedances were
         recorded twice on isolated events). Elevated zinc concentrations were recorded on a few occasions in
         2019 and 2020 and NCC will continue to monitor zinc concentrations to assess any ongoing issues with
         this analyte.

Condition 8 relates to the analytes cBOD5, TSS, TFO&G and pH.

         pH values recorded over the monitoring period were 100% compliant. Both the average TSS loading
         rate (based on a 12 month rolling average) and maximum TSS loading rate exceeded the consent limits.
         Average cBOD5 loads of effluent discharged (based on a 12 month rolling average) complied with the
         limit, however the maximum cBOD5 daily loading rate in the final effluent exceeded the cBOD5 consent
         limit on a few occasions. The maximum daily monitored TFO&G load exceeded the limit on a few
         occasions. The average TFO&G load (based on a 12 month rolling average) exceeded the consent limit
         in November 2020. The high TSS has been attributed to high rainfall events as well as potential inputs
         from Awatoto Industries, while the elevated cBOD5 and TFO&G loads have been largely linked to
         operations discharging into the Awatoto industrial line.

                                                      Page 3
Napier City Council                                                          SLR Ref No: 710.30134-R01-v0.6-20210701.docx
 Napier Wastewater Treatment Plant                                                                                July 2021
 Independent Evaluation of Performance
 June 2021

EXECUTIVE SUMMARY

Conditions 9 to 16 relate to the outfall pipe and the surrounding environment.

         All conditions relating to the outfall pipe and the surrounding environment have been met. It is also
         noted that the repair to the leak in the outfall pipeline identified in early 2020 at 630m offshore was
         successfully completed on 25 October 2020. The leak at 700m (identified in 2018) was completed on 01
         February 2021.

Conditions 17 to 28 outline requirements for monitoring environmental performance of the WWTP.

         All conditions relating to monitoring performance have been met. From the quarterly BTF performance
         monitoring, significant fluctuations were observed in the TSS, cBOD5 and oil and grease concentrations
         in the raw wastewater which could be attributed to the industrial/trade waste contributions. From a
         trend analysis of the quarterly results, data indicated potential reduction on BTF treatment
         performance, however it is recommended that NCC conduct further investigations particularly an
         assessment of the incoming wastewater quality from industrial trade waste customers to validate the
         assumption. There are a number of other factors that could influence biological treatment capacity,
         which could be investigated as part of a plant-wide process capability and capacity assessment.

Conditions 29 to 41 relate to various matters including signage at the ocean diffuser advising that ‘shellfish unfit
for human consumption’, the appointment of a contact person at the WWTP, preparation of management plans,
availability of records and reporting, complaints procedures, the continuation of liaison through the Kaitiaki
Liaison Group (KLG) and updating the Quantitative Microbial Risk Assessment (QMRA).

         Conditions 29 to 37 have been complied with. Commentary has also been provided for Condition 38
         and 39.

The capability of the Napier WWTP to comply with the conditions of the Resource Consent Coastal Permit (RCCP)
is in part reliant on the tradewaste customers complying with their discharge licence limitations. Random
impromptu sampling is necessary within the Awatoto and Pandora Industrial Zones to identify businesses failing
to comply with their discharge limitations. In lieu of licence revocation threats and penalties for repeat
offenders, non-complying tradewaste customers could be directed to engage wastewater specialists to advise
on enhancements their treatment capability to satisfy their discharge obligations.

Although the Napier WWTP is currently complying with the operational requirements imposed by Hawkes Bay
Regional Council, the capacity to accept additional loads in line with projected population and trade waste
growth, sea level rise and climate change may not be possible without process enhancements. Scrutiny of the
existing performance may reveal fundamental changes to the process train may improve the robustness,
longevity, and performance of the existing WWTP. This may include re-routing of flows, blending, chemical
dosing or supplementary processes which focus on the analytes of concern.

The vulnerability of discharge compliance is also affected by the quality of the Awatoto tradewaste effluent
which bypasses the WWTP. The master planning may investigate the merits of diverting this influent to the inlet
works or to a supplementary process train or installing real time inline sensors with 4G capability to alert of non-
compliances which initiates action.

                                                       Page 4
Napier City Council                                                     SLR Ref No: 710.30134-R01-v0.6-20210701.docx
 Napier Wastewater Treatment Plant                                                                           July 2021
 Independent Evaluation of Performance
 June 2021

ABBREVIATIONS

ANZECC             Australian and New Zealand Environment Conservation Council

BOD                Biological Oxygen Demand

BTF                Biological Tricking Filter

cBOD5              Carbonaceous Biochemical Oxygen Demand

DO                 Dissolved Oxygen

NTU                Turbidity

RCCP               Resource Consent Coastal Permit

TFO&G              Total Fats Oils and Grease

TSS                Total Suspended Solids

WWTP               Wastewater Treatment Plant

QMRA               Quantitative Microbial Risk Assessment

                                                      Page 5
Napier City Council                                                                                                      SLR Ref No: 710.30134-R01-v0.6-20210701.docx
Napier Wastewater Treatment Plant                                                                                                                            July 2021
Independent Evaluation of Performance
June 2021

      CONTENTS
      1             BACKGROUND AND PURPOSE OF REPORT ................................................................ 12
      2             SCOPE OF STUDY AND METHODS .............................................................................. 12
      2.1           Terms of Reference for Review .................................................................................. 12
      2.2           Information Reviewed................................................................................................ 13
      3             NAPIER CITY WASTEWATER TREATMENT PLANT ....................................................... 13
      4             ENVIRONMENTAL LICENSE ........................................................................................ 15
      5             DETAILED FINDINGS................................................................................................... 16
      5.1           General ...................................................................................................................... 16
      5.2           Condition 2 – Provision of Discharge .......................................................................... 16
      5.2.1         Condition............................................................................................................................................... 16
      5.2.2         Analysis of data ..................................................................................................................................... 16
      5.2.3         Compliance ........................................................................................................................................... 16

      5.3           Condition 3 – Flow Rates ............................................................................................ 16
      5.3.1         Condition............................................................................................................................................... 16
      5.3.2         Source of Data ....................................................................................................................................... 17
      5.3.3         Analysis of Data ..................................................................................................................................... 17
      5.3.4         Compliance ........................................................................................................................................... 18

      5.4           Condition 4 – Location of outfall structure ................................................................. 18
      5.4.1         Condition............................................................................................................................................... 18
      5.4.2         Source of Data ....................................................................................................................................... 18
      5.4.3         Analysis of Data ..................................................................................................................................... 18
      5.4.4         Compliance ........................................................................................................................................... 18

      5.5           Condition 5 – Marine Outfall Diffuser ......................................................................... 19
      5.5.1         Condition............................................................................................................................................... 19
      5.5.2         Source of Data ....................................................................................................................................... 19
      5.5.3         Analysis of Data ..................................................................................................................................... 19
      5.5.4         Compliance ........................................................................................................................................... 19

      5.6           Condition 6 – Treatment Process and Biological Trickling Filter Loading ..................... 19
      5.6.1         Condition............................................................................................................................................... 19
      5.6.2         Source of Data ....................................................................................................................................... 19
      5.6.3         Analysis of Data ..................................................................................................................................... 20
      5.6.4         Compliance ........................................................................................................................................... 22

      5.7           Condition 7 – Concentrations in Combined Wastewater............................................. 22
      5.7.1         Condition............................................................................................................................................... 22
      5.7.2         Source of Data ....................................................................................................................................... 23

                                                                                   Page 6
Napier City Council                                                                                                      SLR Ref No: 710.30134-R01-v0.6-20210701.docx
Napier Wastewater Treatment Plant                                                                                                                            July 2021
Independent Evaluation of Performance
June 2021

      CONTENTS
      5.7.3         Analysis of Data ..................................................................................................................................... 23
      5.7.4         Compliance ........................................................................................................................................... 34

      5.8           Condition 8 – Analytes in Combined Wastewater ....................................................... 34
      5.8.1         Condition............................................................................................................................................... 34
      5.8.2         Source of Data ....................................................................................................................................... 34
      5.8.3         Analysis of Data ..................................................................................................................................... 35
      5.8.4         Compliance ........................................................................................................................................... 38

      5.9           Condition 9 – Discharge Screen Size ........................................................................... 38
      5.9.1         Condition............................................................................................................................................... 38
      5.9.2         Source of Data ....................................................................................................................................... 38
      5.9.1         Analysis of Data ..................................................................................................................................... 38
      5.9.2         Compliance ........................................................................................................................................... 38

      5.10          Conditions 10 – 12 ..................................................................................................... 38
      5.11          Condition 13 – Changes in Seawater Around the Outfall............................................. 39
      5.11.1        Condition............................................................................................................................................... 39
      5.11.2        Source of Data ....................................................................................................................................... 39
      5.11.3        Analysis of Data ..................................................................................................................................... 40
      5.11.4        Compliance ........................................................................................................................................... 41

      5.12          Condition 14 - Ecotoxicity ........................................................................................... 42
      5.12.1        Condition............................................................................................................................................... 42
      5.12.2        Source of Data ....................................................................................................................................... 42
      5.12.3        Analysis of Data: Cawthron Reports........................................................................................................ 43
      5.12.4        Compliance ........................................................................................................................................... 43

      5.13          Condition 15 – Outfall Diffuser ................................................................................... 43
      5.13.1        Condition............................................................................................................................................... 43
      5.13.2        Analysis of Data ..................................................................................................................................... 43
      5.13.3        Compliance ........................................................................................................................................... 43

      5.14          Condition 16 – Outfall Pipe and Diffuser..................................................................... 44
      5.14.1        Condition............................................................................................................................................... 44
      5.14.2        Analysis of Data ..................................................................................................................................... 44
      5.14.3        Compliance ........................................................................................................................................... 44

      5.15          Condition 17 – Discharge Measurement ..................................................................... 44
      5.15.1        Condition............................................................................................................................................... 44
      5.15.2        Analysis of Data ..................................................................................................................................... 44
      5.15.3        Compliance ........................................................................................................................................... 44

      5.16          Condition 18 – Toxicity Testing ................................................................................... 45

                                                                                   Page 7
Napier City Council                                                                                                      SLR Ref No: 710.30134-R01-v0.6-20210701.docx
Napier Wastewater Treatment Plant                                                                                                                            July 2021
Independent Evaluation of Performance
June 2021

      CONTENTS
      5.16.1        Condition............................................................................................................................................... 45
      5.16.2        Analysis of Data ..................................................................................................................................... 45
      5.16.3        Compliance ........................................................................................................................................... 45

      5.17          Condition 19 – Analyte Testing on Consecutive Days .................................................. 45
      5.17.1        Condition............................................................................................................................................... 45
      5.17.2        Source of Data ....................................................................................................................................... 45
      5.17.3        Analysis of Data ..................................................................................................................................... 45
      5.17.4        Compliance ........................................................................................................................................... 46

      5.18          Condition 20 – Quarterly Biological Trickling Filter Performance Monitoring .............. 46
      5.18.1        Condition............................................................................................................................................... 46
      5.18.2        Source of Data ....................................................................................................................................... 46
      5.18.3        Analysis of Data ..................................................................................................................................... 46
      5.18.4        Compliance ........................................................................................................................................... 48

      5.19          Condition 21 – Norovirus ........................................................................................... 49
      5.19.1        Condition............................................................................................................................................... 49
      5.19.2        Source of Data ....................................................................................................................................... 49
      5.19.3        Analysis of Data ..................................................................................................................................... 49
      5.19.4        Compliance ........................................................................................................................................... 49

      5.20          Condition 22 – Faecal Coliforms and Enterococci........................................................ 49
      5.20.1        Condition............................................................................................................................................... 49
      5.20.2        Source of Data ....................................................................................................................................... 49
      5.20.3        Analysis of Data ..................................................................................................................................... 50
      5.20.4        Compliance ........................................................................................................................................... 52

      5.21          Condition 23 – Seabed Sediment Samples .................................................................. 52
      5.21.1        Condition............................................................................................................................................... 52
      5.21.2        Source of Data ....................................................................................................................................... 52
      5.21.3        Analysis of Data ..................................................................................................................................... 52
      5.21.4        Compliance ........................................................................................................................................... 57

      5.22          Condition 24 – Quarterly Seawater Sampling ............................................................. 58
      5.22.1        Condition............................................................................................................................................... 58
      5.22.2        Source of Data ....................................................................................................................................... 58
      5.22.3        Analysis of Data ..................................................................................................................................... 58
      5.22.4        Compliance ........................................................................................................................................... 64

      5.23          Condition 25 – GPS Drogue ........................................................................................ 65
      5.23.1        Condition............................................................................................................................................... 65
      5.23.2        Source of Data ....................................................................................................................................... 65

                                                                                   Page 8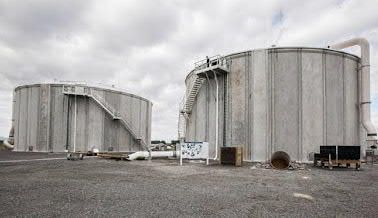
Napier City Council                                                                                                      SLR Ref No: 710.30134-R01-v0.6-20210701.docx
Napier Wastewater Treatment Plant                                                                                                                            July 2021
Independent Evaluation of Performance
June 2021

      CONTENTS
      5.23.3        Analysis of Data ..................................................................................................................................... 65
      5.23.4        Compliance ........................................................................................................................................... 65

      5.24          Condition 26 – Benthic Fauna ..................................................................................... 65
      5.24.1        Condition............................................................................................................................................... 65
      5.24.2        Source of Data ....................................................................................................................................... 66
      5.24.3        Analysis of Data ..................................................................................................................................... 66
      5.24.4        Compliance ........................................................................................................................................... 66

      5.25          Condition 27 – Microbial Risk Assessment .................................................................. 66
      5.25.1        Condition............................................................................................................................................... 66
      5.25.2        Source of Data ....................................................................................................................................... 66
      5.25.3        Analysis of Data ..................................................................................................................................... 66
      5.25.4        Compliance ........................................................................................................................................... 67

      5.26          Condition 28 – Effluent Quality Analysis ..................................................................... 67
      5.26.1        Condition............................................................................................................................................... 67
      5.26.2        Analysis of Data ..................................................................................................................................... 67
      5.26.3        Compliance ........................................................................................................................................... 67

      5.27          Condition 38 – Quantitative Microbial Risk Assessment ............................................. 67
      5.27.1        Condition............................................................................................................................................... 67
      5.27.2        Analysis of Data ..................................................................................................................................... 68

      5.28          Condition 39 .............................................................................................................. 68
      5.28.1        Condition............................................................................................................................................... 68
      5.28.2        Analysis of Data ..................................................................................................................................... 69

      6             PUBLIC CONSULTATION FEEDBACK ........................................................................... 69
      7             RECOMMENDATIONS ................................................................................................ 69

      DOCUMENT REFERENCES
      TABLES
      Table 1         cBOD5 loading and removal efficiency of biological trickling filter media .................. 21
      Table 2         Analyte consent limits for concentrations and loads ................................................ 22
      Table 3         Combined Wastewater analytes concentration and loads (Monitored vs Limits) ...... 23
      Table 4         Analyte average and maximum loads consent limits ................................................ 34
      Table 5         Analytes for combined wastewater stream and applicable detection limit ............... 45
      Table 6         ANZECC marine trigger limits compared with Schedule 2 detection limits ................ 52
      Table 7         ANZECC 2000 trigger values – marine environment ................................................. 58
      Table 8         RCCP limits for temperature and dissolved oxygen .................................................. 59
      Table 9         Median concentrations of faecal coliforms at various distances ............................... 59

                                                                                   Page 9
Napier City Council                                                                               SLR Ref No: 710.30134-R01-v0.6-20210701.docx
Napier Wastewater Treatment Plant                                                                                                     July 2021
Independent Evaluation of Performance
June 2021

      CONTENTS
      Table 10        Median and maximum enterococci counts............................................................... 61
      Table 11        Public engagement comments and responses.......................................................... 69

      FIGURES
      Figure 1        Daily discharges of combined effluent from the WWTP ........................................... 17
      Figure 2        Annual average discharge volumes (combined flows) .............................................. 18
      Figure 3        Annual average daily loading to BTF system based on bi-weekly data ...................... 21
      Figure 4        Graph of NH4-N concentrations in combined wastewater ........................................ 25
      Figure 5        Graph pf NH4- loads in combined wastewater ......................................................... 25
      Figure 6        Graph of Cadmium concentrations in combined wastewater ................................... 26
      Figure 7        Graph of Cadmium loads in combined wastewater .................................................. 26
      Figure 8        Graph of Chrome III concentrations in combined wastewater .................................. 27
      Figure 9        Graph of Chrome III loads in combined wastewater ................................................. 27
      Figure 10       Graph of Chrome VI concentrations in combined wastewater.................................. 28
      Figure 11       Graph of Chrome VI loads in combined wastewater................................................. 28
      Figure 12       Graph of Copper concentrations in combined wastewater....................................... 29
      Figure 13       Graph of Copper loads in combined wastewater ...................................................... 29
      Figure 14       Graph of Lead concentrations in combined wastewater........................................... 30
      Figure 15       Graph of Lead loads in combined wastewater.......................................................... 30
      Figure 16       Graph of Mercury concentrations in combined wastewater ..................................... 31
      Figure 17       Graph of Mercury Loads in combined wastewater ................................................... 31
      Figure 18       Graph of Nickel concentrations in combined wastewater ........................................ 32
      Figure 19       Graph of Nickel loads in combined wastewater........................................................ 32
      Figure 20       Graph of Zinc concentrations in combined wastewater............................................ 33
      Figure 21       Graph of Zinc loads in combined wastewater ........................................................... 33
      Figure 22       cBOD5 daily loads and 12 month rolling average vs Limits ........................................ 35
      Figure 23       TSS daily loads and 12 month rolling average vs Limits............................................. 36
      Figure 24       TFO&G daily loads and 12 month rolling average vs Limits ....................................... 37
      Figure 25       Quarterly pH values vs limits.................................................................................... 37
      Figure 26       Dissolved Oxygen Concentration during the monitoring period ............................... 40
      Figure 27       Temperature recorded during the monitoring period .............................................. 41
      Figure 28       Quarterly biological trickling filter performance – TSS monitoring............................ 47
      Figure 29       Quarterly biological trickling filter performance – cBOD5 monitoring........................ 47
      Figure 30       Quarterly biological trickling filter performance – oil and grease monitoring ........... 48
      Figure 31       Quarterly monitoring of faecal coliforms in combined wastewater .......................... 51
      Figure 32       Quarterly monitoring of enterococci in combined wastewater ................................ 51
      Figure 33       Bi-annual arsenic monitoring ................................................................................... 53
      Figure 34       Bi-annual cadmium monitoring ................................................................................ 53
      Figure 35       Bi-annual chromium monitoring .............................................................................. 54
      Figure 36       Bi-annual copper monitoring ................................................................................... 54
      Figure 37       Bi-annual mercury monitoring ................................................................................. 55
      Figure 38       Bi-annual nickel monitoring ..................................................................................... 55
      Figure 39       Bi-annual lead monitoring........................................................................................ 56
      Figure 40       Bi-annual tin monitoring .......................................................................................... 56
      Figure 41       Bi-annual zinc monitoring ........................................................................................ 57

                                                                    Page 10
Napier City Council SLR Ref No: 710.30134-R01-v0.6-20210701.docx
Napier Wastewater Treatment Plant July 2021
Independent Evaluation of Performance
June 2021
CONTENTS
Figure 42 Quarterly faecal coliforms monitoring since commissioning ..................................... 59
Figure 43 Quarterly enterococci monitoring since commissioning ........................................... 60
Figure 44 Quarterly pH monitoring during monitoring period.................................................. 61
Figure 45 Quarterly turbidity monitoring during monitoring period ............................................. 62
Figure 46 Quarterly temperature monitoring during monitoring period .................................. 63
Figure 47 Quarterly dissolved oxygen monitoring during monitoring period............................ 64
PHOTOS
Photo 1 Napier Wastewater Treatment Plant Milliscreen...................................................... 13
Photo 2 Napier Wastewater Treatment Plant Biological Treatment Filters ............................ 14
APPENDICES
Appendix A Resource Consent – Coastal Permit
Appendix B Public Consultation Materials
Page 11Napier City Council SLR Ref No: 710.30134-R01-v0.6-20210701.docx
Napier Wastewater Treatment Plant July 2021
Independent Evaluation of Performance
June 2021
1 Background and Purpose of Report
Napier City Wastewater Treatment Plant (WWTP) discharges via a marine outfall 1.5km into Hawke Bay.
Approval for marine discharge was granted by Hawkes Bay Regional Council via the 2012 Resource Consent
Coastal Permit (RCCP) (No. CD090514W (now referred to as AUTH-118503-02)). The RCCP had 37 conditions
which describe requirements for effluent quality and environmental monitoring at the Napier Wastewater
Treatment Plant (WWTP). The RCCP was reviewed on 30 May 2019, taking effect on 02 October 2019 with
Conditions 38-41 added in relation to updating the Quantitative Microbial Risk Assessment (QMRA).
Commentary regarding Conditions 38 and 39 relating to the Quantitative Microbial Risk Assessment (QMRA)
have also been addressed.
The RCCP relates to major improvements at the WWTP which were commissioned in 2014 and include the
addition of a biological trickling filter plant (BTF).
This report addresses Condition 11ii) of the RCCP, which requires an evaluation of performance of the plant each
3 years following commissioning of the biological trickling filter plant. This evaluation builds on 2018 WWTP
performance evaluation report1 and includes, but is not necessarily limited to, a summary of monitoring results,
a report on non-compliances, an evaluation of information indicating trends (including favourable
environmental outcomes or any emerging adverse effects); and an opportunity for public response.
2 Scope of Study and Methods
2.1 Terms of Reference for Review
The scope of activities for the SLR review is as follows:
a. Source testing and analysis data, reports and photographs related to the operation and performance of the
WWTP since commissioning;
b. Summarise compliance conditions and limitations specified in the RCCP consent no. CD090514W (now
referred to as AUTH-118503-02);
c. Provide commentary regarding the extent of compliance to conditions (where required);
d. Collate and tabulate existing performance based on the testing results;
e. Graphically represent the treated effluent quality relative to the RCCP limitation condition for all specified
chemical and biological analytes;
f. Note any non-compliances;
g. Note any adverse or favourable environmental trends;
h. Collate the results into a concise clear report suitable for public exhibition; and
i. Identify potential mitigation options to ameliorate adverse environmental effects supplementary to the
report.
1
Napier Wastewater Treatment Plant: Independent Evaluation of Performance. SLR Report, August 2018
Page 12Napier City Council SLR Ref No: 710.30134-R01-v0.6-20210701.docx
Napier Wastewater Treatment Plant July 2021
Independent Evaluation of Performance
June 2021
2.2 Information Reviewed
This study has included a desktop review of the following information made available by Napier Council:
(1) Compliance monitoring reports prepared by Hawkes Bay Regional Council for the reporting periods
between July 2018 to June 2020;
(2) Benthic sediment testing results 300m, 500m and 1km from the outfall diffuser midpoint;
(3) Biological and chemical analyte concentrations of the raw wastewater, and treated effluent;
(4) Annual performance monitoring reports;
(5) Aquatic toxicology reports;
(6) Napier Wastewater Outfall Technical Monitoring & Assessment Report (NCC, 2020);
(7) Review of microbial contaminant data associated with Napier wastewater outfall (NIWA, 2020);
(8) Napier City Council wastewater discharge monitoring: 2021 benthic survey and effects assessment (NIWA,
2021); and
(9) Wastewater quality data workbooks.
3 Napier City Wastewater Treatment Plant
Wastewater Treatment Plant configuration prior to 2014
Napier City's wastewater collection, treatment and disposal system is limited to the city's boundaries. Meeanee,
Jervoistown, residential Awatoto, parts of Bay View and Poraiti are not included in the system. Wastewater in
the serviced area is collected by gravity sewers and 44 pump stations.
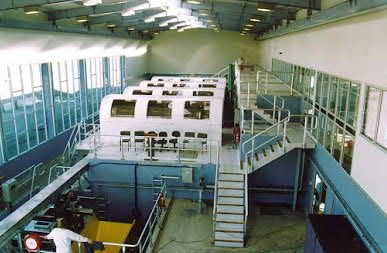
Domestic non-separable wastewater is pumped from three pump stations upstream (Taradale Road, Green
Meadows, and Latham Street) after which it enters in the rising tower and flows through the 1 mm aperture
milliscreen.
Photo 1 Napier Wastewater Treatment Plant Milliscreen
Page 13Napier City Council SLR Ref No: 710.30134-R01-v0.6-20210701.docx
Napier Wastewater Treatment Plant July 2021
Independent Evaluation of Performance
June 2021
Grit removal is via vortex grit trap and classifiers. Additional sediment is removed prior to the primary-treated
wastewater being pumped over the BTF. Screen material is dewatered and disposed of at the Omarunui Landfill.
Prior to commissioning of the BTF in 2014 the screened effluent was discharged directly into Hawke Bay via a
1.5 km marine outfall, which was constructed in 1973.
2014 Improvements
The Biological Trickling Filter (BTF) plant was built alongside the existing milliscreening plant in 2014. The WWTP
upgrade provides a secondary treatment process that includes grit removal followed by biological treatment. It
was designed to allow for further treatment stages to be added in future if required.
Wastewater is pumped to the two Biological Trickling Filters. These filters are 26m diameter concrete tanks that
are 11m high. Timber flooring inside each tank supports 14 layers of welded plastic modules on which bacteria
grow and feed on the effluent, transforming it into a non-offensive bacterial biomass. Sprinklers on top of each
tank distribute screened wastewater onto the plastic filter media.
BTF tanks have aluminium dome roofs to contain odours. Air is recirculated within each BTF by a fan which draws
air from underneath the timber floor to the top of the tank. The tanks are also fitted with extraction fans that
extract air to the nearby bark bio-filters, which act as odour treatment beds.
Photo 2 Napier Wastewater Treatment Plant Biological Treatment Filters
As the final stage in the process, the treated water leaves the BTFs and flows through one of two Rakahore
channels (an open channel filled with rocks) which provide spiritual cleansing before discharge via the marine
outfall into Hawke Bay. An overflow basin has been constructed south of the Rakahore Channels for the purpose
of containment during an emergency.
Industrial wastewater which has been pre-screened through 1 mm milliscreen at all consented industrial trade
waste discharge points is also received in a separate building housing rotating screens specifically designed for
trade waste flows. This tradewaste is not currently treated through the BTF – it by-passes the WWTP and
combines with the treated effluent prior to discharge via the ocean outfall.
Page 14Napier City Council SLR Ref No: 710.30134-R01-v0.6-20210701.docx
Napier Wastewater Treatment Plant July 2021
Independent Evaluation of Performance
June 2021
However, trade waste from the Pandora Industrial Estate is presently not received separately due to closure of
that sewer line. This results in trade wastes from the Pandora Industrial Estate presently passing through the
BTF.
As a proportion of the average daily discharge flows data from the past two years shows the split being 84%
domestic and non-separable and 16% industrial (separated). Of the 84%, 4% is industrial non-separated, 3% of
which is from Pandora Industrial (NCC pers. comm).
4 Environmental License
Approval for the discharge of treated effluent into Hawke Bay, and the associated environmental conditions,
has been provided by Hawkes Bay Regional Council via Resource Consent Coastal Permit (RCCP) No. CD090514W
(now referred to as AUTH-118503-02), dated 6th December 2012. The RCCP describes requirements for effluent
quality and environmental monitoring in relation to improvements at the Napier Wastewater Treatment Works
that became operational in 2014.
The RCCP now has 41 conditions, structured broadly as follows:
· Activity Definition – Conditions 1 to 5 – describe scope of authorised activities including an annual average
discharge not exceeding 32,000m3/d and a maximum flow rate of 1400L/s, and discharge via an ocean
outfall with diffuser that effects a dilution rate of 100:1.
· Wastewater treatment and standards – Conditions 6 to 16 – describe the approved treatment methods,
concentration and load limits for discharge, and toxicity effects.
· Monitoring – Conditions 17 to 28 – outline requirements for monitoring environmental performance of the
WWTP
· Administrative – Conditions 29, 30 – require signage at the ocean diffuser advising that ‘shellfish unfit for
human consumption’, and requirements for appointment of an WWTP contact person.
· Reporting – Conditions 31 to 36 – details requirements for the preparation of management plans,
availability of records and reporting, and complaints procedures.
· Kaitiaki Liaison Group (KLG) – Condition 37 – requirement to continue liaison through the KLG.
· Review conditions - Conditions 38 to 41 – review of QMRA information and requirement to repeat the
analysis based on updated information.
A full copy of the RCCP is provided in Appendix A of this report.
Section 5 below provides a detailed evaluation of the WWTP performance against the RCCP condition.
Page 15Napier City Council SLR Ref No: 710.30134-R01-v0.6-20210701.docx
Napier Wastewater Treatment Plant July 2021
Independent Evaluation of Performance
June 2021
5 Detailed Findings
5.1 General
Napier City Council is required to comply with the RCCP from 31 August 2014, being the date for commissioning
of the Biological Trickling Filter. Therefore, the analysis of WWTP performance is from September 2014 onwards.
This report represents the second independent evaluation of the WWTP performance, and as a result presents
a performance evaluation of the WWTP during the period between 2018 to 2021 unless otherwise stated.
5.2 Condition 2 – Provision of Discharge
5.2.1 Condition
The consent holder shall provide for the discharge as authorised by this resource consent generally in
accordance with the drawings, specifications, statements of work techniques and other information supplied by
the consent holder in support of the application. Where a conflict exists between the application and the
conditions of this resource consent, the conditions shall prevail.
5.2.2 Analysis of data
Napier City Council (NCC) has provided for the discharge in general accordance with the application documents
supplied. However, in August 2018, there were two leaks identified in the outfall pipe at 700m and 630m
offshore. NCC was issued Abatement Notice EAC-20254 on the 5th of June 2020 requiring them to cease the
discharge of treated wastewater from leaks in the outfall pipe. The deadline for complying with this abatement
notice was the 30th of October 2020; however this date was subsequently extended several times due to a
variety of reasons, including complexity of repair design and implementation, adverse weather conditions
preventing repair work, COVID-19 restrictions delaying repairs and availability of the specialist dive team. The
final deadline to comply with the Abatement Notice was 28 February 2021. Additionally, an Emergency
Management Plan was provided to Hawkes Bay Regional Council on 30 July 2020 as required as required by the
Abatement Notice.
5.2.3 Compliance
The repair to the leak at 630m was successfully completed on 25 October 2020. The leak at 700m was completed
on 01 February 2021. A subsequent request to cancel the Abatement Notice was sent to Hawkes Bay Regional
Council on 12 March 2021 with notice cancelled on 15 March 2021.
5.3 Condition 3 – Flow Rates
5.3.1 Condition
‘The combined domestic (including non-separable industrial) and industrial discharge shall not exceed an annual
average volume of 32,000m3/d and a maximum flow rate of 1,400L/s.
Page 16Napier City Council SLR Ref No: 710.30134-R01-v0.6-20210701.docx
Napier Wastewater Treatment Plant July 2021
Independent Evaluation of Performance
June 2021
5.3.2 Source of Data
Flow data has been provided by Napier City Council in Annual Environmental Reports relating to discharge of
wastewater into Hawke Bay via a marine outfall for the periods 01 July 2018 to 30 June 2019 and 01 July 2019
to 30 June 2020 recorded daily and an excel spreadsheet titled ‘2012 Consent Results’ containing data from
August 2020 to March 2021 recorded on a quarterly basis.
5.3.3 Analysis of Data
Daily flow rates of wastewater discharged by NCC in the period between July 2018 and June 2020 are shown in
Figure 1. Generally, the daily discharge flow rates ranged between 200 L/s to 400 L/s, which is well below the
license condition requirements for a maximum flow rate of 1,400 L/s. The highest discharge rate recorded
between 01 July 2018 and 01 March 2021 was 1,073 L/s recorded on 16 October 2019. This is still below the
maximum license limit.
Discharge Rates for Combined Domestic and Industrial Wastewater
1,600
1,400
Daily Discharge Volumes (L/s)
1,200
1,000
800
600
400
200
0
Jul-18 Oct-18 Jan-19 Apr-19 Jul-19 Oct-19 Jan-20 Apr-20 Jul-20 Oct-20 Jan-21
Daily Discharge Volume (L/s) Maximim Consent Limit (1,400 L/s)
Figure 1 Daily discharges of combined effluent from the WWTP
Condition 3 also limits Annual Average Volume to 32,000 m3/day. The annual average flow volumes of discharge
are graphed as per Figure 2.
Page 17Napier City Council SLR Ref No: 710.30134-R01-v0.6-20210701.docx
Napier Wastewater Treatment Plant July 2021
Independent Evaluation of Performance
June 2021
Annual average discharge volumes
35,000
Annual Average Daily Volume (m3/day)
30,000
25,782 26,474
25,000 23,423
20,000
15,000
10,000
5,000
0
July 2018 to June 2019 July 2019 to June 2020 Aug 2020 to March 2021
Annual Average Volume (m3/day) Maximum Consent Limit (32,000m3/day)
Figure 2 Annual average discharge volumes (combined flows)
5.3.4 Compliance
Complies
Daily discharge flow rates and annual average volumes of combined effluent from the WWTP were within the
RCCP limits from July 2018 to March 2021. No exceedances to RCCP limits were recorded.
5.4 Condition 4 – Location of outfall structure
5.4.1 Condition
Discharge of wastewater as authorised by this resource consent shall be by way of the existing outfall structure
located at Awatoto between NZTM 1938355 5615661 and NZTM 1938556 5615661.
5.4.2 Source of Data
Information on the current location of the outfall structure has been provided in the 2018/2019 and 2019/2020
annual and compliance reports.
5.4.3 Analysis of Data
It is noted that the position of the outfall diffuser has not been modified during the reporting periods 2018/2019
and 2019/2020.
5.4.4 Compliance
Complies
Page 18Napier City Council SLR Ref No: 710.30134-R01-v0.6-20210701.docx
Napier Wastewater Treatment Plant July 2021
Independent Evaluation of Performance
June 2021
There was no change to the diffuser position with leaks fixed (NCC, pers. comm.).
5.5 Condition 5 – Marine Outfall Diffuser
5.5.1 Condition
‘All wastewater discharged shall pass through an ocean outfall diffuser which has been designed to achieve a
minimum average dilution over the boil of not less than 100:1 in slack water’.
5.5.2 Source of Data
Design drawings for the marine outfall were provided by Napier City Council.
Additional information on the dilution rate achieved by the diffuser was provided by Napier City Council in the
2018/2019 and 2019/2020 annual and compliance reports.
5.5.3 Analysis of Data
Design drawings for the marine outfall have been provided by Napier City Council, but there is not adequate
detail to verify that the design would achieve a 100:1 dilution rate. However, it is understood that the design
was peer reviewed and approved prior to construction and has been previously accepted by Hawke’s Bay
Regional Council (HBRC) as complying.
5.5.4 Compliance
Complies
The outfall design was accepted as complying by HBRC.
5.6 Condition 6 – Treatment Process and Biological Trickling Filter Loading
5.6.1 Condition
RCCP conditions for this condition have been paraphrased below. The full RCCP conditions can be found in
Appendix A of this report.
From a date no later than 31 August 2014 all domestic and non-separable industrial wastewater shall be:
i. Treated to remove kuparu (human waste in an unaltered state) from the flow, with the wastewater
being treated in a biological trickling filter, filled with structured media, with an annual average daily
loading of carbonaceous biochemical oxygen demand (5 day test) (cBOD5) that shall not exceed 0.6kg
per cubic meter of media per day
ii. The plant shall include milliscreening, and grit removal prior to the BTF
iii. Prior to discharge the effluent shall be pass through a Papatuanuku channel.
5.6.2 Source of Data
The following sources of data have been used to assess compliance with this condition.
· Compliance monitoring report for the period 01 July 2019 to 30 June 2020 prepared by Hawkes Bay
Regional Council
Page 19Napier City Council SLR Ref No: 710.30134-R01-v0.6-20210701.docx
Napier Wastewater Treatment Plant July 2021
Independent Evaluation of Performance
June 2021
· Annual Environmental Report for period ending 30 June 2020 prepared by Napier City Council
· Annual Environmental Report for period ending 30 June 2019 prepared by Napier City Council
· Data provided by Napier City Council in an excel spreadsheet titled ‘Bi-Weekly Performance Updated’
· Data provided by Napier City Council in an excel spreadsheet titled ‘2012 Consent Results’.
The data is for the combined wastewater discharge, including both treated and domestic wastewaters.
5.6.3 Analysis of Data
i. All domestic and non-separable industrial wastewater was treated as per the conditions of this consent
with respect to a biological trickling filter process, filled with structured media. The annual average daily
loading rates to the BTF (as cBOD5) are graphed as per Figure 3, based on bi-weekly data recorded over
the periods indicated and assuming 8,700 m3 of filter media in the BTFS. The annual average loading
rates to the BTF have exceeded the consent limit during the period 03 July 2018 to 27 June 2019 and
the period between 02 July 2020 to 04 May 2021. During the period 09 July 2019 to 30 June 2020, the
annual average loading rates to the BTF was 0.55 kg/m3 of media/day which was lower but near the
consent limit of 0.6 kg/m3 of media/day. The raw cBOD5 concentrations, daily volumes, and cBOD5
loading rates per m3 of filter media (assuming 8,700m3 of filter media in the BTF’s) are shown in Table 1
below for the sampling dates shown. From the sampling data there is considerable fluctuation in the
cBOD5 loading rates which vary between 0.29 and 1.07 kg/m3 media/day. The treatment level is high
with an average cBOD5 removal efficiency of 77% for the sampling dates shown.
Page 20You can also read


