CHARACTERIZATION OF XGNP GRADE C MATERIALS
←
→
Page content transcription
If your browser does not render page correctly, please read the page content below
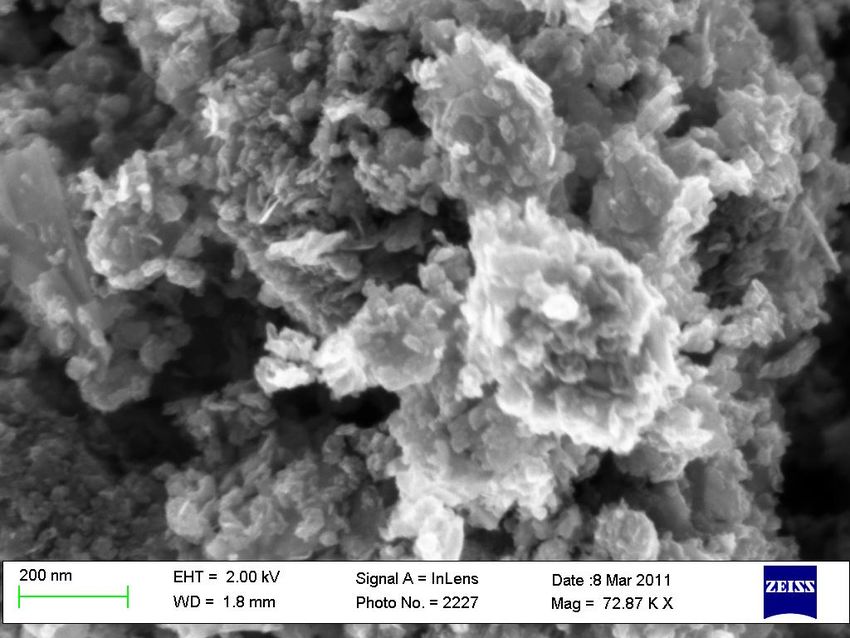
Characterization of xGnP® Grade C Materials

Background
Because of the unique size and shape of xGnP® Grade C Materials, there are occasional questions raised
by scientists who are puzzled by the results of some traditional material characterization techniques.
This paper is an attempt to address some of these questions.

Morphology

XG Sciences offers its “C-grade” materials with a variety of different surface areas, ranging from about
300 m2/g to 750 m2/g. All of these materials have a “small flake” morphology, with particle sizes that are
larger in the lower surface area materials and smaller in the highest surface area materials. The size of a
typical Grade C sample has a distribution that ranges from very small flakes (below 100 nm) up to
relatively large flakes (1-2 um). Grade C-750 has the smallest average size, followed by C-500 while C-
300 has the largest average size.
As a dry powder, Grade C materials often agglomerate and form larger spherical powders. (Figure 1)
When the agglomerated powders are separated, particles with flake morphology with different sizes are
observed. (Figure 2, Figure 3) At lower magnification, particles with dark and small spherical
morphology may be observed (Figure 2). This could be misinterpreted as amorphous carbon, but it is
proved that most of these are agglomerates of very small flakes. The crystal structure of xGnP® Grade C
can be confirmed through analysis with XRD, Raman, and TGA.
Figure 1. SEM Image of C-750. Small flakes are stacking on larger flakes and form agglomerates.

              Figure 2. TEM of Separated Grade C flakes at Lower Magnification
Figure 3. TEM of Separated Grade C flakes at Higher Magnification
Thermal Stability

TGA measurement of Grade C samples under air (Figure 4) revealed that C-750 degrades at lower
temperature than C-500 and C-300. This is due to a higher presence of very small particles. Since the
degradation (oxidation) occurs from the edge area, it is reasonable that the sample with smallest size
degrades at the lowest temperature. The TGA data of Grade C samples suggests that xGnP® Grade C
materials are more thermally stable than amorphous carbon or typical reduced graphite oxide since
these materials often degrade at around 350°C to 450°C. Since xGnP® Grade C samples show some
degradation in this temperature range, it is possible that a small amount of amorphous carbon may be
present, but it is believed that very small crystalline particles are more likely the cause of the
temperature degradation below 500°C.

                                           TGA Grade C Materials
               120

               100

               80
  Weight (%)

               60
                               C-300
                               C-300 Differential
                               C-500
               40
                               C-500 Differential
                               C-750
                               C-750 Differential
               20

                0
                     0   100     200        300      400       500     600        700   800    900
                                                    Temperature (°C)

                                Figure 4. Typical TGA of xGnP® Grade C Material
Raman Spectra Raman spectroscopy is often used as a characterization tool to identify carbon materials. The Raman spectra of all carbon systems have a rather simple set of peaks. The main features of such spectra are two distinctive peaks called the D peak (~1360 cm-1) and the G peak (~1560 cm-1) and few other second- order harmonics. The G peak is due to the stretching motion of sp2 bonds between carbon atoms, which reflects the crystalline graphite structure of graphite/graphene materials. The D peak is due to the Raman scattering induced by zone-boundary phonons that reflects disordered structures. Such disordered structures include defects, edges, crystal boundaries, symmetry breaking, etc. The most prominent second-order harmonic at around 2700 cm-1 is called G’ peak, or 2D. This peak reflects the stacking structure of graphite along the c-axis. Such structure includes the number of layers and crystallinity degrees. It is known that single–layer graphene has a single, symmetric 2D peak, since there is only one possible scattering process. On the other hand, double-layer graphene with A-B stacking structure has a broader 2D peak which consists of four possible double resonance scattering processes caused by splitting the π electronic structure due to the interactions between two graphene layers. The number of double resonance scattering processes increases with an increase in the number of graphene layers. Because of the uniqueness of the double resonance scattering patterns for few-layer graphenes, it is possible to detect the number of layers by analyzing the shape of the 2D peak. When the numbers of layers increases further, typically 10 layers or more, the 2D peak curves converge and show only two peaks, which is virtually the same as the 2D peak of bulk graphite. There are several points to consider in the actual Raman measurement. First is the laser type. Since the shape and location of the D and 2D peaks change according to the laser excitation energy, it is required to use the same conditions to ensure valid “apples to apples” comparison. Our typical Raman spectra data are taken by using 532nm laser unless otherwise specified. Second is the laser beam diameter. Typical laser beam diameter used in most Raman Spectrometers is 3-5 um. When the flake size of the graphene sample is larger than the size of the laser, it is easy to distinguish the Raman spectra from the flake basal plane from that of edge area. Thus, it is easy to analyze the defects in the basal plane. On the other hand, when the flake size of the sample is smaller than the size of the laser beam, it becomes almost impossible to distinguish whether the resulting data is caused by defects in the basal plane or by the edge area. In the case of xGnP® Grade C samples, since the average flake size is smaller than the size of the laser, it is almost inevitable that edge area results will be returned for most Raman measurements. For example, the Raman spectra of bulk Grade C powder show a very high D peak due to the inclusion of large edge areas. (Figure 5) When the same sample is diluted and separated into more individual flakes, the intensity of the D peak changes. (Figure 5) The latter case requires very careful sample preparation and measurement. In other words, different Raman spectra can be taken from the same grade C material. This implies that it is not appropriate to assess the quality or crystallinity of xGnP® Grade C materials (or similar materials) based solely on Raman spectra.
Raman Spectrta of C-750
        120

        100
                                                                  C-750 Bulk Powder

        80
 A.U.

        60

        40

        20

         0
          1000           1500              2000             2500              3000              3500
                                             Raman Shift (cm-1)

                       Figure 5. Typical Raman Spectra of xGnP® Grade C Material

X-Ray Diffraction

Since Grade C material is not single layer graphene but a few-layer nanocrystalline graphite, the XRD of
this material shows a [002] peak. The height of the peak depends on the sample preparation as well as
the XRD equipment settings. The peak is somewhat broadened due to the small size of xGnP® Grade C
materials, but the peak position appears at 2Θ = 26.3-26.4, which is close to that of single crystalline
graphite (2Θ = 26.5). This peak is different from turbostratic graphite (2Θ = 25.8). These results clearly
demonstrate that Grade C materials possess a crystalline structure. The typical XRD of our Grade C
samples are shown in Figure. 6.
XRD of Grade C Materials
12000
C-300
10000
C-500
C-750
8000
Intensity (cps)
6000
4000
2000
0
20 21 22 23 24 25 26 27 28 29 30 31 32
2 Theta (Degree)
Figure 6. Typical XRD Data of xGnP® Grade C MaterialsYou can also read