Cis-regulatory variants affect gene expression dynamics in yeast
←
→
Page content transcription
If your browser does not render page correctly, please read the page content below
RESEARCH ARTICLE

                                   Cis-regulatory variants affect gene
                                   expression dynamics in yeast
                                   Ching-Hua Shih, Justin Fay*

                                   Department of Biology, University of Rochester, Rochester, United States

                                   Abstract Evolution of cis-regulatory sequences depends on how they affect gene expression
                                   and motivates both the identification and prediction of cis-regulatory variants responsible for
                                   expression differences within and between species. While much progress has been made in relating
                                   cis-regulatory variants to expression levels, the timing of gene activation and repression may also
                                   be important to the evolution of cis-regulatory sequences. We investigated allele-specific
                                   expression (ASE) dynamics within and between Saccharomyces species during the diauxic shift and
                                   found appreciable cis-acting variation in gene expression dynamics. Within-species ASE is
                                   associated with intergenic variants, and ASE dynamics are more strongly associated with insertions
                                   and deletions than ASE levels. To refine these associations, we used a high-throughput reporter
                                   assay to test promoter regions and individual variants. Within the subset of regions that
                                   recapitulated endogenous expression, we identified and characterized cis-regulatory variants that
                                   affect expression dynamics. Between species, chimeric promoter regions generate novel patterns
                                   and indicate constraints on the evolution of gene expression dynamics. We conclude that changes
                                   in cis-regulatory sequences can tune gene expression dynamics and that the interplay between
                                   expression dynamics and other aspects of expression is relevant to the evolution of cis-regulatory
                                   sequences.

*For correspondence:
                                   Introduction
justin.fay@rochester.edu           Noncoding cis-regulatory sequences control gene expression and are thought to play a central role
                                   in evolution (Carroll, 2005). However, genetic analysis of phenotypic variation frequently uncovers
Competing interests: The           changes in protein coding sequences rather than in regulatory regions (Stern and Orgogozo, 2008;
authors declare that no
                                   Fay, 2013). One explanation might be that genetic mapping and transgenic studies tend to identify
competing interests exist.
                                   large effect mutations. If evolution predominantly occurs through numerous changes of small effect
Funding: See page 18               (Rockman, 2012), the role of cis-regulatory sequences is harder to discern. Even so, cis-regulatory
Received: 17 March 2021            changes have been shown to be important in polygenic adaptation (Bullard et al., 2010;
Accepted: 06 August 2021           Fraser et al., 2010; Fraser et al., 2011; Fraser et al., 2012; Naranjo et al., 2015), the accumulation
Published: 09 August 2021          of multiple changes at evolutionary hotspots (Frankel et al., 2011; Engle and Fay, 2012, 1;
                                   Martin and Orgogozo, 2013; Li and Fay, 2019), and variation in fitness and disease (Boyle et al.,
Reviewing editor: Kevin J
                                   2017; Sharon et al., 2018). Regardless of the relative role of coding and noncoding sequences in
Verstrepen, VIB-KU Leuven
Center for Microbiology,
                                   phenotypic evolution, understanding how variation in cis-regulatory sequences generates variation in
Belgium                            gene expression is important to understanding the evolution of gene regulation.
                                       Across organisms, there is an abundance of cis-acting sequence variation that affects gene
   Copyright Shih and Fay. This
                                   expression levels (Hill et al., 2021). The causes of cis-regulatory variation are not as easily character-
article is distributed under the
                                   ized. Transcription factor binding sites are often found to play important roles (Zheng et al., 2011).
terms of the Creative Commons
Attribution License, which         However, the number, identity, and position of binding sites can also vary without affecting expres-
permits unrestricted use and       sion. The flexibility of cis-regulatory sequences is shown by genes with similar expression patterns
redistribution provided that the   but different cis-regulatory sequences (Berman et al., 2002). In the case of orthologous genes from
original author and source are     different species, binding site turnover and transcription factor re-wiring explain substantial diver-
credited.                          gence in cis-regulatory sequences without expression divergence (Ludwig et al., 2000;

Shih and Fay. eLife 2021;10:e68469. DOI: https://doi.org/10.7554/eLife.68469                                                          1 of 23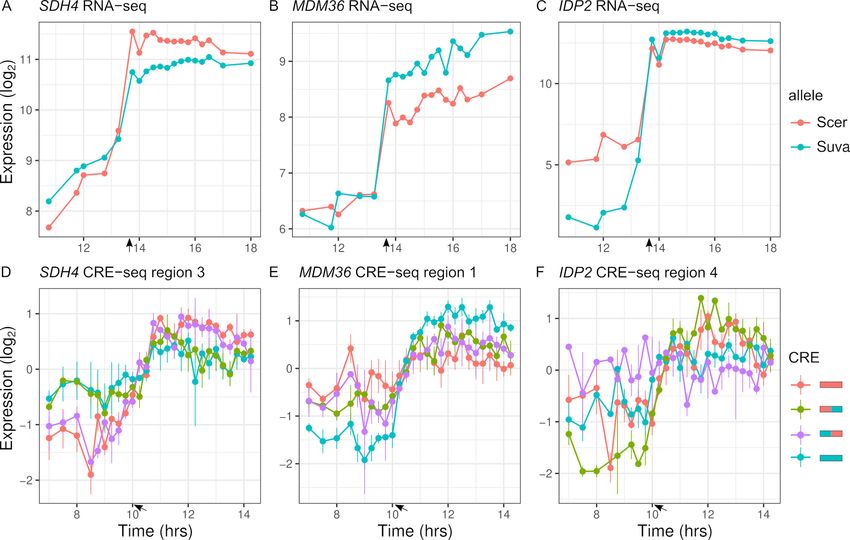
Research article                                                                     Evolutionary Biology Genetics and Genomics

                                   Dermitzakis and Clark, 2002; Hare et al., 2008; Tuch et al., 2008; Venkataram and Fay, 2010;
                                   Swanson et al., 2011; Bergen et al., 2016). Consequently, predicting changes in gene expression
                                   based on variation in individual transcription factor binding sites has proven difficult (Doniger and
                                   Fay, 2007; Doniger et al., 2008).
                                       Despite the flexibility of binding sites within cis-regulatory sequences, sequences flanking binding
                                   sites evolve under constraints and can affect expression. For example, over a third of yeast inter-
                                   genic sequences are estimated to be under selective constraint (Chin et al., 2005; Doniger et al.,
                                   2005). This fraction is greater than that expected from either conserved or experimentally identified
                                   binding sites (Doniger et al., 2005; Venkataram and Fay, 2010). Sequences flanking binding sites
                                   have also been shown to affect expression, potentially related to DNA shape, nucleosome position-
                                   ing, or weak binding sites (Tanay et al., 2005; White et al., 2013; Abe et al., 2015; Levo et al.,
                                   2015; Inukai et al., 2017). Consequently, conservation scores have proven important for predicting
                                   cis-regulatory variants (Huang et al., 2017; Kircher et al., 2019; Renganaath et al., 2020).
                                       Cis-regulatory sequences can affect other aspects of gene regulation besides expression levels.
                                   Stochastic noise in gene expression provides a mechanism for bet-hedging strategies (Raj and van
                                   Oudenaarden, 2008) and is encoded by and evolves through changes in cis-regulatory sequences
                                   (Richard and Yvert, 2014). Cis-regulatory variants that alter noise in expression levels have been
                                   shown to be under selection and can occur both within and outside of known binding sites
                                   (Carey et al., 2013; Sharon et al., 2014; Metzger et al., 2015; Schor et al., 2017; Duveau et al.,
                                   2018).
                                       Gene expression dynamics, which include the timing and rate of gene activation and repression,
                                   are also important aspects of gene regulation (López-Maury et al., 2008; Yosef and Regev, 2011).
                                   Gene expression dynamics can be altered by transcription factors and their interactions with pro-
                                   moters, but also depend on nucleosomes and their positions relative to binding sites (Lam et al.,
                                   2008; Hager et al., 2009; Dadiani et al., 2013; Hansen and O’Shea, 2015). Notably, chromatin
                                   mutants slow gene activation without compromising final levels of gene expression (Barbaric et al.,
                                   2001; Floer et al., 2010). Variation in cis-regulatory sequences can also affect gene expression
                                   dynamics, but these dynamics are only sometimes captured (Ackermann et al., 2013;
                                   Francesconi and Lehner, 2014; Strober et al., 2019). Thus, the causes of cis-regulatory variation in
                                   gene expression dynamics have neither been characterized nor related to variation in gene expres-
                                   sion levels.
                                       In this study, we investigate cis-acting variation in gene expression dynamics. We survey and find
                                   allele-specific differences in expression dynamics both within and between Saccharomyces species
                                   during the diauxic shift when there is major transition from the expression of genes involved in fer-
                                   mentation to respiration (DeRisi et al., 1997). Using these data, we associated allele-specific expres-
                                   sion (ASE) with promoter variation and individual variants using a high-throughput reporter assay.
                                   Our results inform our understanding of variation in gene expression dynamics and point towards an
                                   integrated view of gene expression and how it evolves.

                                   Results
                                   Cis-regulatory variation in gene expression levels and dynamics
                                   To identify cis-regulatory variation in gene expression dynamics, we measured ASE in three intra-
                                   specific and two inter-specific diploid hybrids. Hybrids were generated by crossing a North American
                                   Saccharomyces cerevisiae strain (Oak) to an S. cerevisiae wine strain (Wine) and two strains from
                                   China (China I and China II), as well as to a strain of Saccharomyces paradoxus and Saccharomyces
                                   uvarum (Table S1 in Supplementary file 1), enabling us to examine a range of divergence in gene
                                   regulation. To capture temporal differences in ASE that occur during the diauxic shift, we generated
                                   RNA-sequencing data from 19 timepoints for each hybrid, spanning the shift from fermentation to
                                   respiration as measured by glucose depletion (Figure 1—figure supplement 1).
                                       ASE requires RNA-sequencing reads that can be distinguished as coming from one of the two
                                   parental strains. To measure ASE while avoiding mapping bias (Degner et al., 2009;
                                   Stevenson et al., 2013), we mapped reads to the combined parental genomes and enumerated
                                   allele-specific reads. The proportion of reads mapping to each parental genome was equivalent

Shih and Fay. eLife 2021;10:e68469. DOI: https://doi.org/10.7554/eLife.68469                                                        2 of 23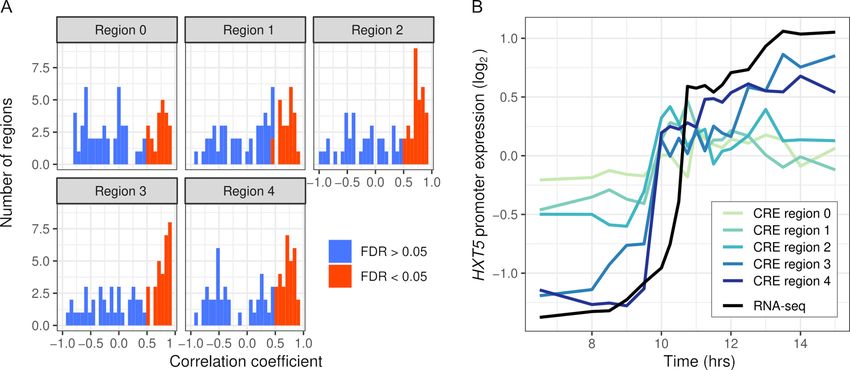
Research article                                                                                   Evolutionary Biology Genetics and Genomics

                                           across all five hybrids, except for one arm of chromosome XIII in the China I hybrid consistent with
                                           aneuploidy (Figure 1—figure supplement 2), which we removed from subsequent analysis.
                                               Two statistical tests were used to separately identify genes exhibiting differences in ASE levels
                                           and changes in ASE dynamics over time. Genes with ASE dynamics were identified by testing for an
                                           autocorrelation in the ratio of allele-specific reads over time. Under the null model, the ratio of the
                                           two alleles is constant over time but not necessarily equal to 1. Genes with ASE levels were identi-
                                           fied by testing for differences between the expression of the two alleles across all timepoints. Using
                                           these tests, we found that more genes showed ASE levels compared to ASE dynamics and the num-
                                           ber of genes with either ASE levels or dynamics increased with divergence (false discovery
                                           rate [FDR] < 0.01, Table 1). As expected, genes with ASE levels showed larger average allele differ-
                                           ences across timepoints, and genes with ASE dynamics showed larger standard deviations in allele
                                           differences across timepoints (Figure 1—figure supplement 3). Genes with ASE levels and genes
                                           with ASE dynamics were relatively evenly distributed across genes whose expression increased/
                                           decreased or showed a peak/trough during the diauxic shift (Figure 1 in Supplementary file 1).
                                               Changes in ASE over time can result from a variety of differences in the dynamics of the two
                                           alleles. To illustrate this variety, we consider a gene that is activated during the diauxic shift
                                           (Figure 2A, B). ASE can be condition-specific due to an allele difference in the presence but not
                                           absence of glucose, or vice versa. ASE can also differ specifically during the diauxic shift due to a dif-
                                           ference in the timing or rate of gene activation that does not require ASE differences before or after
                                           the shift. To characterize ASE, we applied k-means clustering to ASE allele frequencies and found
                                           two types of patterns (Figure 2C, Table S3 in Supplementary file 1). The majority of genes (72%)
                                           showed environment-dependent ASE and the remaining genes showed an ASE maximum or mini-
                                           mum during the transition (clusters 6, 9, 10, and 12, Figure 2C).

                                           ASE is associated with SNPs and InDels
                                           ASE is caused by cis-acting single-nucleotide polymorphisms (SNPs) or insertion deletion polymor-
                                           phisms (InDels) that affect gene expression. In yeast, cis-acting variants most likely occur within the
                                           small (~500 bp) intergenic region upstream of a gene, but could also occur within the coding or 30
                                           region of a gene. For each hybrid, we tested whether the number of variants in these regions pre-
                                           dicts significant ASE levels or ASE dynamics using logistic regression.
                                              Both ASE levels and dynamics were associated with the number of SNP and InDel variants, but
                                           these associations varied by hybrid and the type of variant. Within intra-specific hybrids, upstream
                                           SNPs and InDels were associated with both ASE levels and dynamics, but InDels showed stronger
                                           associations as measured by the odds ratio and the significance (Figure 3). SNPs and InDels within
                                           coding and downstream regions were also associated with ASE, but the associations were similar for
                                           ASE levels and dynamics (Table S4 in Supplementary file 1). Although the odds ratio is high for
                                           downstream variants, this could be due to either larger effects or a higher fraction of functional var-
                                           iants within the 80 bp of downstream sequence examined. To examine the magnitude of ASE differ-
                                           ences, we split the genes into three groups and found that upstream InDels have a similar ability to
                                           predict ASE levels and dynamics for genes with large ASE differences, but predict ASE dynamics
                                           better than ASE levels for genes with small ASE differences (Figure 3—figure supplement 1).

Table 1. Number of genes with allele-specific expression.
                 Intra-specific hybrids‡                                                                                    Inter-specific hybrids‡
                                                                                                                            S. cerevisiae     S. cerevisiae
                 S. cerevisiae (Oak  Wine)        S. cerevisiae (Oak  China II)      S. cerevisiae (Oak  China I)†       S. paradoxus       S. uvarum
Group*           YJF1460                           YJF1455                             YJF14542                             YJF1453            YJF1484
Dynamics         671                               699                                 911                                  2055               1827
Levels           1964                              2088                                2260                                 2930               3237
Both             371                               375                                 501                                  1260               1253
*
Genes with significant (false discovery rate < 0.01) allele-specific differences in dynamics, levels, or both dynamics and levels.
†
The total number of genes is 4703 except for 358 genes on chromosome 13R of the China I hybrid that were removed.
‡
    Oak is most closely related to the Wine strain, followed by China II, China I, S. paradoxus, and S. uvarum.

Shih and Fay. eLife 2021;10:e68469. DOI: https://doi.org/10.7554/eLife.68469                                                                             3 of 23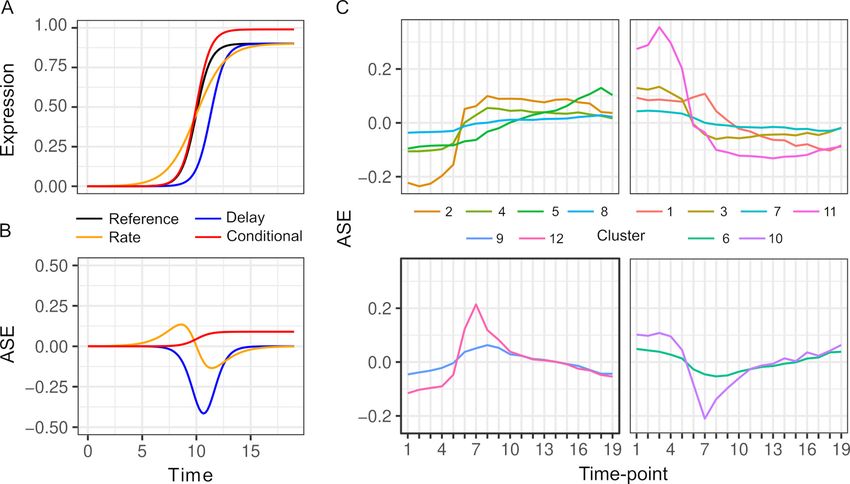
Research article                                                                          Evolutionary Biology Genetics and Genomics

                                   Figure 1. Gene expression dynamics. Each line shows the average expression of genes in each k-means cluster
                                   over timepoints. Clustering is based on the expression of 4703 genes from each hybrid. The arrow indicates the
                                   timepoint when glucose was depleted.
                                   The online version of this article includes the following figure supplement(s) for figure 1:
                                   Figure supplement 1. Sampling scheme for gene expression dynamics during the diauxic shift.
                                   Figure supplement 2. Chromosome 13R aneuploidy in YJM1454 (Oak  ChI).
                                   Figure supplement 3. Characteristics of differentially expressed genes.

                                      Inter-specific hybrids only showed significant associations between ASE dynamics and upstream
                                   SNPs and InDels. Association between ASE and divergence may be weak or absent if most substitu-
                                   tions between species do not affect gene expression or if there are many substitutions that affect
                                   expression but they have random effects that cancel each other out. The inter-specific hybrids have
                                   much higher rates of divergence compared to the intra-specific hybrids: an average of 15 and 107
                                   upstream InDels and SNPs, respectively, compared to 1.2 and 6.0 InDels and SNPs within the intra-
                                   specific hybrids (Table S5 in Supplementary file 1). For the intra-specific hybrids, the frequency of
                                   ASE increases linearly with the number of variants (Figure 3—figure supplement 2), suggesting that
                                   regulatory variants are rare enough to consistently increase the frequency of ASE at low divergence.

                                   Intra-specific cis-regulatory variants
                                   The associations between ASE and the number of upstream intergenic variants indicate that pro-
                                   moter polymorphism is a significant contributor to ASE. To specifically measure the effects of pro-
                                   moter polymorphism and identify causal variants, we used a high-throughput cis-regulatory element
                                   (CRE-seq) reporter assay (Mogno et al., 2013). In this assay, promoter sequences are synthesized
                                   and the resulting pooled library is cloned and integrated into a single site in the yeast genome (Fig-
                                   ure 4—figure supplement 1). The synthesized sequences include a 10 bp barcode that can be used
                                   as a tag to measure gene expression through RNA-sequencing and relative abundance through
                                   DNA-sequencing.
                                       We designed a CRE-seq library to test promoter variants upstream of 69 genes that exhibited
                                   ASE levels and/or dynamics in the Oak  ChII hybrid. Because the synthesized promoters were lim-
                                   ited to 130 bp, we designed five overlapping CRE sequences per gene to test all variants within the
                                   250 bp region upstream of the transcription start site (TSS). There were a total of 337 variants, an
                                   average of 4.2 SNPs and 0.72 InDels per gene. For any CRE sequences with more than a single dif-
                                   ference between the Oak and ChII alleles, we also generated CREs for each ChII variant in the Oak
                                   allele and vice versa (Figure 4—figure supplement 1). The total library contained 1818 CREs with

Shih and Fay. eLife 2021;10:e68469. DOI: https://doi.org/10.7554/eLife.68469                                                                 4 of 23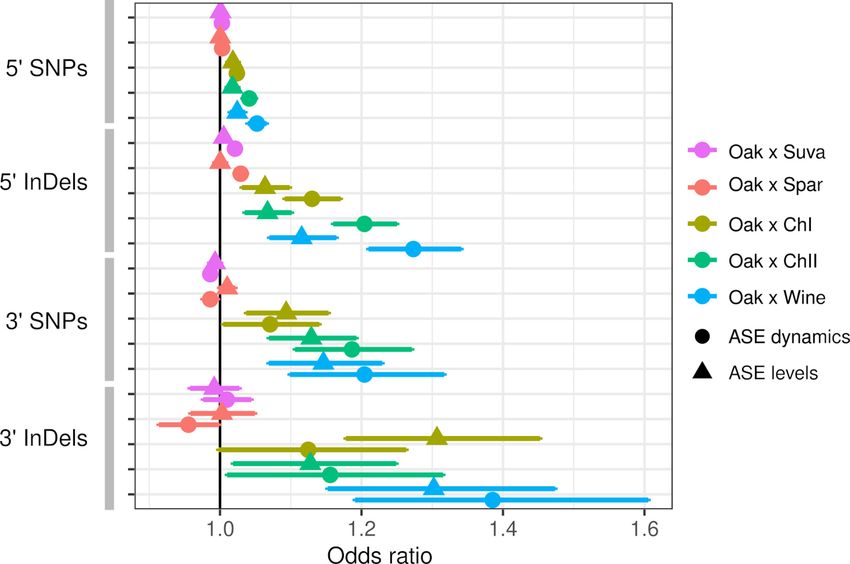
Research article                                                                            Evolutionary Biology Genetics and Genomics

Figure 2. Patterns of allele-specific expression (ASE) dynamics. (A) Three hypothetical types of differences in expression dynamics in comparison to a
common reference (black) are shown by a time delay (blue), rate change (orange), and condition-specific expression difference (red). (B) ASE based on
the three types of differences in comparison to the common reference. (C) Average ASE across 19 timepoints of k-means clustering of 6135 genes with
significant ASE dynamics. Clusters 6, 9, 10, and 12 (bottom panels) show maximum deviation during the diauxic shift, whereas the others generally show
increasing or decreasing ASE differences over time consistent with condition-specific ASE.

                                    four barcode replicates per CRE and included all variants within the 334 regions upstream of the 69
                                    genes.
                                       We first tested whether the synthetic promoter regions could recapitulate expression of the
                                    endogenous genes. We measured CRE expression over 19 timepoints during the diauxic shift in the
                                    same hybrid background as RNA-seq. Out of 334 regions, 137 were correlated with RNA-seq
                                    expression (FDR < 0.05) and 17 genes had no region correlated. CRE-seq regions correlated with
                                    RNA-seq tended to lie further away from the TSS, and in some cases showed a gradual increase in
                                    correspondence (Figure 4). We also barcoded and measured expression from full-length promoters
                                    of three genes (Figure 4—figure supplement 2). All three genes showed good correspondence
                                    between the full-length promoter and a shorter CRE-seq region. However, one of the genes, ALD5,
                                    showed both short- and full-length reporter expression notably different from the endogenous RNA-
                                    seq expression. One explanation for this difference is that we used an annotated TSS 515 bp
                                    upstream of the ATG, whereas some studies indicate a site much closer (78–84 bp) to the ATG
                                    (Zhang and Dietrich, 2005; Pelechano et al., 2013).
                                       To determine whether any of the CRE regions contained variants that affect expression, we exam-
                                    ined the 281/334 regions upstream of the 69 genes with one or more differences between the Oak
                                    and ChII alleles. One of the regions showed significant differences in expression levels between the
                                    Oak and ChII alleles, and 31 showed differences in expression dynamics (FDR < 0.05, Table 2).
                                    Eleven of these regions had only a single variant that differentiated the two parental alleles and the
                                    rest had between 2 and 9 variants. For regions with multiple variants, we tested each using CREs
                                    containing the Oak variant in the ChII background and vice versa. For expression levels, we found
                                    significant effects for one of the two variants tested, and for expression dynamics we found 35 out
                                    of 70 variants (FDR < 0.05, Table 2), 4 of which were detected by multiple regions.
                                       Promoter regions that showed allele-specific differences in expression dynamics had high rates of
                                    polymorphism and often multiple variants that affected expression. The rate of variants in the 31
                                    CRE regions with differences in expression dynamics (2.1%) was higher than that of intergenic
                                    regions across the genome (1.4%; Fisher’s exact test, p=0.0038). Out of the 22 genes with one or
                                    more CRE regions showing differences in expression dynamics between the Oak and ChII alleles, 8

Shih and Fay. eLife 2021;10:e68469. DOI: https://doi.org/10.7554/eLife.68469                                                                   5 of 23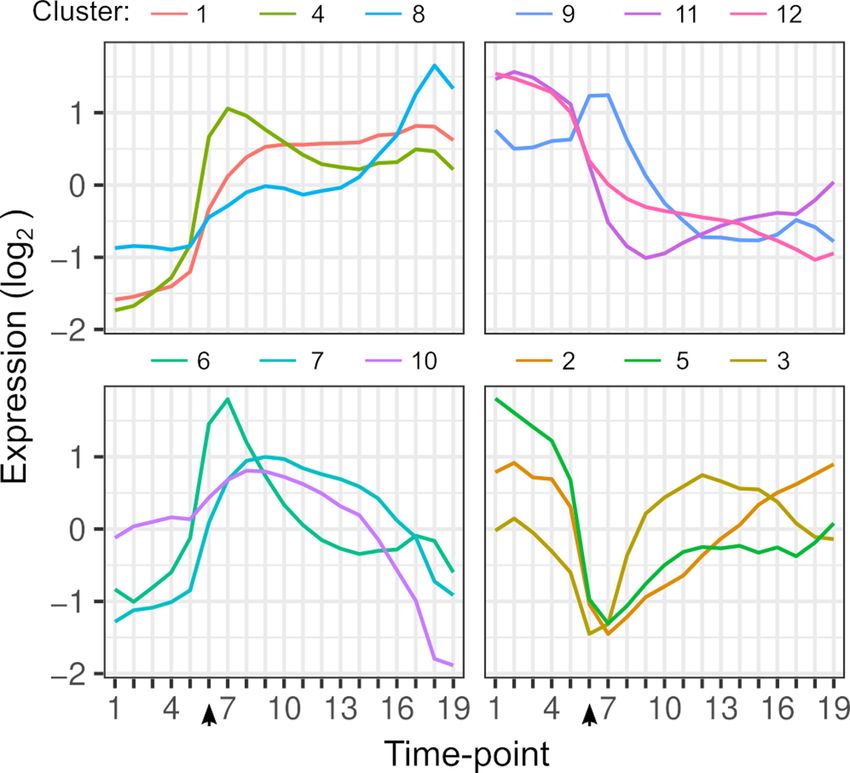
Research article Evolutionary Biology Genetics and Genomics
Figure 3. Allele-specific expression (ASE) is associated with intergenic single-nucleotide polymorphisms (SNPs)
and insertions/deletions (InDels). The odds ratio (OR) and 95% confidence interval for associations between the
number of SNPs or InDels and significant ASE levels (triangles) and dynamics (circles). The OR of each hybrid is
shown separately for upstream (50 ) and downstream (30 ) intergenic variants.
The online version of this article includes the following figure supplement(s) for figure 3:
Figure supplement 1. Allele-specific expression (ASE) associations with single-nucleotide polymorphisms (SNPs)
and insertions/deletions (InDels) for genes with small (A), medium (B), and large (C) expression differences.
Figure supplement 2. The frequency of significant allele-specific expression (ASE) dynamics (A) and ASE levels (B)
as a function of the number of variants.
had two or more significant variants, 12 had only a single variant, and 2 had no significant variants.
While the number of InDels with significant effects on expression dynamics was small, the ratio of
significant SNPs to InDels (6.0) was not different from that of intergenic regions across the genome
(4.8; Fisher’s exact test, p>0.05).
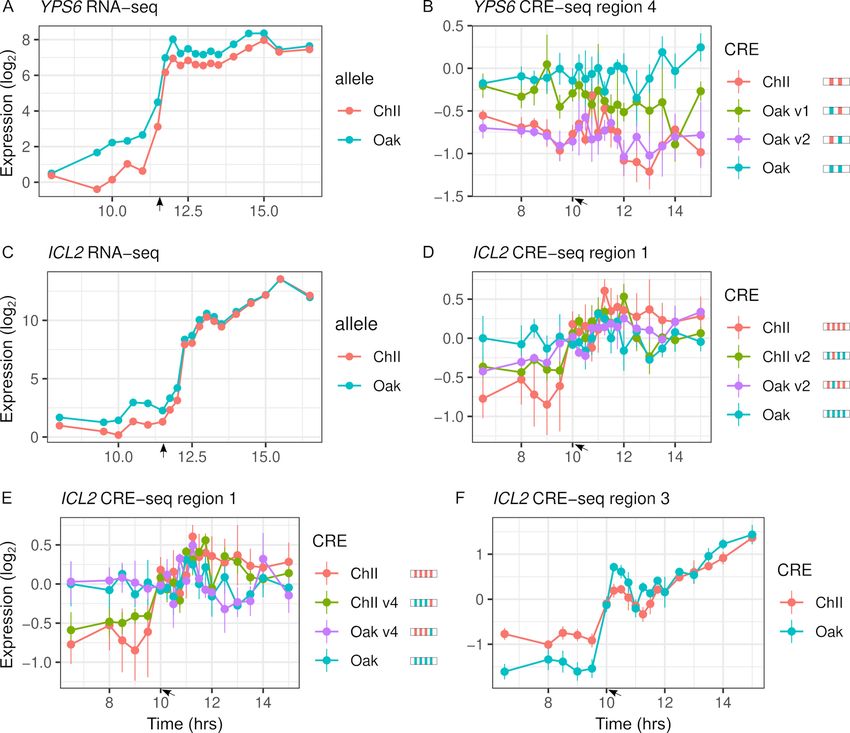
Variants with significant effects on CRE-seq expression were not always consistent with patterns
of RNA-seq ASE (Figure 5). Only 16 of the 31 regions showing CRE-seq expression dynamics corre-
lated with RNA-seq expression. For example, region 4 of the YPS6 promoter showed increased
expression over time in the RNA-seq data but not in the CRE-seq data. Even so, the Oak allele
exhibited higher expression levels than the ChII allele in both the RNA-seq and CRE-seq assays, a
difference that can be attributed to one of the two variants in the region. The ICL2 promoter showed
increased expression over time in both the RNA-seq and CRE-seq assays, but not all CRE-seq allele
differences were consistent with the RNA-seq allele differences. Region 1 of the ICL2 promoter
showed ASE differences consistent with RNA-seq and multiple variants with effects on expression
dynamics. However, region 3, which had only a single variant, showed allele differences in expression
dynamics inconsistent with RNA-seq, whereby the Oak allele responded more strongly than the ChII
allele to the diauxic shift.
Cis-regulatory variants that affect expression levels have been associated with conserved pro-
moter regions and disruption of transcription factor binding sites (Renganaath et al., 2020). We
found no difference in PhastCons conservation scores or change in binding site scores between the
35 variants associated with expression dynamics and those that were not associated (Figure 5—fig-
ure supplement 1). Because the number of variants is small, we also examined whether PhastCons
scores or binding site scores improved the genome-wide logistic regression. Binding site scores did
Shih and Fay. eLife 2021;10:e68469. DOI: https://doi.org/10.7554/eLife.68469 6 of 23Research article Evolutionary Biology Genetics and Genomics
Figure 4. Intra-specific cis-regulatory elements (CREs) recapitulate endogenous expression dynamics. (A) Histogram of the correlations between CRE
expression and the endogenous (RNA-seq) expression of 69 genes. Correlations are shown separately for CRE regions 0–4, ordered proximal to distal
of the transcription start site with shifts of 30 bp. CREs with a significant (false discovery rate < 0.05) correlation are shown in red, the rest in blue. (B)
CRE expression of five regions upstream of HXT5 as well as its endogenous expression from RNA-seq.
The online version of this article includes the following figure supplement(s) for figure 4:
Figure supplement 1. Design and cloning of cis-regulatory element (CRE-seq) libraries.
Figure supplement 2. Short cis-regulatory elements (CREs) recapitulate longer CRE expression.
not improve the odds ratios. While PhastCons scores improved the association between SNPs and
ASE levels and dynamics, it did not improve InDel associations (Table S6 in Supplementary file 1).
Inter-specific cis-regulatory variation
We also designed a CRE-seq library to test promoter divergence of 98 genes that exhibited ASE lev-
els and/or dynamics in the S. cerevisiae S. uvarum hybrid. We used the same design of five over-
lapping 130 bp CRE sequences covering 250 bp upstream of the TSS. There was an average of 32
substitutions and 4.0 InDels per region. Because there were too many differences to test individually,
we generated chimeric CRE sequences containing either the first or second half of the sequence
from the S. cerevisiae allele and the remaining half from the S. uvarum allele (Figure 4—figure sup-
plement 1). The total library contained 1808 CREs with four barcode replicates per CRE and covered
452 regions upstream of the 98 genes.
We again tested whether the synthetic promoter regions could recapitulate expression of the
endogenous genes and whether there were differences in expression levels or dynamics between
the S. cerevisiae and S. uvarum alleles. We measure CRE expression during the diauxic shift in the
same hybrid background used to measure RNA-seq. Out of 452 regions, 220 were correlated with
RNA-seq expression (FDR < 0.05) and 28 genes had no region correlated. Similar to intra-specific
Table 2. CRE regions and variants affecting gene expression.
Library Type Genes Regions SNPs InDels
Intra-specific Levels 1/59 1/240 0/1 1/1
Intra-specific Dynamics 22/50 31/201 30/57 5/13
Inter-specific Levels 2/86 2/317 -/68 -/12
Inter-specific Dynamics 59/72 113/257 -/3560 -/479
Genes, regions, SNPs, and InDels are the number significant out of the number tested. Individual SNPs and InDels
were not tested for the inter-specific library.
CRE: cis-regulatory element; SNPs: single-nucleotide polymorphisms; InDels: insertions/deletions.
Shih and Fay. eLife 2021;10:e68469. DOI: https://doi.org/10.7554/eLife.68469 7 of 23Research article Evolutionary Biology Genetics and Genomics
Figure 5. Intra-specific cis-regulatory elements (CREs) show differences in expression levels and dynamics. (A) YPS6 shows allele differences in
endogenous expression levels and dynamics. (B) CRE region 4 of the YPS6 promoter shows allele differences in expression levels, but is not correlated
with endogenous expression patterns. Substituting the Oak insertions/deletions (InDel) into the ChII allele (Oak v1) increases expression levels, but
substituting the Oak single-nucleotide polymorphism (SNP) into the ChII allele (Oak v2) has no effect. (C) ICL2 shows allele differences in endogenous
expression dynamics. Of the four SNPs and one InDel that differentiate the region 1 CRE alleles, two SNPs (v2 and v4) alter expression dynamics in both
the Oak and ChII background (D, E). (F) CRE region 3 of ICL2 has a single InDel between the Oak and ChII alleles and also shows allele differences in
expression dynamics. For panels (B), (D), and (E), CRE alleles are shown by rectangles with colored ticks to indicate the Oak and ChII variants. Bars
indicate standard errors. Arrows indicate the approximate time of glucose depletion.
The online version of this article includes the following figure supplement(s) for figure 5:
Figure supplement 1. Binding site and conservation scores of variants.
comparisons, more regions showed differences in expression dynamics (113) than expression levels
(2) between the two species’ alleles (Table 2).
Expression driven by chimeric sequences may lie within the range of the two parental species and
can be used to map parental differences to the proximal or distal portion of the cis-regulatory region
(Figure 6—figure supplement 1). However, chimera expression may also lie outside of the parental
Shih and Fay. eLife 2021;10:e68469. DOI: https://doi.org/10.7554/eLife.68469 8 of 23Research article Evolutionary Biology Genetics and Genomics
range if recombination brings together variants with effects in the same direction or if there are epi-
static interactions between variants. Such cis-regulatory interactions are thought to be common due
to binding site turnover (Zheng et al., 2011) and do not require expression divergence between the
parental species.
To map expression divergence and identify chimeras outside of the parental range, we tested
each of the two chimeras for differences with each parent. Out of the 113 regions with parental spe-
cies differences in expression dynamics, 57 were consistent with the proximal and 14 were consistent
with the distal region explaining the difference. For example, the proximal region of SDH4 can
explain the entire difference between the parental species’ alleles (Figure 6A, D). Examining all the
regions (n = 348), 88 chimeras showed expression dynamics that differed from both parents (FDR <
0.05). The majority of these chimeras are not intermediate between the two parents; in 63 cases, the
expression distance between the two parents was less than the average distance of the chimera to
either parent, and in 56 cases there was no difference between the two parents. As examples,
MDM36 shows chimera expression between the two parents (Figure 6B, E), and IDP2 shows chimera
expression outside the parental range (Figure 6C, F). For the 63 chimeras with high expression
Figure 6. Inter-specific cis-regulatory elements (CREs) show differences in expression dynamics. (A–C) Endogenous expression of S. cerevisiae (Scer)
and S. uvarum (Suva) alleles of SDH4, MDM36, and IDP2. (D–F) CRE-seq expression of region 3 (SDH4), region 1 (MDM36), and region 4 (IDP2) for
parental S. cerevisiae (red) and S. uvarum (blue) CRE alleles and both chimeric CREs. SDH4 shows expression divergence maps to the proximal
promoter region, MDM36 and IDP2 show chimera expression that differ from both parents, with the MDM36 chimeras being between the two parents
and IDP2 chimeras being outside the two parents. Bars indicate standard errors. Arrows indicate the approximate time of glucose depletion.
The online version of this article includes the following figure supplement(s) for figure 6:
Figure supplement 1. Identification of significant differences for the intra-specific and inter-specific cis-regulatory element sequence (CRE-seq)
libraries.
Shih and Fay. eLife 2021;10:e68469. DOI: https://doi.org/10.7554/eLife.68469 9 of 23Research article Evolutionary Biology Genetics and Genomics
distance from both parents, the expression of the chimera was outside the two parental values for
most (21.6/27) of the timepoints.
Discussion
Cis-regulatory sequences control the activation and repression of genes in response to cellular and
environmental signals, and the consequences of variation within these sequences are relevant to our
understanding of evolution and human disease. Much progress has been made in identifying cis-reg-
ulatory variants responsible for changes in gene expression levels. In this study, we identified and
characterized cis-acting variation in gene expression dynamics. We find that while gene expression
dynamics are interrelated to expression levels, they differ in the types and identities of variants per-
turbing them. Below we discuss the relationship between gene expression dynamics and other
aspects of gene regulation and how this fits into our understanding of regulatory evolution.
Gene expression dynamics are an integrated component of cis-
regulatory variation
We find, as expected, abundant cis-acting variation in gene expression dynamics. Despite the poten-
tial importance of changes in gene expression dynamics, they are not easily disentangled from other
aspects of gene expression such as levels and noise. In our data, roughly one-third of genes that
exhibit ASE dynamics also exhibit ASE levels (Table 1). This overlap is not unexpected as the tests
for ASE dynamics and levels are not mutually exclusive. For example, genes that exhibit differences
in expression levels after but not before the diauxic shift by definition also exhibit differences in
expression dynamics during the diauxic shift. While less common, we do find genes where ASE dif-
ferences are greatest during the diauxic shift, consistent with a change in the rate or timing of gene
activation/repression (Figure 2). How can the rate or timing of expression be altered without affect-
ing levels? Prior work has shown that chromatin mutants can slow gene activation without impacting
levels (Barbaric et al., 2001; Floer et al., 2010). While this does not exclude the possibility of
changes in binding sites, it points to changes in nucleosome positioning sequences in mediating
expression dynamics.
Gene expression dynamics may also be interrelated to stochastic noise in expression. During the
diauxic shift, there is cell-to-cell heterogeneity in gene expression and this leaky regulation can give
the appearance of a slower rate of activation at the population level (New et al., 2014;
Venturelli et al., 2015). Put differently, an increase in noise is expected to blur a sharp transition
between activated and repressed states. However, noise, levels, and dynamics are also not entirely
dependent on one another. For example, gene expression often occurs in bursts with expression lev-
els more dependent on burst size, noise more dependent on burst frequency (Cai et al., 2006;
Carey et al., 2013), and timing dependent on both changes in burst size and frequency. Thus, the
covariation between expression levels, dynamics, and noise likely shapes how gene expression
evolves within and between species.
Cis-regulatory variants underlying expression dynamics
Previous studies have characterized cis-regulatory variants underlying gene expression levels. We
find a number of results from studies of gene expression levels also hold for expression dynamics: (i)
a weak or no association between expression divergence and sequence divergence between species
(Tirosh et al., 2008; Zeevi et al., 2014; Li and Fay, 2017); (ii) 5’ InDels are more strongly associated
with expression differences than 5’ SNPs within species (Massouras et al., 2012); and (iii) within spe-
cies, the number of 5’ variants is associated with ASE and multiple cis-regulatory variants occur
within the same promoter region (Renganaath et al., 2020). One notable difference between ASE
levels and dynamics is that 5’ InDels show a stronger association with ASE. Below, we discuss these
results and some of the limitations of our study.
Based on the genome-wide logistic regression, we found InDels have larger odds ratios than
SNPs, indicating either larger effects or a higher proportion of variants affect expression. This result
is consistent with a larger effect of InDels found in an eQTL mapping study in Drosophila
(Massouras et al., 2012). However, a limitation of our genome-wide associations is comparing 5’,
coding and 3’ regions. First, the number of SNPs and InDels is correlated among 5’, coding and 3’
regions, making it hard to quantify their relative contribution. Second, the low odds ratios for 5’
Shih and Fay. eLife 2021;10:e68469. DOI: https://doi.org/10.7554/eLife.68469 10 of 23Research article Evolutionary Biology Genetics and Genomics
compared to 3’ region SNPs could be a consequence of the size of the region. The small (80 bp) 3’
regions may have a higher proportion of functional variants than the larger 5’ regions, which likely
contain a mixture of large effect promoter variants diluted by more numerous non-functional variants
outside of the promoter region. In a yeast eQTL study where direct comparison of 5’ and 3’ regions
was possible, the strongest associations were for regions immediately upstream and downstream of
the transcription start and termination sites, respectively (Kita et al., 2017). For the association with
3’ variants, it is worth noting that ASE may be driven by variants that affect mRNA decay rather than
transcription (Cheng et al., 2017).
We also found that 5’ InDels have stronger associations with ASE dynamics compared to ASE lev-
els. However, this difference was not present for genes with large allele differences, where both ASE
levels and dynamics were strongly associated with 5’ InDels (Figure 3—figure supplement 1). The
strong and more equivalent associations could be a consequence of the higher coincidence of both
ASE levels and dynamics for genes with large allele differences. We did not find an over-representa-
tion of InDels among causal variants identified in the CRE-seq assay. This difference may be a conse-
quence of a small sample size (n = 35). But it could also reflect our selection of genes with the
largest differences in ASE dynamics to test, and promoters with multiple SNPs being more likely to
cause large ASE differences than those with multiple InDels, which are more rare.
A previous study of cis-regulatory variants that affect expression levels in yeast found multiple cis-
regulatory variants per gene, and that cis-regulatory variants are more likely to disrupt conserved
sequences and alter transcription factor binding sites (Renganaath et al., 2020). We found that
nearly half of the genes (8/20) had more than one variant (2–5) associated with ASE dynamics, but
cis-regulatory variants associated with ASE dynamics were not associated with conserved sequences
or changes in predicted transcription factor binding sites. Beyond technical differences, the absence
of association with conserved sequences and binding sites could be related to differences in cis-reg-
ulatory variants underlying ASE levels versus dynamics, to the strains used in each study, or to our
smaller sample size. Strain differences may be relevant since we used variants between two wild
strains Oak and ChII, whereas Renganaath et al., 2020 used a wine and laboratory strain, the latter
of which has evolved under relaxed selection and has more deleterious variants (Gu et al., 2005;
Doniger et al., 2008). Consistent with a sample size explanation, we found that PhastCons conserva-
tion scores improved the odds ratios from genome-wide logistic regression of SNPs with ASE levels
and dynamics (Table S6 in Supplementary file 1).
Although powerful in throughput, the CRE-seq reporter assay has a number of limitations relevant
to our results. First, 130 bp CRE sequences do not capture the entire promoter and different regions
of a promoter often generate different patterns of expression. For example, a variant that modulates
expression may have little or no effect unless upstream activation sequences are also included in the
CRE. However, it is also possible that a variant affects expression regardless of the presence or
absence of other elements. The extent to which the effects of individual binding sites are dependent
on other sites forms the basis for the difference between the enhanceosome and billboard models
of cis-regulatory sequences (Arnosti and Kulkarni, 2005). A second limitation of our study is that
high-throughput reporter assays perform better with high levels of replication. Prior high-throughput
reporter assays have used tens or hundreds of barcode replicates per allele (Tewhey et al., 2016;
Renganaath et al., 2020). Our use of only four barcode replicates per allele likely limited our ability
to detect variants that affect ASE levels. This limitation applies less to ASE dynamics that are unaf-
fected by the mean expression of any single barcoded CRE. Given these limitations, not all cis-regu-
latory variants assayed by CRE-seq may have been detected.
Evolution of cis-regulatory sequences
Chimeric cis-regulatory sequence from different species often shows loss of function and supports
the binding site turnover model, whereby the chance gain of a redundant binding site enables loss
of another site without adverse effects on expression (Ludwig et al., 2000; Ludwig et al., 2005;
Arnold et al., 2014). We find that chimeric promoter regions from S. cerevisiae and S. uvarum often
generate expression dynamics outside of the parental species’ range. The chimeras thus provide evi-
dence for constraints on gene expression dynamics. However, we also find that cis-regulatory var-
iants within S. cerevisiae are not greatly enriched at conserved sites. These two observations are
consistent with a neutral model of expression divergence (Fay and Wittkopp, 2008), whereby small
changes in dynamics within species are neutral, but when neutral changes in different lineages are
Shih and Fay. eLife 2021;10:e68469. DOI: https://doi.org/10.7554/eLife.68469 11 of 23Research article Evolutionary Biology Genetics and Genomics
brought together they yield expression patterns that lie outside of the parent range and are unlikely
to be tolerated within a species. It is also possible that constraints on expression dynamics depend
on expression levels or noise. Indeed, the fitness effects of noise depend on expression levels
(Duveau et al., 2018). This emphasizes the importance of characterizing how fitness altering cis-reg-
ulatory variants affect all aspects of gene expression to understand the evolution of cis-regulatory
sequences.
Materials and methods
Key resources table
Reagent type
(species) or Source or Additional
resource Designation reference Identifiers information
Gene ALD5 Saccharomyces SGD:S000000875
(Saccharomyces Genome Database
cerevisiae)
Gene GND2 Saccharomyces Genome Database SGD:S000003488
(Saccharomyces
cerevisiae)
Gene PHO3 Saccharomyces Genome Database SGD:S000000296
(Saccharomyces
cerevisiae)
Strain, strain Oak; YJF153 PMID:12702333 YPS163 background
background
(Saccharomyces
cerevisiae)
Strain, strain Wine; YJF1442 PMID:16103919 UCD2120 background
background
(Saccharomyces
cerevisiae)
Strain, strain ChI; YJF1373 PMID:22913817 HN6 background
background
(Saccharomyces
cerevisiae)
Strain, strain ChII; YJF1375 PMID:22913817 SX6 background
background
(Saccharomyces
cerevisiae)
Strain, strain YJF694 PMID:19212322 N17 background
background
(Saccharomyces
paradoxus)
Strain, strain YJF1450 PMID:22384314 CBS7001
background background
(Saccharomyces
uvarum)
Recombinant pIM202 PMID:23921661 CRE cloning vector
DNA reagent
Sequence- S288c genome PMID:22384314
based reagent
Sequence- N17 genome PMID:22384314
based reagent
Sequence- CBS 7001 genome PMID:22384314
based reagent
Sequence- Oak genome This paper YJF153.fasta; https://doi.org/
based reagent YJF153.gff 10.17605/OSF.
IO/Y5748
Continued on next page
Shih and Fay. eLife 2021;10:e68469. DOI: https://doi.org/10.7554/eLife.68469 12 of 23Research article Evolutionary Biology Genetics and Genomics
Continued
Reagent type
(species) or Source or Additional
resource Designation reference Identifiers information
Sequence- Wine genome This paper BC217.fasta; https://doi.org/
based reagent BC217.gff 10.17605/OSF.
IO/Y5748
Sequence- ChI genome This paper HN6.fasta; HN6.gff https://doi.org/
based reagent 10.17605/OSF.
IO/Y5748
Sequence- ChII genome This paper SX6.fasta; SX6.gff https://doi.org/
based reagent 10.17605/OSF.
IO/Y5748
Sequence- Intra-specific This paper CRE_Libraries. https://doi.org/
based reagent CRE-library YJF1455.csv 10.17605/OSF.
IO/Y5748
Sequence- Inter-specific This paper CRE_Libraries. https://doi.org/
based reagent CRE-library YJF1484.csv 10.17605/OSF.
IO/Y5748
Commercial Dynabeads Invitrogen Invitrogen:61011
assay or kit mRNA Direct kit
Commercial YeaStar DNA kit Zymo Research Zymo:D2002
assay or kit
Commercial YeaStar RNA kit Zymo Research Zymo:R1002
assay or kit
Commercial Dynabeads Zymo Research Zymo:D2002
assay or kit mRNA Direct kit
Commercial Glucose (GO) Assay Kit Sigma Sigma:GAGO20
assay or kit
Software, BWA v0.7.5 PMID:19451168 RRID:SCR_010910 https://github.
algorithm com/lh3/bwa
Software, PicardTools v1.114 Broad Institute RRID:SCR_006525 https://github.com/
algorithm broadinstitute/picard
Software, GATK Haplotype Broad Institute RRID:SCR_001876 https://github.com/
algorithm Caller v3.3–0 broadinstitute/gatk/
Software, liftOver UCSC Genome RRID:SCR_018160 https://genome-
algorithm Browser store.ucsc.edu/
Software, Fastx-toolkit Hannon Lab RRID:SCR_005534 https://github.com/
algorithm agordon/fastx_
toolkit
Software, Bowtie2 v2.1.0 PMID:22388286 RRID:SCR_016368 https://github.com/
algorithm BenLangmead/
bowtie2
Software, Htseq-count PMID:25260700 RRID:SCR_011867 https://github.
algorithm com/htseq/htseq
Software, DESeq2 PMID:25516281 RRID:SCR_015687 https://doi.org/
algorithm 10.18129/B9.
bioc.DESeq2
Software, Patser PMID:10487864 http://stormo.wustl.
algorithm edu/software.html
Software, Custom R scripts This paper https://doi.org/
algorithm 10.17605/OSF.
IO/Y5748
Strains
Three strains of S. cerevisiae, one of S. paradoxus, and one of S. uvarum were crossed to a common
reference YJF153, a derivative of an S. cerevisiae oak isolate from North America (Table S1 in
Supplementary file 1). The three intra-specific hybrids were generated through crosses to a wine
Shih and Fay. eLife 2021;10:e68469. DOI: https://doi.org/10.7554/eLife.68469 13 of 23Research article Evolutionary Biology Genetics and Genomics
strain from North America (UCD2120 YJF153 = YJF1460) and two wild strains from China (HN6
YJF153 = YJF1454 and SX6 YJF153 = YJF1455). Strains were chosen to reflect a range of diver-
gence. The two strains from China are from two of the most divergent S. cerevisiae lineages: China I
(HN6) and China II (SX6) (Wang et al., 2012). The inter-specific hybrids were generated using S. par-
adoxus (N17 YJF153 = YJF1453) and S. uvarum (CBS7001 YJF153 = YJF1484). Diploid hybrids
were generated by mixing strains of opposite mating type and selecting for dominant drug resis-
tance markers present at the HO locus.
RNA-sequencing time course
Each hybrid strain was cultured in 125 mL YPD at 250 rpm at 30˚C with an initial density of ~3 106
cells/mL. Approximately 3 108 cells were taken at each timepoint, centrifuged, supernatant
removed, and flash frozen in liquid nitrogen. A total of 19 samples were collected during the switch
from fermentation to respiration with the most intense sampling occurring every 15 min after glu-
cose depletion (Figure 1—figure supplement 1). Glucose depletion was measured using a Glucose
(GO) Assay Kit (Sigma-Aldrich). RNA was extracted with phenol-chloroform and mRNA purified by
oligo-dT (Dynabeads mRNA Direct kit, Invitrogen). cDNA libraries were made by reverse transcrip-
tion, fragmentation, and adaptor ligation by Washington University’s Genome Technology Access
Center (GTAC). Adaptors contained 7 bp indexes for multiplexing samples. The pooled equimolar
libraries of 95 samples (19 sampling time 5 strains) were paired-end sequenced (2 40 bp) using
three runs of an Illumina NextSeq. A total of 1255.9 million paired-end reads were generated.
Reference genomes and variants
The genomes of the three S. cerevisiae strains were sequenced to generate reference genomes for
mapping RNA-sequencing reads and to identify variants associated with ASE. DNA was extracted
(YeaStar DNA kit, Zymo Research), libraries were generated by GTAC, and paired-end (2 101 bp)
reads were generated using an Illumina HiSeq 2500, resulting in 5.2–5.9 million paired reads per
strain. Reads were mapped to the S288c reference genome (R64-1-1) using BWA v0.7.5 (Li, 2013),
and duplicates were marked using PicardTools v1.114 (http://broadinstitute.github.io/picard/). SNPs
and InDels were called using GATK’s HaplotypeCaller v3.3-0 (Van der Auwera et al., 2013) follow-
ing InDel realignment, base recalibration, and variant recalibration using an independently derived
set of SNPs and InDels. The independent set of SNPs (21,327) and InDels (4748) was identified using
GATK after BWA mapping of 27 assembled genomes (Table S7 in Supplementary file 1) to the
S288c reference genome. Variants were filtered to remove variable sites with calls in fewer than 20
strains and minor allele frequencies of less than 15%. Using GATK’s tranche filter set to 99.9 (percent
sensitivity to the independent set of variants), we identified 222,589 SNPs and 20,485 InDels within
the three S. cerevisiae strains and S288c. The Oak strain is most closely related to the Wine strain
(76,659 variants), followed by China II (111,591 variants) and China I (128,346 variants).
Variants were used to generate reference genomes for mapping RNA-sequencing reads. Refer-
ence genomes were generated using the S288c genome as a template and GATK’s FastaAlternateR-
eferenceMaker command to incorporate variants present in each strain. Genome annotations were
generated using liftOver (Hinrichs et al., 2006) to transfer S288c annotations to each of the three
other genomes. For mapping inter-specific hybrid reads, we used reference genomes and annota-
tions (Scannell et al., 2011) for S. cerevisiae (S288c), S. paradoxus (N17), and S. uvarum (CBS7001).
Gene expression measurements
RNA-sequencing reads were mapped to combined reference genomes containing the genomes of
both parental strains used to generate the hybrid in order to avoid mapping bias. Reads were
demultiplexed using the Fastx-toolkit (http://hannonlab.cshl.edu/fastx_toolkit/) and then mapped to
combined reference genomes using Bowtie2 v2.1.0 (Langmead and Salzberg, 2012) using the local
alignment setting (–local) and a maximum of one mismatch in the seed alignment (-N 1). Duplicate
reads were marked using PicardTools. Htseq-count (Anders et al., 2015) was used to quantify ASE
by counting reads that mapped to each allele in the combined reference genomes. Reads mapping
to overlapping features (-mode union) and reads with a mapping quality less than 10 (default) were
not counted. Thus, reads that mapped equivalently to both alleles of a gene and assigned mapping
quality of 0 or 1 by Bowtie2 were removed. For inter-specific hybrids, we used previous definitions
Shih and Fay. eLife 2021;10:e68469. DOI: https://doi.org/10.7554/eLife.68469 14 of 23Research article Evolutionary Biology Genetics and Genomics
of orthologous genes (Scannell et al., 2011). The fraction of mappable reads used for ASE was
81.58%, 82.62%, and 83.11% for the intra-specific hybrids YJF1454, YJF1455, and YJF1460, and
86.16% and 86.57% for the inter-specific hybrids YJF1450 and YJF1484, respectively. None of the
intra-specific hybrids showed any mapping bias, except in YJF1454 genes on chromosome XIII R
showed uniformly higher expression of the Oak compared to the ChI allele consistent with aneu-
ploidy (Figure 1—figure supplement 2). The fraction of reads mapping to the common reference
YJF153 was 52.58% (50.59%, after removing chrXIII R), 50.11%, 49.78%, 49.11%, and 46.90% for
YJF1454, YJF1455, YJF1460, YJF1453, and YJF1484. The median number of allele-specific reads per
timepoint was 2.9 million reads (range: 1.5–4.8) for intra-specific hybrids and 2.0 million reads
(range: 1.4–3.3) for inter-specific hybrids.
Statistical analysis of differentially expressed alleles
ASE counts were normalized using DESeq’s blind method (Love et al., 2014). Differences in expres-
sion levels were tested using a weighted linear model: fi ¼ 0:5 þ b0 þ e, where fi is the normalized
frequency of the YJF153 reference allele over timepoint i, b0 is the deviation from 0.5, and e is the
error with weights based on the total number of reads at each timepoint. Differences in expression
dynamics were tested using a weighted Durbin–Watson test for an autocorrelation across timepoints
of the allele differences. The weighted Durbin–Watson test is based on the lmtest package of R
where the residuals (e) from the same linear model used above are used to calculate the test
statistic:
PT 1
ðwiþ1 eiþ1 wi ei Þ2
weighted dw ¼ i¼1 PT 2
i¼1 ðwi ei Þ
where wi and ei are the weights (read counts) and residuals for sample i out of T timepoints. For
both tests, we used FDR cutoffs of 0.01. For all analyses, FDR was calculated using the method of
Benjamini and Hochberg, 1995.
Ten permutations of the data were used to validate the statistical cutoffs. Permuting the counts
for the two alleles independently at each timepoint yielded an average of between 0.3 and 2.0 false
positive across the five hybrids at an FDR cutoff of 0.01 for the test of ASE levels. Permuting the
timepoints yielded an average of between 2.3 and 7.7 false positives across the five hybrids at an
FDR cutoff of 0.01 for the test of ASE dynamics.
Genes with low read counts were removed from the analysis: either those with less than an aver-
age of 20 reads per timepoint or more than seven timepoints with no reads. This filter eliminated an
average of 692 genes per hybrid and left a total of 4703 genes with data in all five hybrids.
Gene expression clusters
k-means clustering was used to group genes by their combined allele expression profile and by their
allele imbalance profile. For the combined gene expression profiles, 19,633 genes from all five
hybrids with a significant (FDR < 0.01) autocorrelation in the combined (both alleles) profile over
time were normalized (centered and scaled) and clustered into 12 groups. For the allele imbalance
profiles, allele frequencies were centered but not scaled for genes with significant ASE dynamics
(n = 6135) and clustered into 12 groups. For both, 336 genes without any reads at one or more time-
points were removed since k-means clustering does not handle missing data.
Association with variants
The numbers of SNPs and InDels for intra-specific hybrids were obtained from variant calling, and
the corresponding counts for inter-specific hybrids were obtained from multiple sequence align-
ments without correction for multiple hits (Scannell et al., 2011). Upstream intergenic regions were
defined by sequences between adjacent coding regions, except for cases of short (< 5 bp) or over-
lapping coding sequences where we extended the region to the next upstream gene. Downstream
intergenic regions were defined as 80 bp downstream of the stop codon. Coding regions included
all variants within them. Variant counts were obtained for all of the 4703 genes with expression data
except for 11 genes that only had counts for the intra-specific hybrids.
For logistic regression, we predicted genes with differences in ASE levels and dynamics
using logit ð pÞ ¼ b0 þ b1 x þ e, where p indicates whether a gene shows significant ASE or not, b1 is
Shih and Fay. eLife 2021;10:e68469. DOI: https://doi.org/10.7554/eLife.68469 15 of 23Research article Evolutionary Biology Genetics and Genomics
the regression coefficient, x is the predictive variable, and e is the error. We used a Bonferroni cutoff
for significance to correct for the 60 different regressions based on 6 predictive variables: number of
SNPs and InDels within upstream, downstream, and coding regions, and 10 response variables: ASE
dynamics and ASE levels in each of the five hybrids.
CRE-seq
A high-throughput reporter assay (CRE-seq) was used to measure the activity of CREs by sequencing
(Mogno et al., 2013). In this assay, a pool of synthetic cis-regulatory sequences are cloned en
masse, YFP is inserted between the CRE and the barcode, and the reporter library is then integrated
into the genome. The activity of each CRE is measured by the ratio of barcode sequencing reads
from an RNA relative to a DNA library of the pooled transformants. As described below, we used
this reporter assay to measure expression of 7268 and 7232 synthetic CRE sequences, representing
intra-specific and inter-specific allele differences upstream of 69 and 98 genes, respectively.
Synthesis
CREs were synthesized as part of a library of 200 bp oligos (Agilent). The synthetic oligos include a
forward primer, RS1, CRE, RS2, RS3, RS4, BC, RS5, reverse primer, where CRE is the cis-regulatory
element, RS1–5 are restriction sites, and BC is a barcode (Figure 4—figure supplement 1). The
barcodes were random 10 bp sequences with a minimum of two differences and no restriction sites.
The selected barcodes were checked to ensure no base composition bias. Target CRE sequences
were defined by the 250 bp region upstream of the TSS (Venters et al., 2011). For each target CRE,
five 130 bp sliding windows of the sequence were generated using a 30 bp step size. Any 130 bp
regions containing coding sequence of the next upstream gene were removed. Four replicates with
different barcodes were generated for each CRE. CREs were generated separately for each strain
allele unless the CRE window was identical between the strains. TSSs (Xu et al., 2009) were found
by liftOver from the reference (S288c) genome to the coordinates in the strain of interest. In cases
where the CREs contained InDels, extra sequence was added to the gapped allele between RS2 and
RS4 to keep the oligo length constant. CREs were also synthesized for intra-specific variants
between the Oak (YJF153) and China II strain (SX6). These CREs were designed by replacing a single
Oak variant by the China II variant and vice versa (Figure 4—figure supplement 1). Inter-specific chi-
meric CREs were generated by recombining the S. cerevisiae allele with S. uvarum allele at the cen-
ter of each CRE (Figure 4—figure supplement 1). The intra-specific and inter-specific libraries
respectively represented 334 and 452 regions upstream of 69 and 98 genes after removing regions
that overlapped with upstream genes, and contained a total of 7268 and 7232 synthetic CRE
sequences. Genes were chosen based on:the absence of restriction sites within the target CRE, an
annotated TSS, significant ASE levels and/or ASE dynamics, and inspection of the ASE differences.
For the 69 genes used for the intra-specific libraries, 19 showed ASE levels, 10 showed ASE dynam-
ics, and 40 showed both. For the 98 genes used in the inter-specific library, 23 showed ASE level, 10
showed ASE dynamics, and 65 showed both.
Cloning
CRE-seq libraries were amplified (eight separate reactions of 10-cycle amplification), digested, gel
purified, and ligated into pIM202 (Mogno et al., 2013). This differs from the original protocol that
used higher-resolution acrylamide gel extraction since sequencing the amplified library showed only
a small portion (You can also read