Cleanliness is Next to Income: The Impact of COVID-19 on Short-Term Rentals - American ...
←
→
Page content transcription
If your browser does not render page correctly, please read the page content below
Cleanliness is Next to Income: The Impact of
               COVID-19 on Short-Term Rentals ∗

                                         October 30, 2021

                                                Abstract
       The short-term rental market provides a close to real time signal of how events of
       regional and national importance can affect the demand for housing. We use Airbnb
       data from Austin, Texas to empirically investigate the impact of the onset of Corona
       Virus Disease 2019 (COVID-19) on the short-term rental market. Specifically, we
       employ a machine learning algorithm to create an extensive cleanliness dictionary to
       detect whether an Airbnb unit is clean. We use a difference-in-difference specification
       to value the change in income related to reviewer perceived cleanliness during the
       COVID-19 pandemic. We find the following results: First, available listings declined
       by 25% once the pandemic hit and those that remained lost 22% of their income and
       had occupancy decrease by 20%. Second, properties that were perceived to be clean
       increased their income by 17.5% and their occupancy by 16.5%, mitigating the negative
       shock due to COVID-19. Third, rental prices for clean Airbnb listings did not increase
       after COVID-19. In addition, we study the interaction of Airbnb supply on the long-
       term rental market during a market decline.

       Keywords: COVID-19, Pandemic, Airbnb, Short-Term Rental, Machine Learning,

       Small Business, Long-Term Rental

       JEL codes: R31

   ∗
     Lily Shen, Wilbur O. and Ann Powers College of Business, Clemson University, lilyshencal@gmail.com;
Sean Wilkoff, University of Nevada, Reno, swilkoff@unr.edu. We sincerely thank the helpful comments made
by our anonymous referees. Special thanks to Sean Larkin, Max Koch, Nguyen Bao Lam, and Alex Han for
their excellent RA work, and the Clemson Creative Inquiry for the generous research funding. All errors are
our own.
1 Introduction
On January 31, 2020, Coronavirus Disease 2019 (COVID-19) was declared a public health
emergency and deemed a national emergency in the United States (U.S.) in March 20201 .
For the first time in decades, the federal and state governments had to mitigate the effects
of a devastating pandemic. By October 2021, COVID-19 would lead to the death of over
743,000 people in the U.S. with no clear end in sight2 .
COVID-19 has impacted every aspect of the U.S. economy and the short-term rental
market is no exception. Even though the short-term rental market had $87 billion in revenue
in 20193 , it is one sector of the real estate market that has mostly been left out of the
growing literature documenting the impacts of COVID-19. While Alyakoob and Rahman
(2018), Barron et al. (2021), Àngel Garcia-López et al. (2020), and Xu and Xu (2021) study
the spillover effect of Airbnb to the regional economy, this paper aims to fill that gap and
analyze the impact of COVID-19 on Airbnb in order to highlight the value of cleanliness and
its impact on the short-term rental market during the pandemic.
Given the speed at which COVID-19 spread, the short-term rental market is an ideal
laboratory to study the value of cleanliness in the real estate market. While the effects of
COVID-19 on long-term rentals and housing purchases may have a delayed and dispersed ef-
fect on their respective markets, the short-term rental market has little contractual overhead
and instantaneous transactions, which make it easy to directly relate market adjustments to
events of regional and national importance like the pandemic. Instantaneous transactions
include the ability to book or cancel a property. During COVID-19, the ability to cancel
an Airbnb reservation became even less costly for occupants. They were able to cancel any
1
Five months in: A timeline of how COVID-19 has unfolded in the US, USA Today, Written
6/23/2020 https://www.usatoday.com/in-depth/news/nation/2020/04/21/coronavirus-updates-how-covid-
19-unfolded-u-s-timeline/2990956001/, Last checked 10/30/2020.
2
CDC COVID Data Tracker. https://covid.cdc.gov/covid-data-tracker/##cases casesper100klast7days,
Last checked 10/30/2021.
3
Vacation Rental Industry Statistics. https://ipropertymanagement.com/research/vacation-rental-
industry-statistics
1reservations on or after March 14, 2020 at anytime before check-in without penalty4 . This is
in contrast to the long-term market rentals or real estate purchases, where the parties cannot
cancel contracts or transactions without added fees. Herein, we define the short-term rental
market as furnished properties or spaces that are rented for short periods of time, usually
by the day. Furthermore, Airbnb rentals are preferable proxies for the short-term rental
market compared to hotels. While hotel demand is subject to brand recognition, credit card
rewards, and other potentially confounding variables, Airbnb property ownership is more
distributed and there is more variation in cleanliness from property to property.
The main variable that we consider in this study is the perceived cleanliness of the Airbnb
property. We focus on the impact of perceived cleanliness at the beginning of COVID-19
because there was uncertainty around exactly how COVID-19 was transmitted. There was
certainly concern over contracting COVID-19 by touching surfaces covered with the virus or
breathing air containing the virus. Therefore, we hypothesize that guests would make choices
of where they are staying based on perceived cleanliness during the pandemic. In this study,
perceived cleanliness is based on the reviews left by prior occupants. We find perceived
cleanliness to be a better proxy for information used by future guests compared to a host’s
own description of their property. We are able to use the variation in perceived cleanliness
between Airbnb listings to estimate the effect of perceived cleanliness on the income and the
occupancy of short-term rentals. Using Airbnb data, we estimate the change in income for
a short-term rental during the pandemic due to cleanliness and measure the overall impact
of COVID-19 on the short-term rental market.
Specifically, we examine Airbnb property data in Austin, Texas from July 2018 to July
2020. By analyzing Airbnb performance between July 2018 to July 2020, we have a clean
dataset with variation between perceived cleanliness before and during the pandemic. We
choose July 2018 as the start of our time frame because it allows us to have consistent
monthly data and it provides a full two years of data. This allows us to examine any
4
https://www.airbnb.com/help/article/2701/extenuating-circumstances-policy-and-the-coronavirus-
covid19, Last checked 10/30/2021.
2possible seasonal effects5 . We do not use any data after July 2020 because Airbnb mandated
a regulation requiring a minimum cleaning standard for Airbnb properties, which might
reduce the variation in perceived cleanliness, related to COVID-19, between properties6 .
In order to measure the COVID-19 impact on the short-term real estate market, we
needed to find a location that was operating with limited policy impact during the pandemic.
Austin is an ideal laboratory since the local authorities did not impose any mandatory travel
restrictions after COVID-19, allowing Austin to be open to visitors7 . By far, Austin is the
biggest Airbnb market in Texas, accounting for almost 30% of the 1.5 million Airbnb guest
arrivals in the state as of 2017. Austin, Texas also represents a fast growing market in
short-term rentals. Austin Airbnb rentals witnessed 449,200 guest arrivals in 2017 compared
to 325,400 arrivals in 2016, representing a 38% annual growth. Additionally, Austin is
considered one of the fastest growing economies in the US that offers many job and business
opportunities and is home to a university that attracts local and international students8 .
Therefore, the COVID-19 impact on Austin’s regional economics is of interest to many
researchers and policymakers.
We employ a difference-in-difference approach to compare Airbnb listings that have and
do not have clean reviews before and after the onset of the COVID-19 pandemic. We rely on
a novel natural language processing (NLP) method to construct a “cleanliness” dictionary
based on reviews left by past Airbnb occupants. Lawani et al. (2019) show Airbnb prices
are influenced by the user-generated reviews. We differentiate between clean and not clean
5
We control for any possible seasonal effects, including the peak and off-peak seasons and UT Austin’s
commencement in May. The cancellation of commencement the week of May 23rd, 2020 by UT Austin does
not drive our results. We find our results are not driven by the cancellation of graduation or the spring and
summer classes in 2020.
6
Our Commitment to Safer Travel: New Health and Safety Mandate, Airbnbś News, written 10/7/2020
https://news.airbnb.com/health-and-safety-mandate/, Last checked 10/30/2021.
7
Austin Texas Governor’s orders, government website https://www.austintexas.gov/department/covid-
19-information/orders-rules, Last checked 10/30/2021.
8
Should You Invest in Traditional Rentals or Airbnb Rentals in the Austin Real Estate
Market in 2018, written 7/28/2018 https://www.mashvisor.com/blog/austin-real-estate-market/, Last
checked 10/30/2021. According to the Bureau of Labor Statistics, Austin has a location quo-
tient of 0.93 for higher education. This means Austin has other industries besides the Uni-
versity that provide reasons that attract travellers. https://www.bls.gov/regions/southwest/news-
release/2021/occupationalemploymentandwages austin 20210625.htm, Last checked 10/30/2021.
3listings indexed by the language pertaining to “cleanliness”. We refer to Airbnb properties
with a clean review as “perceived clean” and properties without a clean review in a given
month as “not perceived clean.” The difference-in-difference regression allows us to estimate
the value of “cleanliness” in the short-term rental market during the COVID-19 pandemic.
We find the following results: First, available listings declined by approximately 25% once
the pandemic hit. Second, there was a 22% decline in income and a 20% decline in occupancy
for Airbnb properties due to the pandemic. Economically, this translates into a $502,113 per
month decrease in income9 . Third, properties that were perceived to be clean increased their
income by 17.5% and their occupancy by 16.5%, significantly mitigating the negative impact
of COVID-19. We find that being perceived as a clean property increases income relative
to not being perceived as clean even more during COVID-19. Fourth, prices for clean units
did not increase after COVID-19. Fifth, there is a positive relationship between the number
of Airbnb units and the long-term rental market prices in the city, which is consistent with
findings in Barron et al. (2021).
These results suggest that Airbnb hosts can increase their revenue by keeping their listing
clean during a pandemic. A listing that is perceived clean will encourage more occupancy
and lead to higher revenue. Additionally, we examine alternative theories as to what this
change might represent. We find that during the COVID-19 period, prices for “clean” listings
did not increase, suggesting the change in income is due to the increase in occupancy. Based
on prior reviews, occupants choose to stay in places they perceive to be clean. Our results
contribute to the literature on health effects as a priced real estate factor. Sun et al. (2019)
and Chay and Greenstone (2005) show that improvement in air quality is likely to stimulate
demand for housing in urban cities. We add on to this literature by examining the impact
of perceived cleanliness on Airbnb performance during a pandemic.
Our paper also contributes to the growing literature on the impact of COVID-19 on
9
The decrease in income is a short-term effect due to the reduction in occupancy. We find that the price of
Airbnb rentals has not significantly changed over our sample period. We do not know the long term impact
of the pandemic on Airbnb rental incomes because the pandemic is still ongoing. In the long run prices and
quantity of Airbnb units may readjust to a new equilibrium.
4the local economy (Coulson et al., 2021, Glaeser et al., 2021, Brough et al., 2021, Agarwal
et al., 2020, Ascani et al., 2020, Chen et al., 2020, and Ling et al., 2020). In addition, our
results are inline with extant findings on the impact of Airbnb on long-term rentals. Barron
et al. (2021) find that an increase in Airbnb listings leads to an increase in rents of 0.018%,
which translates to a $9 increase in monthly rent. We examine the impact of Airbnb on the
long-term markets during a negative shock to Airbnb supply. We find that a decrease in
Airbnb listings corresponds to a 0.7% decrease in monthly long-term rents, which translates
to a monthly decrease of $9.8. We also contribute to the large literature on big data by
using machine learning to create an extensive dictionary based on hundreds of thousands of
Airbnb reviews, which allows us to identify properties perceived as clean.
The paper is structured as follows. Section 2 provides a detailed description of the data,
which includes summary statistics. There is a discussion about the empirical methodology
in Section 3. The main results are presented in Section 4. Robustness tests are discussed
in Section 5. A discussion of the interaction of the short-term rental market and long-term
rental market is provided in Section 6. Section 7 concludes the paper.
2 Data and Descriptive Statistics
2.1 InsideAirbnb
Our paper uses Airbnb data, provided by InsideAirbnb, for short-term rentals occurring
between July 1, 2018 and July 31, 2020 in Travis County Austin, Texas. The majority of
Austin, Texas sits in Travis County. The Airbnb data includes more than 98% of Airbnb
listings in the city of Austin. As previously mentioned, this time period and location allows
us to directly examine the short-term rental market without COVID-19 related minimum
cleaning mandates from Airbnb or mandatory travel restrictions from the locality.
According to InsideAirbnb’s website, their data comes from “public information compiled
from the Airbnb website and the reviews for each listing.” We use two file sets extracted by
5InsideAirbnb each month: Airbnb listings and reviews. We cleansed, verified, analyzed and
aggregated the data.
The Airbnb listing data includes key property and host characteristics that allow us to
separate the effect of COVID-19 on Airbnb host income from other factors. The variables we
control for include: property location, number of bedrooms, number of bathrooms, property
type, type of space, Superhost status, allowable number of guests the property accommo-
dates, speed of booking, verified host, cancellation policy, and Airbnb Scores. Summary
statistics of these variables are provided in Section 2.2. Detailed definitions for income and
other variables can be found in Appendix: Table 1. Overall, the final data set includes 97,092
year-month listings of 6,460 unique properties.
The Airbnb reviews data includes each unique timestamped review for each Airbnb List-
ing. The data includes the listing ID, a reviewer ID, the date of the review, and the exact
comment left by the occupant. We use the comments left by occupants to create an indicator
for whether or not a listing is viewed as clean in a given month10 .
For this analysis, we filter down our dataset and use only active listings. We follow Zervas
et al. (2017), which requires the following criteria to qualify as active: 1) a property listing
exists in the listing data and 2) a review must exist during the sample period. Thus, we only
include Austin property listings in our dataset with at least one review in the July 2018 -
July 2020 time period. Our sample consists of houses and apartments.
2.2 Descriptive Statistics
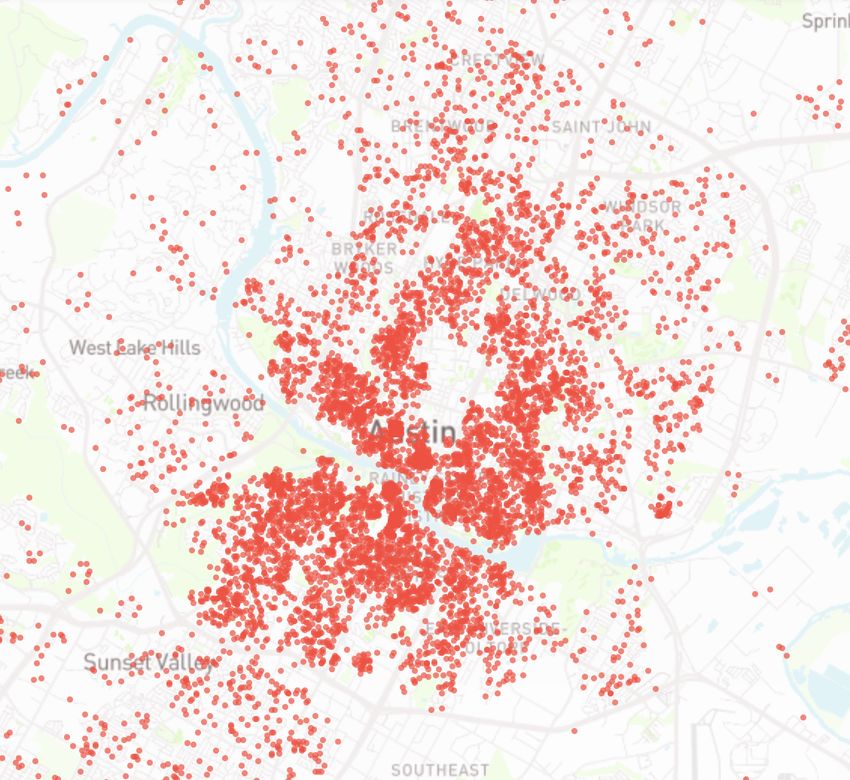
Figure 1 shows the geographical distribution of active Airbnb property listings spread through-
out Austin. There are 6,460 unique properties on the map that make up a total of 97,092
10
Only occupants that stayed at the Airbnb can leave a review but not every occupant does leave a review.
Although, in an unreported analysis, we find there is no shift in the tendency of guests to leave a review
from before the pandemic to during the pandemic, there might be a sample selection bias in the form of the
type of person that leaves a review overall. We follow the current literature including such papers as Barron
et al. (2021) and Chen et al. (2020) in assuming no sample selection bias in the data; however, any potential
sample selection bias would skew the data away from us finding a result. Overall, even with these potential
biases and conservative assumptions, we find statistically significant results.
6year-month listing observations. The properties are spread throughout the city with the
largest density of properties centered around downtown Austin and the University of Texas
at Austin.
Table 2 provides the descriptive statistics of all the Airbnb listings in our sample. The
average property has approximately two bedrooms, one and a half baths, and accommodates
approximately five people. Over 78% of the properties are entire space listings as opposed to
the 22% which are shared space listings. Houses make up 62% of the sample. About half of
the observations belong to Superhosts. A Superhost is an Airbnb designation that denotes a
host with good response time and good ratings11 . The average price is $215 with a standard
deviation of $273. The average income per month is $754, which is estimated monthly by
multiplying the average daily price by the occupancy. Occupancy is calculated as one night
plus twice the number of reviews received. This estimate is based on statistics provided by
InsideAirbnb, where 50% of bookings in Austin provide a review12 . Every listing is active,
so we assume that every listing had at least one booking. This also accounts for listings that
had no reviews, but still may have had a booking that did not leave a review. Additionally,
to provide a conservative estimate on income, we assume each booking is for one night13 .
The average property gets 1.6 comments per month, which translates into each property
being occupied for an average of 3.2 days14 .
We divided our year-month sample into pre- and during COVID-19 cohorts. Approxi-
mately 17% of the sample listings occur during COVID-19, which is in line with expectations;
the COVID-19 period takes up 20% of the sample’s time period. Using a data dictionary
on customer reviews (described in greater detail in Section 3.1), we labeled perceived clean
and not perceived clean properties based on monthly property reviews. We find that 28%
11
https://www.airbnb.com/help/article/828/what-is-a-superhost, Last checked 10/30/2021.
12
http://insideairbnb.com/austin/, Last Checked 10/30/2021.
13
Unfortunately, the actual length of stay of each guest is confidential data that Airbnb does not release.
We follow similar methods common in the literature: Barron et al. (2021), Valentin (2021), Àngel Garcia-
López et al. (2020), Chen et al. (2020), and Wyman et al. (2020). These papers assume each review translates
to a stay of a minimum of three nights. We are more conservative and only assume one night per review.
14
See Appendix: Table 1 for variable definitions.
7of the observations were year-month listings that were described as clean by reviewers. For
future reference, we shall refer to properties that were classified as perceived clean as “clean
properties” and properties that were not perceived clean as “not-clean properties”. As will
be discussed in detail, not-clean properties do not necessarily mean the properties were re-
viewed as unclean. They should be viewed as the set of properties where the algorithm
classification was outside the set of clean properties because “cleanliness” was not indicated
in the reviews. Our variable of interest in the regressions is COVID×Clean, which makes up
only 2.3% of the properties. This implies that not many properties were considered clean
during the COVID-19 time period.
Table 3 provides the summary statistics of sample listings segmented by pre/during
COVID-19 and by cleanliness classification. In Section 4.1, we discuss the similarities be-
tween perceived clean properties and not perceived clean properties. In terms of variables,
we see in Table 3 that on average the two groups, both pre- and during COVID-19, have
similar property and booking characteristics (e.g. bedrooms, bathrooms, accommodation,
space, house, and cancellation policy). One main difference between perceived clean and not
perceived clean cohorts is in the percentage of overall Superhosts, which not surprisingly
are a larger fraction of the perceived clean properties. Furthermore, the properties with
clean reviews also receive more reviews on average both before COVID-19 and during. We
provide a comparison of income, occupancy, and price in Figures 3, 4, and 5, respectively,
and provide a detailed analysis of their trends pre-COVID-19 in Section 4.1.
Figure 2 shows the number of active Airbnb listings available each month during our
sample time period. The number of properties listed started to decline around March 2019.
The COVID-19 pandemic drastically decreased the number of listed properties on Airbnb in
Austin by over 25%. The active listings went from a peak of approximately 4,422 in March
2019 to 2,831 in July 2020.
83 Empirical Methods
In this paper we examine the impact of COVID-19 on the short-term rental market us-
ing a difference-in-difference framework. COVID-19 provides an exogenous shock to both
regional and national short-term rental markets. The first case of COVID-19 in the U.S.
was confirmed on January 21, 2020, but it was not until March 13, 2020 that America de-
clared a national emergency15 . Since COVID-19 was downplayed in the U.S. until March,
we use March 2020 as the month the event began. All observations prior to March 2020 are
pre-COVID-19, and any observations during or after March 2020 are during COVID-19.
Our research design follows three steps. First, we use a machine learning (ML) natural
language processing (NLP) algorithm to build a Clean dictionary of words that appeared in
Airbnb reviews. Second, based on the appearance of “clean” or “dirty” words used in each
Airbnb review, we create an indicator variable (Clean) for each Airbnb listing each month.
Finally, we estimate the impact of perceived cleanliness on Airbnb operational outcomes
during COVID-19 using a hedonic framework.
In order to estimate the effect of COVID-19 on the short-term rental market, we fit the
following difference-in-difference model:
ln(Outcomeit ) = α + γ1 Cleani + δCOV IDt + βit (COV IDt × Cleani,t ) + Xit0 θ + it (1)
where Outcomeit is one of three different outcome variables we examine for property i in
month t including: Income, Occupancy, and P rice, all of which are defined in more detail
in Appendix: Table 1. Xi,t is a matrix of controls that include physical characteristics of the
properties and booking characteristics along with year and location (zip code) fixed effects,
θ is a vector of the corresponding coefficients, and it is a property month error term. We
cluster standard errors by zip code to control for location unobservables.
15
Five months in: A timeline of how COVID-19 has unfolded in the US, USA Today, Written
6/23/2020 https://www.usatoday.com/in-depth/news/nation/2020/04/21/coronavirus-updates-how-covid-
19-unfolded-u-s-timeline/2990956001/, Last checked 10/30/2021.
9Our results focus on three variables: COV IDt , Cleani,t , and COV IDt ×Cleani,t . COV IDt
takes on the value of 0 if the observation is pre-COVID-19 and a value of 1 if the obser-
vation occurs during COVID-19. Cleani takes on the value 1 if the listing has a cleanli-
ness Score (Score) of 1 or greater based on reviews left in month t-1 and 0 otherwise16 .
COV IDt ×Cleani,t is the interaction between COVID and Clean. A listing that has a positive
Score after COVID-19 would be 1 and 0 otherwise. The coefficient on COV IDt × Cleani,t is
the impact of a listing being perceived as clean on the outcome variable. COV IDt × Cleani,t
is the variable of interest in this study. Section 3.1 discusses the detailed construction of the
machine learning driven cleanliness indicator (Clean) based on guest reviews.
There are numerous variables besides cleanliness that affect income, occupancy, and
price for Airbnb rentals. Therefore, we include a matrix of controls Xit that include physical
characteristics such as: bedrooms, bathrooms, capacity, property type, space type, and
booking characteristics such as: instant booking, Superhost, verified host, the cancellation
policy, and Airbnb Scores. These variables are all defined in Appendix: Table 1.
One condition for the validity of a difference-in-difference model is that each dependent
variable has a parallel trend between the treatment and control group prior to the event
date. We test income, occupancy, and price to make sure we have parallel trends prior to
COVID-19. We use a placebo test based on the same difference-in-difference specification
above, but instead of the full sample we use observations from July 2018 through July 2019
and treat March 2019 as the event date.
3.1 Clean Dictionary
Our ability to measure the impact of cleanliness on income, occupancy, or price will be
determined by our cleanliness measure. The cleanliness indicator we create is crucial to our
identification strategy to identify the impact of COVID-19 on the short-term rental market.
Therefore, it is important that we can identify which listings would be perceived as clean by
16
Score is defined in Appendix: Table 1
10occupants. In order to create an indicator for whether a listing is perceived as clean, we first
need to identify an extensive list of words that imply clean or dirty in the reviews. Typically,
building a customized dictionary from a large textual database is labor-intensive and time
consuming (Loughran and McDonald, 2011).
In recent years, the advancements in machine learning natural language processing algo-
rithms have made the timely construction of an accurate and customized dictionary possible.
Natural language processing (NLP) algorithms use quantitative approaches to process hu-
man language. In this paper, we rely on an NLP algorithm to build a dictionary of words
and phrases that are used in Airbnb reviews to indicate that a unit is clean. We follow
the method introduced in Mikolov et al. (2013) and Li et al. (2020) to create a cleanliness
dictionary based on reviews in our data. Mikolov et al. (2013) introduce a neural network
model that measures associations between words using the context in which they appear.
For every seed word provided by the researchers, the algorithm is able to return an extensive
list of synonyms that appeared in the textual database. The mathematical derivation of such
an NLP model and its relevance to the widely used maximum likelihood model in economics
are detailed in Shen and Ross (2020) and Ambrose et al. (2020).
Using this method and all guest reviews in our data, we create two dictionaries using two
seed words: clean and dirty. Each seed word provides us with a list from which we select
the most relevant and related words. These lists are comprised of singular words, two word
(bigrams), and three words (trigrams). The ultimate word lists and their frequency in the
comments is presented in Table 1. The singular words for “clean” includes derivations of
clean, spotless, neat, immaculate, tidy, pristine, sanitiz, uncluttered, disinfect, and declutter.
The singular words selected from the list generated by dirty are derivations of dirt, dust,
stain, mold, cockroach, filth, clutter, gross, mess, disgusting, messy, messed, grimy. These
singular words and all their derivations and negations are used when searching through a
review.
Table 1 provides the singular words used and the list of negated clean words that are
11used to create the Score variable. Table 1 also provides the number of reviews that contain
the dictionary word or a derivative of them. “Clean” appears in the most reviews with a
total of 40,351 reviews. The next two largest are “spotless” and “neat” with 1,528 and
866, respectively. “Dirt” appears in the most reviews of the dirty words with a total of 863
reviews. Out of a total 140,601 reviews left by occupants, 44,509 reviews have a clean word,
2,462 have a dirty word, and 437 have a negated clean word. The remaining reviews do not
have any clean or dirty words.
Appendix: Table 2 provides examples of reviews and the score they would receive based
on our method. One example of a clean review reads:
“She was very welcoming! It was a last-minute trip but she was very helpful and accommo-
dating! The place was very clean.”
Because the word clean appears once in this review and there are no negations or dirty
words, this review would have a Score value of 1. In contrast, a dirty word example reads:
“Great location, not clean.”
This review would have a Score of -1 because of the words “not clean”. Additional examples
and their corresponding Score can be found in Appendix: Table 2.
We create a cleanliness indicator to proxy for the perceived cleanliness of the listing
during a given month. The clean and dirty dictionaries allow us to count the number of
clean and dirty words received by a listing on a monthly basis. We use all the reviews of
a listing in month t-1 to calculate the cleanliness indicator for month t. For a given listing
and month, if a word from the clean word dictionary appeared in a review, then the Score
increases by one. If a word from the dirty dictionary appeared in a review for that listing,
then the Score decreases by one. The clean indicator is defined as one if Score is positive
and zero otherwise17 .
17
We recognize that there are alternative rules to create the Clean indicator, such as counting the number
of clean/dirty reviews instead of words. Our results are robust to those alternative measures.
124 Empirical Results
4.1 Parallel Trends
One of the underlying assumptions when employing a difference-in-difference model is that
the treatment and control group follow similar trends before the treatment. To validate our
difference-in-difference model, we demonstrate that properties perceived clean and properties
not perceived clean were similar in all observable variables, including our dependent variables
income, occupancy, and price.
Figures 3, 4, and 5 show the median monthly income, occupancy, and price of properties
perceived as clean compared to properties not perceived as clean without controlling for
any other characteristics. The two groups share the same trend before COVID-19. Figure
3 displays the monthly income. The solid line represents properties perceived as clean,
while the dashed line represents the properties not perceived as clean. Before COVID-19
the two lines have the same trend, and they both decrease with COVID-19, but properties
perceived as clean rebound significantly more than properties not perceived as clean. The line
representing properties perceived as clean increases sharply, while the not-clean properties
line remains flatter. Figure 4 outlines the average number of nights Airbnb units perceived
as clean were booked compared to the properties not perceived as clean. We find the results
for the average number of nights booked, which factors into income, are similar to the results
for income. The number of bookings for clean properties increases sharply after COVID-19,
and the line for properties without clean reviews remains flat. We examine the trends in
pricing in Figure 5 and find that prices, the other factor in income, follow the same trend
up until the beginning of COVID-19. The prices appear to be closer after COVID-19, unlike
the separation that occurs between income and occupancy. However, these results do not
control for any property characteristics, except if a property was perceived as clean or not.
The results in Figures 3, 4, and 5 confirm that a difference-in-difference model will provide
valid results to examine the impact of COVID-19, while controlling for additional observable
13and unobservable factors.
4.2 Difference-in-Difference
We use the empirical specification outlined in equation (1) to examine the impact of COVID-
19 on short-term rental markets. Specifically, we focus on the impact of COVID-19 and the
marginal impact that being perceived as clean has on income, occupancy, and price.
In Table 4 we report our empirical results examining the impact of COVID-19 on Airbnb
host’s income and occupancy. The dependent variable in Column (1) and Column (4) are
income and occupancy, respectively. This baseline specification includes location and year
fixed effects as well as property characteristics. Columns (2) and (5) include the same controls
as well as additional booking characteristics. The booking controls include: if the property
can be instantly booked, if the host has been verified, and if the cancellation policy is strict
or moderate. Our explanatory power (R2 ) increases as we add in booking controls. Columns
(3) and (6) include the same controls as Columns (2) and (5) and adds Airbnb Scores for
location, communication, check-in, and listing accuracy. Further detailed descriptions of all
variables can be found in Appendix: Table 1. We find that the results are consistent under
specifications in Columns (1)–(3) and (4)–(6). Therefore, the rest of the section will focus
on interpreting the results in Columns (3) and (6).
Our results indicate that the onset of COVID-19 caused a decrease in income in the
short-term rental market. The coefficient estimate for the COVID indicator in Column (3)
of Table 4 suggests that during COVID-19, income of Airbnb properties in Austin decreased
by 22%. Since our dependent variable is the natural log of income, the coefficients can be
interpreted as a percentage change. However, the coefficient first has to be transformed with
the following transformation (ecoef f icient −1)×100. The 22% decrease is both statistically and
economically significant. The average monthly income per listing is $754, so economically the
impact of a 22% decrease in income is $167 per month per listing. There are approximately
3,000 active listings after COVID-19 began. A conservative estimate that does not account
14for lost income to the Airbnb listings that stopped being active would be to multiply the $167
per listing by the 3,000 active listings. This would yield an impact on the Austin Airbnb
market of $502,113 per month.
Table 4 Column (3) reports a statistically significant coefficient estimate of 1.223 on
Clean, which implies that properties perceived as clean have on average a 239% higher
income than properties not perceived as clean. Given that properties perceived as clean
have a higher average income, the result we are most interested in is the marginal impact
of being perceived as clean during the pandemic. The statistically significant coefficient
on the COVID×Clean interaction term of 0.162 provides the result. The coefficient on
COVID×Clean is statistically and economically significant and translates to an extra 17.5%
in income or in dollar terms an extra $132 per month for properties perceived as clean during
COVID-19.
Overall, our results suggest that during the pandemic all properties lost income on av-
erage. Properties not perceived as clean lost $167 per month while properties perceived as
clean saw their income decrease by $35 ($167 minus $132).
Further examination of column (3) shows that the other control variables are all sig-
nificant except for Airbnb Score. While standard controls help to determine the monthly
income, Airbnb Score does not.
After finding that properties perceived as clean were not impacted as greatly as those
not perceived as clean during COVID-19, we next explored the channel through which the
perceived properties could earn more income than properties not perceived to be clean.
Income is calculated by multiplying occupancy by the price, which means that there are
only a few ways that income can be affected. The price for perceived clean properties
could increase during the pandemic, and occupancy could stay the same. Occupancy could
increase, and the price could remain the same, or both occupancy and price could increase.
We explore both channels using a difference-in-difference approach with occupancy and price
as the dependent variable. The results for occupancy are reported in Table 4 columns (4)-(6)
15while the results for price are reported in Table 5.
Table 4 Column (6) reports a statistically significant coefficient of -0.227 during COVID-
19, which implies that all properties saw an average decline of 20% in occupancy. We also
find that properties perceived as clean have on average 287% larger occupancy compared to
the rest of the units based on the Clean indicator coefficient estimate of 1.352. A statisti-
cally significant coefficient of 0.153 on the (COVID×Clean) interaction reports the marginal
impact of being perceived as clean during COVID-19 on occupancy. This translates to an
increase of 16.5% in occupancy for properties perceived as clean over properties not per-
ceived as clean. The result implies that occupants are even more likely to choose properties
perceived as clean than they were before COVID-19. This suggests that the marginal in-
crease in income to properties perceived as clean came at least partially from the increased
occupancy. Next, we turn to the analysis of Airbnb prices to investigate if occupancy alone
is responsible for the marginal increase in income during COVID-19 for properties perceived
as clean.
In Table 5 columns (1)-(3) we examine the results from a model with the same specifi-
cations as in Table 4 but with price as the dependent variable. Similar to Table 5, we find
that the different model specifications across columns (1)-(3) do not affect the significance
of our results. Overall, Airbnb prices in Austin decreased. The coefficient on the COVID
indicator is -0.024 and is statistically significant, which implies that Airbnb prices decreased
by 2.37%. However, we find that the coefficient on COVID×Clean, 0.009, is not statistically
significant. Our results suggest that prices went down on average for all Airbnb properties
in Austin and being perceived as clean did not impact the price the property charged. This
implies that the increase in income to properties perceived as clean is not due to a marginal
difference in price, but is a result of the marginal increase in occupancy. Therefore, we find
that during the pandemic, occupants worried more about their exposure to COVID-19 and
chose to stay in properties viewed as clean instead of taking a risk and staying in not-clean
properties.
16Furthermore, examining the coefficient on the wide range of property controls shows our
price estimates are consistent with those reported in Lawani et al. (2019). For example, Table
5 shows the coefficient for an additional bedroom is 0.163 and is statistically significant at
the 1% level. The hedonic price coefficient reported in Lawani et al. (2019) is 0.168 and
is statistically significant at the 1% level. Chen et al. (2020), which examines the impact
of COVID-19 and lockdown on Airbnb hosts in Sydney, Australia, find that Airbnb host
income decreased by 89.5%, between January 2020 and August 2020, and the number of
Airbnb properties actively listed declined by 82%. The authors focus on Sydney which was
under lockdown during their sample period. In contrast, we examine the impact of COVID-
19 on the Austin, Texas Airbnb market. As Austin, Texas did not have any lockdown or
other restrictions, we measure the impact of COVID-19 without government restrictions on
Airbnb properties. Additionally, we show that during the pandemic, prices for properties
did not increase in the short-term rental market.
5 Robustness
In Section 4.2, we document that the positive and statistically significant interaction effect
(COVID×Clean) on monthly income and occupancy is due to the reduced risk to contract
COVID-19. In this section, we implement several robustness exercises to address the possible
concerns that our main findings might have been driven by other confounding factors.
5.1 Placebo Test
In order to eliminate the possibility that our results are a product of confounding seasonal
factors that coincided with COVID-19, we conduct a placebo test to examine the data over
the same months but a year prior. Specifically, we perform three exercises to estimate
our primary specifications on observations between July 2018 to July 2019 and change the
beginning of COVID-19 to March 2019. We use the period July 2018 to July 2019 as a
17placebo time frame for COVID-19 so that the placebo event takes place at the same time
of year as our model regression. We use the same time frame in the placebo regression
to account for possible seasonal effects. We choose this time frame instead of earlier years
because by examining the change in prices from March 2019 through July 2019, we are able
to replicate the same change in months as our standard specifications except for one year
prior. This eliminates the idea that the change in income was due to a seasonal effect that
would have happened in March 2020 regardless of COVID-19. In addition, if we find no
statistically significant result for the placebo test, it is further support that we meet the
parallel trends criteria for our difference-in-difference model.
Table 6 displays the placebo test results. The model specifications for Columns (1)-(3)
in Table 6 correspond to those in Column (3) and Column (6) in Table 4 and Column (3)
in Table 5, respectively, except that we changed the beginning of COVID-19 and the data
sample period. Columns (1), (2), and (3) display results using a subsample of the Airbnb
data from a time (July 2018 to July 2019) that predates COVID-19. The coefficients that are
displayed correspond to the placebo COVID indicator for March 2019, the Clean indicator,
and the variable of interest COVID×Clean. The control variables have been suppressed to
focus on our results.
Column (1) in Table 6 displays the results for Ln(Income) as the dependent variable.
We find that the coefficient on the Placebo COVID indicator is significant and positive,
implying that the income increased from July 2018 through July 2019. We also find a
positive significant coefficient for clean properties which confirms that properties perceived
as clean receive more income than properties that are not perceived as clean on average.
The coefficient on COVID×Clean is not statistically significant. This implies that there is
no marginal benefit to being perceived as clean between March 2019 and July 2019, relative
to not being perceived clean from July 2018 to March 2019. Additionally, this suggests that
the income of properties perceived as clean and properties not perceived as clean follow the
same trend from July 2018 to March 2020. This provides further support for the validity of
18our difference-in-difference results with income as the dependent variable in Section 4.
The results of the additional regressions with the same specification for occupancy and
price are displayed in Columns (2) and (3), respectively. Similar to Column (1) we find that
the coefficient on the Placebo COVID indicator in Column (2) is positive and significant.
This implies that occupancy for Airbnb properties in Austin increased between July 2018
and July 2019. Based on the coefficient for the Clean indicator, we also find that properties
perceived as clean have more nights booked on average than properties not perceived as
clean. The coefficient on the COVID×Clean indicator is not statistically significant. This
finding implies that the difference between the occupancy for properties perceived as clean
and properties not perceived as clean stayed the same statistically from July 2018 through
July 2019. The prior result supports the validity of our occupancy analysis in Section 4.
Our results reported in Column (3) are similar to our results in Columns (1) and (2). The
coefficient estimate on the Placebo COVID indicator in Column (3) is positive and significant
but only at the 10% level. All previous coefficients described were significant at the 1% level.
We find that the coefficient estimate on the COVID×Clean interaction is not statistically
significant. This implies that the difference between the price of properties perceived as clean
and properties not perceived as clean stayed the same from July 2018 through July 2019.
The prior result provides support for the validity of our difference-in-difference regression
with price as the dependent variable in our main results section.
The takeaway message from the statistical insignificance of the placebo interaction term
(COVID×Clean) in Columns (1)-(3) is that our main results are not from a seasonal effect
that occurs between March and July every year. If that was the explanation, then we would
expect to find a statistically significant result for our placebo test. Our results are consistent
with our explanation that properties perceived as clean had an increase in their income
during COVID-19. Overall, our robustness results provide further support that our results
are valid and that the results are not caused by some seasonal feature found between March
and July.
195.2 Alternative Channels
In this section we provide analyses to address two potential factors that might be driving our
results: the impact of UT Austin cancelling commencement ceremonies in 2020 and hotel
vacancy.
5.2.1 UT Austin Graduation
In May 2020, UT Austin cancelled its graduation, which may have impacted the demand
and price for Airbnb units and ultimately the income derived from rentals in that month.
It is worth mentioning that although UT Austin is a large university, the city of Austin is
much more than a university town. The city is home to many businesses across numerous
industries and is an entertainment destination for many visitors. According to the Bureau of
Labor Statistics, Austin has a location quotient of less than one (0.93) for higher education,
indicating that travellers visit Austin for more than just the university18 . However, to
formally eliminate the concern that our results are driven by the cancellation of UT Austin’s
graduation in May 2020, we conduct several robustness tests to control for the graduation
effect. Specifically, we perform three alternative regression specifications for each of our
outcome variables: income, occupancy, and price.
Table 8 shows the results for the alternative specifications for monthly income and oc-
cupancy. Our results show that while there is a weakly significant premium associated with
UT Austin’s graduation month, this premium does not affect our results. The regression
specification in columns (1) and (5) of Table 8 correspond to the regression specification
in columns (3) and (6) in Table 4, respectively. They represent the difference-in-difference
regression specifications without controlling for UT Austin’s graduation. In order to control
for a possible graduation effect, the first alternative regression specification shown in col-
umn (2) and (6), for dependent variables of income and occupancy, respectively, include an
18
https://www.bls.gov/regions/southwest/news-release/2021/occupationalemploymentandwages austin 20210625.htm,
Last checked 10/30/2021.
20additional control variable, a dummy for UT Austin’s graduation month. The graduation
dummy variable takes on the value of 1 if the observation comes from May of 2019 or May of
2020, and 0 otherwise19 . We find that the coefficients on (COVID×Clean) that represent the
marginal impact of being perceived as clean during COVID-19 on income and occupancy are
0.163 and 0.153, respectively, and are statistically significant. These coefficients are the same
magnitude and statistical significance of our results without the inclusion of a graduation
dummy.
The second specification applied to income and occupancy are represented by columns
(3) and (7), respectively. The second specification is our original specification but excludes
observations that occurred during May 2019 or May 2020, reducing the number of observa-
tions in the sample. Again, our primary results are robust, suggesting that the cleanliness
premium is not driven by graduation months.
The third specification, represented in columns (4) and (8) for income and occupancy,
respectively, is the same as the regression specification in columns (3) and (6) in Table 4,
respectively with the exclusion of observations that occurred during the cancelled graduation
in May 2020. Our results remain robust to this third specification20 .
The same three alternative specifications, described above, controlling for the graduation
effect are applied to the price outcome variable. The results are shown in Table 9. Our result
that price is not impacted during COVID-19 holds even when controlling for a graduation
effect. The magnitude of the coefficient on (COVID×Clean) in all columns of Table 9 are
the same and all are statistically insignificant.
In all three alternative specifications, we find that our baseline results hold. The coeffi-
cients of interest are highly statistically significant and suggest that the increase in premium
for cleanliness during COVID-19 is not caused by UT Austin’s graduation.
19
We use UT Austin’s graduation month and not week due to the fact that our analysis is run at the
monthly level.
20
We cannot use a dummy in this case because May 2020 is during COVID-19 and therefore is colinear
with our COVID dummy.
215.2.2 Hotel Vacancy
As an additional robustness check, we consider the possibility that hotel vacancies may
impact Airbnb host income, occupancy, and price. In order to rule out that hotel occupancy
drives our result we run additional analyses. We first examine the trend in hotel occupancy
over our sample period. Figure 6 shows that the trend in hotel occupancy rate decreases
in response to COVID-19. We see a similar pattern in Airbnb occupancy over the same
period as shown in Figure 4. Table 7 provides descriptive statistics of hotel occupancy and
natural log of hotel occupancy over our sample period. Hotel occupancy is reflected as the
percentage of hotel rooms that are occupied in a given month. On average, hotel occupancy
was 59.26% over our sample period from August 2018 through November 2020 but reached a
low in April 2020 of 24.50%. While hotel occupancy did increase after April, the rate stayed
below pre-COVID-19 rates.
The results of our additional analyses including hotel occupancy can be found in Tables
10 and 11. The analysis in Table 10 includes two specifications in addition to our baseline
specifications in column (1) and (4) of Table 10 taken from columns (3) and (6) of Table
4. Specifically, we perform two alternative regression specifications for each of the outcome
variables: income, occupancy, and price. The first specification takes our standard framework
and includes a variable measuring the hotel occupancy rate. We find that the coefficient on
hotel occupancy is statistically significant and 0.011 and 0.010 for income and occupancy,
respectively. We also find that the coefficients on (COVID×Clean) in columns (2) and (5),
which represent the marginal impact of being perceived as clean during COVID-19, on income
and occupancy are 0.137 and 0.133, respectively, and statistically significant. Even though
we find that hotel occupancy impacts Airbnb income and occupancy, hotel occupancy does
not affect the magnitude or significance of the “Clean” premium. The results show that
the premium on COVID-19 is insignificant. This is due to the fact that the decline in
hotel occupancy is correlated with COVID-19. We also find that there is still no impact on
Airbnb price after controlling for hotel occupancy in column (2) of Table 11. The second
22hotel occupancy specification replaces hotel occupancy rate with the natural log of the hotel
occupancy rate.
Our results in Table 10 and Table 11 show that hotel occupancy or the natural log of
the hotel occupancy rate are related to Airbnb bookings, host income, and Airbnb price.
In all specifications, hotel occupancy and the natural log of hotel occupancy are positive
and statistically significant. However, we note that our main findings remain qualitatively
and quantitatively similar with the inclusion of the hotel occupancy variables. Our results
align with the literature that examines the connection between hotel occupancy and Airbnb
overall.
The takeaway message from our hotel vacancy robustness check is that our main results
are not due to or impacted by hotel vacancy. If hotel vacancy was responsible for our
“Clean” premium, then we would expect to find a statistically insignificant or different
magnitude result for our income and occupancy regressions. Our results are consistent with
our explanation that properties perceived as clean had an increase in their income during
COVID-19.
6 Discussion: Airbnb and Long-Term Rent
Since Airbnb was founded, research has sought to examine the impact of Airbnb on the
long-term rental market (See e.g., Horn and Merante, 2017, Àngel Garcia-López et al., 2020,
and Barron et al., 2021). The extant literature finds that an increase in available Airbnb
units increases long-term rents across a variety of different markets. For example, in the
most comprehensive study spanning the entirety of the U.S., Barron et al. (2021) find,
at the median owner-occupancy rate zip code, that an increase in the number of Airbnb
listings by 1% corresponds to a 0.018% increase in long-term rents. Similarly, Coulson et al.
(2020) find that reduced supply of lont-term rental units will eventually increase local rent
prices. Further, extant studies examine the impact of short-term rentals on the long-term
23rental market during periods in which the number of available Airbnb units were increasing.
In contrast, our study allows us to briefly examine what happens to the long-term rental
market as the supply of Airbnb properties declines, especially following the onset of COVID-
19. Thus, we provide some insight into the relationship between short-term rentals and the
long-term rental market during a period in which the short-term rental market experienced
a negative shock.
Table 7 provides descriptive statistics of the number of Airbnb units, monthly percentage
change in Airbnb, monthly long-term rents in Austin, and the monthly percentage change in
the long-term rents over our entire sample. We used the Zillow rent index for Austin as the
source of our long-term rents21 . The zillow rent index is the same data used in the literature
examining Airbnb impact on long-term rents. We see that, on average, the supply of Airbnb
properties decreased by 1% per month and had a maximum monthly decrease of 12% over
the sample period. Monthly rent in Austin is an average of $1,409 over our sample period.
The largest percentage drop in Austin rents is 14% over our sample period.
In order to estimate the effect of Airbnb supply on the long-term rental market, we fit
the following regression model:
∆Rentt = α + βt ∆U nitst + Xt0 θ + t (2)
where ∆Rentt is the monthly percentage change in long-term rent for Austin, Texas in month
t. ∆U nitst is the monthly percentage change in Airbnb units in month t. Xt is a matrix of
controls that include year fixed effects, θ is a vector of the corresponding coefficients, and t
is the error term. We cluster standard errors by year to control for yearly unobservables.
Figure 7 displays the fitted regression lines between the change in rent (%) and the
change in local Airbnb supply with a 95% confidence interval. The top three panels display
the yearly breakdown of the regression, and the bottom panel display analysis employing
data for the entire sample period. All of the four linear fits show that as the number of
21
https: //www.zillow.com/research/zillow-rent-index-methodology-2393/, Last checked 10/30/2021.
24Airbnb units decreases, the rental prices also decline.
Our analysis results for Equation 2 can be found in Table 12. Table 12 shows four differ-
ent specifications for testing the effect of Airbnb listings on long-term rents. The first two
specifications do not control for year fixed effects. We do find a statistically significant coef-
ficient of 0.033 on the monthly change in Airbnb units. However, these coefficient estimates
do not control for any yearly unobservables. Therefore, we focus our analysis on specifica-
tions in columns (3) and (4) that add on year fixed effects. We find that no matter how we
cluster standard errors the power of our variable of interest stays statistically significant. We
find the coefficient on our variable of interest is 0.07% and inline with Barron et al. (2021).
Barron et al. (2021) find that an increase in Airbnb listings leads to an increase in rents
of 0.018%, which translates to a $9 increase in monthly rent22 . Our results suggest that
for every 1% change in monthly Airbnb units we see a 0.7% increase in monthly long-term
rents. Given that the average monthly rent in Austin is $1,409, an increase of 0.7% translates
to a $9.8 increase in long-term rents. The positive relationship also indicates that as the
Airbnb supply decreased during our sample period, rents in the long-term rental market also
decreased.
These results represent a first pass at analyzing the interaction between the short-term
rental market and the long-term rental market during a market decline. Given that the
pandemic is still ongoing at the time of this paper, we cannot say where the new rental
equilibrium will be. This provides a great avenue for further research as more data become
available.
7 Conclusion
As of the writing of this paper, there have already been over 45 million cases of COVID-19 in
the U.S. with new cases emerging everyday23 . People continue to travel and the U.S. is more
22
We conduct four specifications that control for different clustering methodologies and year fixed effects.
Our results remain qualitatively similar regardless of the specification.
23
https://covid.cdc.gov/covid-data-tracker/##cases casesper100klast7days, Last checked 10/30/2021
25You can also read