Climate Change in Colorado - A Synthesis to Support Water Resources Management and Adaptation - Western Water Assessment
←
→
Page content transcription
If your browser does not render page correctly, please read the page content below
Climate Change in Colorado
       A Synthesis to Support Water Resources
            Management and Adaptation
A R EP O RT FOR THE COLORADO WATER CONSERVATION B OAR D
Climate Change in Colorado
A Synthesis to Support Water Resources
Management and Adaptation

A REPORT B Y TH E WES T ER N WAT ER AS S ES S M ENT
FOR TH E C O L OR AD O WAT ER C O NSERVAT IO N B OAR D

Lead Authors
Andrea J. Ray
NOAA Earth Systems Research Laboratory

Joseph J. Barsugli
University of Colorado at Boulder, Cooperative Institute for Research in Environmental Sciences

Kristen B. Averyt
University of Colorado at Boulder, CU-NOAA Western Water Assessment

Authors
Klaus Wolter
University of Colorado at Boulder, Cooperative Institute for Research in Environmental Sciences

Martin Hoerling
NOAA Earth Systems Research Laboratory

Nolan Doesken
Colorado State Climatologist, Colorado State University

Bradley Udall
University of Colorado at Boulder, CU-NOAA Western Water Assessment

Robert S. Webb
NOAA Earth Systems Research Laboratory

Funding from the Colorado Water Conservation Board of the State of Colorado to the
Cooperative Institute for Research in Environmental Sciences, Western Water Assessment
Copyright ©2008 CU-NOAA Western Water Assessment

Produced in cooperation with CU-Boulder University Communications, Marketing & Creative Services.

Photos
Cover (left image) and page 40, images courtesy of Casey A. Cass, CU-Boulder University Communications,
Marketing & Creative Services. Page 15, ©2008 Denver Metro Convention & Visitor’s Bureau.

The University of Colorado does not discriminate on the basis of race, color, national origin,
sex, age, disability, creed, religion, sexual orientation, or veteran status in admission and
access to, and treatment and employment in, its educational programs and activities.
Contents

   Executive Summary                                                                                                 1
       Sidebar ES-1. Communicating Uncertainty

1 Introduction                                                                                                       3
       Sidebar 1-1. How to Interpret the Timescales in This Report
       Figure 1-1. Climate and Extreme Events

2 The Observed Record of Colorado Climate                                                                           5
  2-1. Observing Systems in Colorado                                                                                6
  2-2. The Climate of Colorado                                                                                      7
       Figure 2-1. Annual Average Temperature and Precipitation in Colorado (1950–1999)
   2-3. Local and Regional Climates of Colorado                                                                     7
       Figure 2-2. Temperature at Nine Observing Stations
       Figure 2-3. Water Year Precipitation at Nine Observing Stations
       Figure 2-4. Colorado Regional Temperature Trends
       Table 2-1. Seasonal Temperature Trends (1957–2006)
   2-4. Statewide Average Temperature, 1930s to present                                                             11
       Figure 2-5. Colorado Annual Mean Temperatures (1930–2007)
   2-5. Elevation                                                                                                   12
       Figure 2-6. Temperature Trends and Elevation (1979–2006)
   2-6. Trends in Hydroclimatic Variables: Temperature, Precipitation, Snow, and Streamflow                         12
       Figure 2-7. Trend in March Average Minimum Temperature on Days with Precipitation (1948–2004)
       Figure 2-8. Trend in Winter Snow vs. Rain (1949–2004)
       Sidebar 2-1. Paleoclimate
       Figure 2-9. Reconstruction of Streamflow for the Colorado River at Lees Ferry
   2-7. Extremes                                                                                                    15
       Sidebar 2-2. IPCC Technical Paper on Water

3 A Primer on Climate Models, Emissions Scenarios, and Downscaling                                                  16
   3-1. Anatomy of a Climate Model                                                                                  17
       Figure 3-1. Hydrologic Component of General Circulation Models
       Sidebar 3-1. Time and Space in Models
       Figure 3-2. Model Grid for the Atmospheric Component
   3-2. Emissions Scenarios—in the Driver’s Seat                                                                    18
       Figure 3-3. Global Mean Surface Temperature and Model Projections
       Sidebar 3-2. Boulder Study
       Table 3-1. Effect of Climate Change on Reliability of Boulder’s Water Supply
   3-3. Climate Model Evaluation                                                                                    19
       Figure 3-4. Elevation on Global and Regional Climate Model Grids
       Table 3-2. Seasonally Averaged Climate Biases of the IPCC AR4 WGI Climate Models in
         Temperature and Precipitation for Colorado

                                                                                       Climate Change in Colorado        iii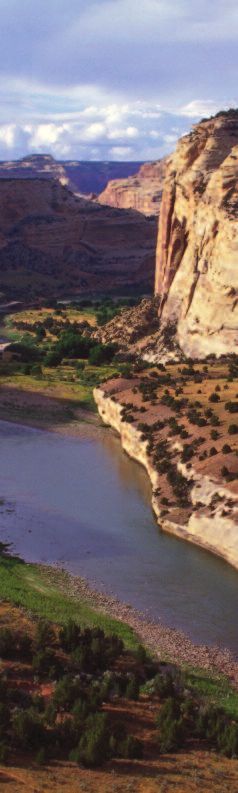
3-4. Downscaling Methods                                                                                       21
          Table 3-3. Strengths and Weaknesses of Statistical versus Dynamical Downscaling
          Figure 3-5. Progression of Data and Models from Climate Models to Streamflow
          Sidebar 3-3. Joint Front Range Climate Change Vulnerability Group
     3-5. The Future of Global Models                                                                               23

4 Climate Attribution                                                                                               24
  4-1. The Global Consensus                                                                                         25
  4-2. A Telescoping View                                                                                           25
          Figure 4-1. Observed Annual Average North American Surface Temperature (1950–2007)
          Figure 4-2. Modeled Annual Average North American Surface Temperature (1950–2007)
     4-3. Drought in Colorado and the West                                                                          27
          Figure 4-3. Intensity and Extent of Drought in Colorado (1895–2007)
          Figure 4-4. Precipitation and River Flow in the Upper Colorado Basin (1895–2007)

5 Climate Projections                                                                                               29
  5-1. Temperature and Precipitation Projections                                                                    30
          Figure 5-1. Temperature and Precipitation Changes over North America Projected for 2050
     5-2. A Closer Look                                                                                             30
          Figure 5-2. January Average Daily Temperature in Colorado for 1950–1999 (observed) and 2050 (projected)
          Figure 5-3. July Average Daily Temperature in Colorado for 1950–1999 (observed) and 2050 (projected)
          Figure 5-4. Location of Precipitation and Temperature Projections in Figures 5-5, 5-6, and 5-7
          Figure 5-5. Projected Monthly Temperature and Precipitation near Grand Junction, CO (2050)
          Figure 5-6. Projected Monthly Temperature and Precipitation near Steamboat Springs, CO (2050)
          Figure 5-7. Projected Monthly Temperature and Precipitation near La Junta, CO (2050)
     5-3. Hydrologic Changes                                                                                        35
          Figure 5-8. Projected Changes in Annual Runoff (2041–2060)
          Table 5-1. Projected Changes in Colorado River Basin Runoff or Streamflow in the Mid-21st Century
          Figure 5-9. Range in Temperature and Precipitation Projections for the Upper Colorado River Basin
          Figure 5-10. Projected Change in Colorado River Basin Snowpack
          Figure 5-11. Projected Soil Moisture Changes in the Upper Colorado River Basin for 2050
     5-4. Extremes                                                                                                  38
          Sidebar 5-1. Aspen Snow: Consideration of Climate Change Information in Planning
          Figure 5-12. Projected Change in Snow Covered Area, Aspen

6 Implications of Changing Climate for Colorado’s Water Resources                                                   40
          Table 6-1. Challenges Faced by Water Managers
          Figure 6-1. Approaches to Climate Change Assessment

     References                                                                                                     44

     Resources                                                                                                      47

     Glossary                                                                                                       48

     Acronym List                                                                                                   52

iv        Climate Change in Colorado
EXECUTIVE SUMMARY
   The scientific evidence is clear: the Earth’s climate is warming. Multiple independent measurements confirm
   widespread warming in the western United States; in Colorado, temperatures have increased by approximately 2°F
   between 1977 and 2006. Increasing temperatures are affecting the state’s water resources. (Sections 1, 2, 4, 5, 6)

      his rep ort is a synthesis of climate change science              human activities (anthropogenic). However no studies have

T     important for Colorado’s water supply. It focuses on
      observed trends, modeling, and projections of tempera-
ture, precipitation, snowmelt, and runoff. Climate projections
                                                                        specifically investigated whether the detected trends in
                                                                        Colorado can be attributed to anthropogenic greenhouse
                                                                        gases. (Sections 2, 4)
are reported out to the mid-21st century, because this is a rele-    • Climate models project Colorado will warm 2.5°F [+1.5 to
vant time frame for development of adaptation strategies.              +3.5°F] by 2025, relative to the 1950–99 baseline, and 4°F
    Although many published studies and datasets include in-           [+2.5 to +5.5°F] by 2050. The 2050 projections show summers
formation about Colorado, few climate studies focus only on            warming by +5°F [+3 to +7°F], and winters by +3°F [+2 to
                                                                       +5°F]. These projections also suggest that typical summer
the state. Consequently, many important scientific analyses
                                                                       monthly temperatures will be as warm as or warmer than the
for Colorado are lacking. This report summarizes Colorado-
                                                                       hottest 10% of summers that occurred between 1950 and 1999.
specific findings from peer-reviewed regional studies, and             By way of illustration, mid-21st century summer temperatures
presents new graphics derived from existing datasets. The              on the Eastern Plains of Colorado are projected to shift west-
state is home to many experts in climate and hydrology, and            ward and upslope, bringing into the Front Range temperature
this report also draws from ongoing work by these scientists.          regimes that today occur near the Kansas border. (Section 5)
                                                                     • Winter projections show fewer extreme cold months, more
Observations, Attribution, and Projections                             extreme warm months, and more strings of consecutive warm
• Changes in Colorado’s climate and implications for water             winters. Typical projected winter monthly temperatures,
  resources are occurring in a global context. On a global             although significantly warmer than current, are between the
  scale, climate change has been linked to observed and                10th and 90th percentiles of the historical record. Between
  projected changes in the water cycle. By the mid-21st                today and 2050, typical January temperatures of the Eastern
  century, average river runoff and water availability are             Plains of Colorado are expected to shift northward by ~150
  projected to increase at high latitudes and decrease over dry        miles. In all seasons, the climate of the mountains is
  regions at lower midlatitudes such as the western United             projected to migrate upward in elevation, and the climate of
  States. Changes in the quantity and quality of water may             the Desert Southwest to progress up into the valleys of the
  occur due to warming even in the absence of precipitation            Western Slope. (Section 5)
  changes. (Section 1)                                               • In all parts of Colorado, no consistent long-term trends in
• The accumulation of greenhouse gases (including carbon diox-         annual precipitation have been detected. Variability is high,
  ide) in the atmosphere is very likely the cause of most of the       which makes detection of trends difficult. Climate model pro-
  increase in global average temperatures (IPCC AR4 WGI 2007).         jections do not agree whether annual mean precipitation will
  In North America, temperatures have increased by 2°F in the          increase or decrease in Colorado by 2050. The multi-model
  last 30 years, and “human-induced warming has likely caused          average projection shows little change in annual mean precipi-
  much of the average temperature increase over the past fifty         tation, although a seasonal shift in precipitation does emerge.
  years” (CCSP SAP 3.3 2008, p. 3). (Section 5)                        (Sections 2, 5)
• In Colorado, temperatures have increased about 2°F in the          • A widespread and large increase in the proportion of
  past 30 years. All regions examined within the state warmed          precipitation falling as rain rather than snow, and reduction
  during the last 30 years, except the far southeast corner, in        in snow water equivalent (SWE) have been observed
  which there was a slight cooling trend. (Section 2)                  elsewhere in the West. In Colorado, however, these changes
• Climate models show a 1°F warming in the West over the last          are smaller and not as significant. Most of the reduction in
  30 years in response to greenhouse gas emissions from                snowpack in the West has occurred below about 8200 ft.

                                                                                                   Climate Change in Colorado       1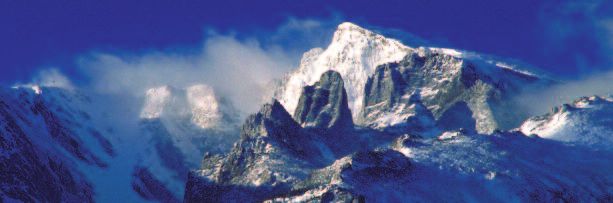
However, most of Colorado’s snowpack is above this                               to the 20th century average, although one statistical stream-
    elevation, where winter temperatures remain well below                           flow model projects a 45% decline by 2050. The range of
    freezing. (Section 2)                                                            individual model projections within a single study can include
• Projections show a precipitous decline in lower-elevation                          both increasing and decreasing runoff due to the range of
  (below 8200 ft) snowpack across the West by the mid-21st                           climate model output used to drive the hydrology models.
  century. Modest declines are projected (10–20%) for                                Ongoing studies are attempting to resolve methodological dif-
  Colorado’s high-elevation snowpack (above 8200 ft) within                          ferences in order to reduce the range of uncertainty in runoff
  the same timeframe. (Section 5)                                                    projections. (Sections 2, 5)
• Between 1978 and 2004, the spring pulse (the onset of                           • Throughout the West, less frequent and less severe drought
  streamflows from melting snow) in Colorado has shifted                            conditions have occurred during the 20th century than
  earlier by two weeks. Several studies suggest that shifts in                      revealed in the paleoclimate records over the last 1000
  timing and intensity of streamflows are related to warming                        years. Precipitation variations are the main driver of drought
  spring temperatures. The timing of runoff is projected to                         in Colorado and low Lake Powell inflows, including the recent
  shift earlier in the spring, and late-summer flows may be                         drought of 2000–07, and these variations are consistent with
  reduced. These changes are projected to occur regardless of                       the natural variability observed in long-term and
  changes in precipitation. (Sections 2, 5)                                         paleoclimate records However, warming temperatures may
                                                                                    have increased the severity of droughts and exacerbated
• Recent hydrology projections suggest declining runoff for
                                                                                    drought impacts. (Sections 4, 5)
  most of Colorado’s river basins in the 21st century. However,
  the impact of climate change on runoff in the Rio Grande,                       • Because global climate models do not represent the
  Platte, and Arkansas Basins has not been studied as                               complexity of Colorado’s topography, researchers are using
  extensively as the Colorado River Basin. (Section 5)                              “downscaling” and other techniques to study processes that
                                                                                    matter to Colorado water resource managers. Several projects
• The lowest five-year period of Colorado River natural flow since
                                                                                    are underway to improve regional understanding: Some use
  records began in the late 1800s occurred in 2000 to 2004 (9.9
                                                                                    statistical “downscaling” methods, which adjust for the
  million acre feet per year). Recent hydrologic studies of the
                                                                                    effects of elevation and the mountains on snowfall and
  Upper Colorado River Basin project multi-model average de-
                                                                                    temperature; other studies involve compiling, calibrating,
  creases in runoff ranging from 6% to 20% by 2050 compared
                                                                                    and studying historical datasets; others involve enhanced
                                                                                    climate modeling efforts to include finer spatial resolution
SIDEBAR ES-1. Communicating Uncertainty
                                                                                    that better represents Colorado’s mountainous terrain.
Recognizing the difficulty in communicating scientific uncertainty to those         (Section 3)
outside the community, climate assessments now make statements designed
to communicate probability. The so-called likelihood terminology indicates        Implication for Water Resource Managers
“the assessed likelihood, using expert judgment, of an outcome or a result”
(IPCC AR4 WGI 2007, p. 3). The likelihood terminology quoted in this docu-        Climate change will affect Colorado’s use and distribution
ment follows two different but similar conventions, shown below.                  of water. Water managers and planners currently face spe-
    It is important to recognize that the likelihood terminology used             cific challenges that may be further exacerbated by pro-
here is independent of consequence; these are not risk statements and             jected climate changes. The implications of climate change
the consequences of potentially cascading effects are not implicit in the
                                                                                  in this report are consistent with the broader conclusions
likelihood statements.
    The authors and editors of this report did not develop likelihood
                                                                                  in the CCSP SAP 4.3, the IPCC Technical Paper on Water
statements independently. Here, all likelihood statements are quoted              (2008), and the 2007 National Academy of Science Report
from three major assessments (IPCC AR4 WGI 2007, IPCC 2008, CCSP                  “Colorado River Basin Water Management.”
SAP 3.3) where long-term processes involving large panels of experts                  This report provides a scientific basis to support further
arrived at conclusions based on the best available science.                       studies of water resources impacts. However, the assess-
Statements quoted from IPCC AR4 WGI             Statements quoted from CCSP SAP   ment and quantification of specific climate change impacts
and the IPCC Technical Paper on Water           3.3 use an intentionally less     on water resources is beyond the scope of this document.
use this convention:                            discrete system:
                                                                                      A synthesis of findings in this report suggests a reduction
virtually certain (>99%)                                                          in total water supply by the mid-21st century. When com-
extremely likely (>95%)
very likely (>90%)                              very likely (about 75–100%)
                                                                                  bined with temperature increases and related changes in
likely (>66%)                                   likely (about 60–75%)             evaporation and soil moisture, all recent hydrologic projec-
more likely than not* (>50%)                                                      tions show a decline in runoff for most of Colorado’s river
about as likely as not* (>33-66%)                                                 basins by the mid-21st century. (Section 6)
unlikely (
1
   Introduction
     n response to the risks associated with global

I    warming, Governor Ritter issued the Colorado
     Climate Action Plan (CCAP) in 2007. The CCAP sets
out a goal to prepare the state to adapt to those climate
                                                                   S ID E BA R 1-1. How to Interpret the Timescales in This Report

                                                                   Many of the graphics and analyses in this report focus on recent
                                                                   trends and mid-21st century projections, but projections for other
                                                                   timeframes are important depending on the type of decision or
changes “that cannot be avoided” (CCAP 2007, p. 3). Rec-           planning horizon.
ommendations in the CCAP include assessing the vulnera-            2008 (the present): Climate variations such as the recent drought
bility of Colorado’s water resources to climate change,            may influence the results of trend analysis of the historical record.
analyzing impacts on interstate water compacts, and plan-          Many of the climate projections in this report show changes with
ning for extreme events such as drought and flooding.              respect to 1950–99 averages. During this period global and North
    This report is a synthesis of the state of the science         American temperatures have already risen about 2ºF, some of which
                                                                   can be attributed to anthropogenic causes.
regarding the physical aspects of climate change that are
important for evaluating impacts on Colorado’s water               2025: The projected warming in 2025 is roughly half that in 2050
                                                                   (see FIGURES 5-2 through 5-7). In this timeframe, all greenhouse gas
resources. It presents scientific analyses to support future in-   emissions scenarios lead to a similar range of temperature projections.
vestigations and state efforts to develop a water adaptation       Natural variability will play an important role in determining the
plan. Accordingly, the document focuses on observed trends,        climate of the next few decades. However, even relatively small shifts
modeling, and projections of hydroclimatic variables—in-           in the average climate can substantially change the risk of extreme
cluding temperature, precipitation, snowmelt, and runoff—          events (FIGURE 1-1) such as heat and cold waves and drought.
that are important factors for water supply in the state.          2050: The climate projections for the differing greenhouse gas
However, the geographic scope of the document does not             emissions scenarios start to diverge by 2050, but all projections still
                                                                   show a quantitatively similar range. Anthropogenic effects on climate
end at the state’s borders, because of Colorado’s role as a        variables are projected to be larger in 2050 than 2025 or the present.
headwaters for supply in the West. Projections focus on the        Therefore, the larger climate change signal will be more easily
mid-21st century, because this is a relevant planning horizon      detected against the background of natural variability, and will further
for adaptation strategies, but some projections are for earlier    shift the risk of extreme events.
and later periods (Sidebar 1-1). This document is also in-         Beyond 2050: The future of Colorado’s climate beyond 2050 depends
tended to support other planning in the state including the        on the greenhouse gas emissions path that the world follows. As the
State Water Supply Initiative, the Colorado River Water            world warms, feedbacks in the climate system may further increase
                                                                   global greenhouse gas concentrations. Warming in Colorado may
Availability Study, the Joint Front Range Climate Change           trigger changes in land cover that would alter regional climate. The
Vulnerability Study, and the Governor’s Conference on              possibility has been raised of large, potentially irreversible changes in
Managing Drought and Climate Risks.                                the climate system particularly if global average temperatures increase
    Changes in Colorado’s climate and implications for             more than a few degrees (e.g., Hanson et al. 2007).
water resources are occurring in a global context. The
                                                                   FIGURE 1-1. Climate and Extreme Events
IPCC Technical Paper on Water finds that on a global
scale, observed warming has been linked to many changes
in the water cycle. Climate models project that precipita-
tion will increase at high latitudes and decrease in parts of
the subtropics and lower midlatitudes. By the mid-21st
century, average river runoff and water availability are
projected to elevate at high latitudes and decrease over dry
regions at lower midlatitudes such as the western United
States. Increased precipitation intensity and variability are
projected to elevate risks of floods and droughts. Water
supplies in glaciers and snow cover are projected to
decline in many areas of the world.                                Fig. 1-1. Relatively small shifts in the average climate can substantially
                                                                   change the risk of extreme events such as heat and cold waves and
    Changes in the quantity and quality of water may oc-
                                                                   drought. (IPCC AR4 WGI 2007)
cur even in the absence of precipitation change. Current
practices may not be robust enough to cope with climate
change. The impacts of climate change challenge the

                                                                                                       Climate Change in Colorado               3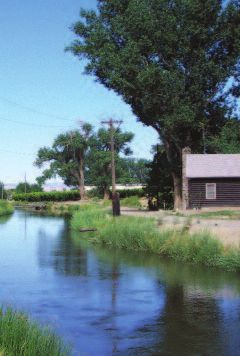
assumption that past hydrology provides a good guide to           in assessment of climate risks and vulnerabilities and in
the future. Furthermore, many gaps have been identified           integrated resource planning and adaptation.
in observations, modeling, and applications research                 Vulnerability assessments of water resources might in-
(IPCC 2008).                                                      clude the risks of compact calls in Colorado’s river basins,
                                                                  risks to supply within the state, or the risks of drought. In-
Context                                                           tegrated planning processes following on these assess-
Knowledge about climate and climate change is evolving;
                                                                  ments might include mitigation planning to assess and
thus this report is a snapshot of the state of science at a key
                                                                  prepare for drought, and developing mechanisms for each
point in Colorado’s history. The information reported here
                                                                  river basin to deal with potential compact calls.
provides a basis for planning to adapt to higher tempera-
                                                                  Structure of the Report
tures and the consequences that will result, especially the
impacts related to Colorado’s water and forests. Like the         Key findings of this report are summarized at the begin-
Colorado Climate Action Plan, this is a living document,          ning of each section and in the Executive Summary that
and should be updated as the science progresses.                  precedes the main document. You are of course encouraged
    Although many published studies and datasets include          to read the entire document, but less technical readers may
information about Colorado, there are few climate studies         find sufficient information in this Introduction, the Execu-
that focus on the state. Consequently, many important scien-      tive Summary, the key findings at the beginning of each
tific analyses for Colorado have not been done. This              section, and the figures.
report summarizes Colorado-specific findings from peer-               The report begins with a description of the climate of
reviewed regional studies, and presents new analyses derived      Colorado, the observing systems and data available for
from existing datasets and model projections. The state is        study, and the observed trends in Colorado and the western
home to many experts in climate and hydrology, and this           United States for variables relevant to water resources
report draws from ongoing work by these and many other            (Section 2). Section 3 is an overview of climate models and
scientists who are stepping up to the challenge of providing      theory intended to provide the background for later sec-
societally relevant studies to aid decision-makers.               tions. Section 4 provides attribution of the principal causes
    This document takes advantage of recent research and          of observed climate conditions including the recent multi-
syntheses of climate including the Intergovernmental Panel        year drought. Section 5 then describes the global modeling
on Climate Change (IPCC) Fourth Assessment Report                 projections for Colorado and the surrounding areas of the
(AR4), the IPCC Technical Paper on Water (2008), and the          Intermountain West, and situates Colorado in the context
U.S. Climate Change Science Program (CCSP) Synthesis              of global climate change. It also describes how the complex
and Assessment Products (SAP) from 2007 and 2008. The             topography of the state relates to interpreting and using
statements within this report that include an expert assess-      climate change projections. Recent hydrologic projections
ment of the likelihood of occurrence (Sidebar ES-1) have          for the Colorado River and other state resources are shown.
been extracted from these documents.                              Section 6 discusses the general implications of these find-
    Water managers have a long history of adapting to             ings for Colorado’s water resources, although the assess-
changing circumstances, including changes in economies            ment of specific impacts on water resources is beyond the
and land use, environmental concerns, and population              scope of this report.
growth. Climate change will further affect the decisions              A glossary provides descriptions of some key climate
made about how Colorado uses and distributes its water.           terms, as well as an appendix of ongoing research efforts
The report provides a scientific basis to support further         that may contribute in the near term to our understanding
studies of                                                        of climate change in Colorado. The details of data source
water resources impacts and adaptation efforts called for in      and methods for each figure are available at
the Governor’s CCAP; the assessment of specific sensitivi-        http://wwa.colorado.edu.
ties and vulnerabilities of water supply and ecosystem
impacts is beyond the scope of this report. Section 6 dis-
cusses the potential uses of the information in this report

4        Climate Change in Colorado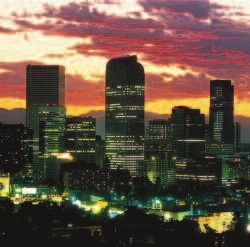
2
   The Observed Record
   of Colorado Climate

KEY POINTS
• Colorado’s highly variable climate is a consequence of high elevations and
  the complex topography of the mountains, plains, and plateaus. Climate
  varies spatially and temporally, and different climatic variables fluctuate in
  distinct ways.

• In Colorado, statewide temperatures have increased about 2°F over 30 years.
  This synthesis is based on two methods estimating 2.1°F from 1977 to 2006
  and 1.7°F from 1977 to 2006.

• In regions of Colorado, widespread warming is evident across most climate
  divisions in the 30-year period.

• In the last 50 years, the North Central Mountains warmed the most (+2.5ºF),
  while temperatures in southwestern Colorado, including the San Juan
  Mountains, changed very little (+0.2°F). Minimum temperatures have
  warmed more than maximum temperatures during this period.

• In all parts of Colorado, no consistent long-term trends in annual
  precipitation have been detected in the time periods analyzed. Variability is
  high, which makes detection of trends difficult.

• A widespread and large increase in the proportion of precipitation falling as
  rain rather than snow and a reduction in snow water equivalent (SWE) have
  been observed elsewhere in the West between 1949 and 2004. In Colorado,
  however, these changes are smaller and not as statistically significant
  (Knowles et al. 2006). Most of the reduction in snowpack in the West has
  occurred below about 2500 m (about 8200 ft, Regonda et al. 2005).
  However, most of Colorado’s snowpack is above this elevation, where winter
  temperatures remain well below freezing.

• Peak streamflows in the western United States are occurring earlier in the
  spring due to warming temperatures during spring months (Stewart et al.
  2005, Hamlet et al. 2005). In Colorado, between 1978 and 2004, the spring
  pulse has shifted earlier by about two weeks (Clow 2007).

• Throughout the West, less frequent and less severe drought conditions have
  occurred during the 20th century than in the paleoclimate records covering
  the last 1000 years (Meko et al. 2007).
bservations are the basis for understanding                  daily high and low temperatures, precipitation (rain and

O      past and recent climate variability, for modeling
       future climate, and for evaluating future climate
scenarios. This discussion of observations is intended to
                                                                    the melted water from snow and ice), snowfall, and total
                                                                    snow depth. Average daily temperature is computed as the
                                                                    mean of the minimum and maximum temperatures. Some
provide a background in how observations are made, the              of these weather stations report additional information
variation inherent in Colorado’s climate record, and the            such as wind, humidity, and cloud cover.
challenges in analyzing this record. This information pro-              It is important to note that many of these observing
vides a context for climate attribution and projections. This       systems were not constructed and maintained with the goal
section also presents a brief overview of the climate of            of detecting long-term climate trends. In this context,
Colorado. For a discussion on the difference between                changes in instrumentation, station locations, time of meas-
climate and weather, see climate in the glossary.                   urement and other factors have affected interpretation of
    This report describes a number of observational studies.        long-term datasets. Changes in the location of observing
Comparing these studies is inherently complicated because           stations may affect long-term records. Of the ~250 current
different researchers analyze different periods of record,          stations scattered across the state, only two are located in
which are determined in part by the data available, and by          nearly the same place as they were when first established in
the problem they want to study. Extensive effort would be           the 1880s. Station moves can result in slight differences in the
needed to re-analyze and homogenize the results, so we              local climate observed, and may appear as a spurious “cli-
have merely stated the periods that the authors chose.              mate change” trend. The widespread transition from glass to
    The results of these observational studies must be taken in     electronic thermometers in the 1980s resulted in a cold shift,
the context of the years defining the period and the climatic       or bias, of about 0.5°F compared to periods prior to the in-
events that may or may not be included in different records.        strumental change. An even larger cold bias can occur if the
Colorado’s climate has been punctuated by several notable cli-      daily observing time is changed from the afternoon to the
matic events, including the Dust Bowl years (1930s), a relatively   morning (Pielke et al. 2002), as has become more common in
cool period from the 1950s to the 1970s, and the recent severe      recent decades. Land use changes that affect local tempera-
drought in which eight out of ten years (1999–2008) had below       ture are also common in Colorado, including year-round ur-
normal April 1 snow water equivalent (SWE). These variations        ban heat island effects and altered irrigation patterns, which
may influence the results of ongoing analyses. This report          impact temperatures during the growing season (Pielke et al.
presents 30-, 50-, 75-, and 100-year trend analyses.                2002). To further complicate the matter, changes in these
                                                                    parameters are not always documented (Pielke et al. 2007).
2-1. Observing Systems in Colorado                                      Long-term hydrologic records also face observational
The earliest instrumental weather observations in Colo-             challenges. For example, snow data are subject to local
rado came from some of the early forts built on the western         weather modification efforts and vegetation growth near
frontier. In 1870, the organization that later became the Na-       the site (Julander and Bricco 2006). Changes in instrumen-
tional Oceanic and Atmospheric Administration (NOAA)                tation and the impact on stream gauges from changes in
National Weather Service (NWS) established more weather             stream channel geometry and upstream diversions also
stations in Colorado including Denver, Pueblo, and Pikes            complicate the picture.
Peak. In the 1880s the Colorado State Legislature author-               Given the complications introduced by observing stations,
ized the creation of the Colorado Weather Service, with a           climatologists spend a lot of time considering how to work
goal of better defining the weather and climate resources of        with the best scientific data by routinely quality controlling
Colorado. This network of dozens of urban and rural                 datasets. Scientists have developed procedures for adjusting
weather stations later became the State of Colorado Na-             and accounting for observational bias (including instrumen-
tional Weather Service Cooperative Observer (COOP) Net-             tation changes and station location) by culling aberrant
work. NOAA’s National Climatic Data Center (NCDC) is                records and applying calibration measures. It is important to
also concerned with tracking future climate and has re-             note that the methodological processes meant to improve ob-
cently deployed a special climate observing network called          servational datasets are subject to scrutiny in the peer review
the Climate Reference Network, including six stations in            process and have been vetted by the scientific community.
Colorado (http://www.ncdc.noaa.gov/oa/climate/uscrn/).                  An extensive discussion of the records at some Colorado
   There are currently ~250 weather stations in Colorado            climate stations is provided in Pielke et al. (2002), who cau-
reporting to the NWS. These stations measure and report             tion that, given local variability and station issues, trends at
                                                                    individual stations may not be representative of regional
6        Climate Change in Colorado
trends. Section 2-4 presents data from some individual Different climate drivers influence temperature variabil-
stations, then analysis of regions of the state. ity in different parts of the state. Western Colorado and in-
terior mountain valley temperatures are greatly affected by
2-2. The Climate of Colorado the presence or absence of snow cover. In a year with deep
Colorado’s climate is unlike that of any other state—it is and early snows, winter temperatures can dip to 6–10ºF
characterized by the high elevations and complex topogra- below average (N. Doesken, pers. comm.). The opposite
phy of the Rocky Mountains, the Colorado plateau and val- (i.e., above average temperatures) may occur during win-
leys of the West Slope, and the high plains falling off from ters with limited snow cover. For the high mountains, the
the Continental Divide towards the east (Figure 2-1). influence of persistent upper-level ridges and troughs
Climate varies in Colorado spatially across many regions, (regions of high and low atmospheric pressure, respec-
temporally across years and decades, and its temperature tively) dominate temperature anomalies. East of the moun-
and precipitation histories differ across the state. tains the battle among subtropical, Pacific, and polar
continental air masses determines which years are warmer
FIGURE 2-1. Annual Average Temperature and Precipitation or colder than average (Pielke et al. 2003).
in Colorado (1950–99)
The annual cycle dominates temperature variability
T EM P ERAT U RE
(see Figures 5-2 and 5-3). Statewide, January is typically
the coldest month of the year and July or August is the
warmest. Temperatures vary widely from day to day and
week to week, especially during the cooler months from
mid-autumn to late spring. Winter temperatures are more
variable than summer temperatures, and daytime tempera-
tures are more variable than nighttime readings. The least
variability occurs with summer minimum temperatures.
It is against the background of variability in temperature
and precipitation (discussed in Section 2-6)that long-term
climate records are analyzed to detect trends. Time series
analysis, including trend analysis, uses statistical methods to
analyze records spanning a period of time in order to assess
whether or not there is a detectable trend. To determine
whether there is an anomaly in one period of interest com-
pared to another, scientists may compare a year or period of
years to a base period or reference period climatologies. This
reference period depends on the process or issue being stud-
P RECIPITAT ION
ied, and the variability in the datasets. The IPCC used vari-
ous periods, including 20- and 30-year averages; these data
were global averages and included a considerable number of
data points, therefore reducing variability (IPCC AR4 WGI
2007). For a smaller region or one with greater variability, a
longer period may be needed in order to detect trends in a
statistically robust way. Analyses generated for this report use
50-year (1950–99) climatologies where possible.
2-3. Local and Regional Climates of Colorado
Sections 2-3 and 2-4 describe Colorado’s climate from the
standpoint of individual stations, experimental Colorado
climate divisions, and the official National Climatic Data
Center (NCDC) divisions. All these analyses are based on
data from the NWS COOP Observing Network.
An effort has been underway for several years to care-
fully scrutinize all of Colorado’s long-term weather stations
Fig. 2-1. Annual climatology (1950–99) of daily average temperature (°F)
and identify which are best for historic time series analysis
and precipitation (inches). See FIGURES 5-2 and 5-3 for January and July and trend detection. In collaboration with the Western
temperature climatologies. (Data: PRISM) Water Assessment (WWA), the Colorado Climate Center
Climate Change in Colorado 7has categorized each station in Colorado according to suit- Colorado (Figures 2-2 and 2-3). These stations have 90-
ability for trend analysis and detection. The Colorado Cli- year or longer records in both temperature and precipita-
mate Center has developed a website specifically to view tion, and comparatively fewer identified problems with
temperature and precipitation variations and trends for the station relocation, instrument changes, and missing obser-
best long-term datasets at stations in Colorado, including vations, according to analysis by the Colorado Climate
the data shown in Figures 2-2, 2-3, and 2-4 (http://ccc Center and the WWA. In contrast, stations in Denver, Colo-
.atmos.colostate.edu). rado Springs, and throughout the central mountains relo-
To illustrate local variability in Colorado, nine stations cated too frequently, or had other problems limiting their
were selected from 38 “better quality” stations through use in long-term analysis. The temperature records show
FIGURE 2-2. Temperature at Nine Observing Stations
R.
e
Steamboat Springs Fort Collins
tt
la
South P
o R.
Akron
ad
Color
Grand Junction
Cheyenne Wells
Montrose Arkan
sa
s R.
Fort Collins
52
Lamar
Rocky Ford
50
Rio G
48
ra
nde
Trinidad 46
44
Steamboat Springs
42 Akron
40 52
38 50
36 48
34 46
Grand
a JJunction
c n Cheyenne
e n Wells
56
56
54
54
52
DEGREES FAHRENHEIT
52
50
50
48
Montrose
n
Rocky
c Ford
d
52
56
50
54
48
52
46
50
Trinidad
n d Lamar
m
58
56
56
54
54
52
52
50
50
1900 1910 1920 1930 1940 1950 1960 1970 1980 1990 2000 2010 1900 1910 1920 1930 1940 1950 1960 1970 1980 1990 2000 2010
Fig. 2-2. Daily average temperature (°F), annually averaged, at nine observing stations in Colorado. Station locations are shown on the map of Colorado (top
left). The 100-, 50-, and 30-year linear trends shown in blue, red, and yellow, respectively, are statistically significant (>97.5%); linear trends that are not
significant are not shown. If less than 100 years of data were available, the full period of record was used to calculate the trend shown in blue. Of the 27
trends generated, 19 are increasing, one is decreasing (100-year trend at Lamar), and seven were not statistically significant.
8 Climate Change in Coloradothe linear regression for the 30-, 50-, and 100-year trends in long-term average. Statistically significant trends are
the mean (Figure 2-2), and the precipitation records detected in the temperature record when the trend emerges
(Figure 2-3) show the 10-year moving average. from the variability. Of 27 trend lines computed (100-, 50-,
Variability is apparent at all locations, and is compara- and 30-year time periods, at nine stations), 19 are increas-
tively smaller in the temperature record than the precipita- ing, one is decreasing (100-year trend at Lamar), and seven
tion record. When added up over an entire year, the mean were not statistically significant. In all parts of Colorado,
temperature at each location falls within a few ºF of its no consistent long-term trends in annual precipitation
FIGURE 2-3. Water Year Precipitation at Nine Observing Stations
R.
e
Steamboat Springs Fort Collins
tt
la
South P
o R.
Akron
ad
Color
Fort Collins
25
Grand Junction
20
Cheyenne Wells
Montrose Arkan 15
sa
s R.
10
Lamar
Rocky Ford
Rio G
Akron
ra
nde
Trinidad
25
Steamboat Springs 20
35
15
30
25 10
20
15 Cheyenne Wells
25
Grand Junction
15 20
P R E C I P I TAT I O N ( I N C H E S )
15
10
10
5 Rocky Ford
Montrose 20
15
15
10 10
5
5
Trinidad Lamar
25 25
20
20
15
15
10
10
1900 1910 1920 1930 1940 1950 1960 1970 1980 1990 2000 2010 1900 1910 1920 1930 1940 1950 1960 1970 1980 1990 2000 2010
Fig. 2-3. Water year precipitation (inches) at nine observing stations around Colorado. Station locations are shown on the map of Colorado (top left). Overall
long-term trends are not detectable at the stations. The 10-year moving average of available data (solid blue line) is shown to emphasize decadal variations.
Shorter-term changes, such as the droughts of the 1930s, 1950s, and the early 2000s, are apparent at some stations.
Climate Change in Colorado 9have been detected in the time periods analyzed. Seasonal (Wolter and Allured 2007). These new divisions are based
trends have not been analyzed at these locations, but may on groups of observing stations that vary in a similar man-
be of interest to water managers. ner from year to year, and are thought to reflect similar re-
Climatic trends at individual stations may not be repre- gional climate processes. Sufficient data are available to
sentative of regional climate because of local processes at construct time series of temperature for most of these new
those stations (Figures 2-2 and 2-3). For this reason, cli- climate divisions back to the early 1930s. The averages cal-
matologists assess long-term regional variability by group- culated from the better quality observing records within
ing observing stations together. Regional trends may each division help to detect regional temperature trends
emerge (e.g., be statistically detectable) when the records by eliminating local processes that are not indicative of
from these stations are averaged together. regional climate at each observing station.
The NOAA National Climatic Data Center (NCDC) five Temperature trends were computed for these new
official climate divisions group Colorado climate data into climate divisions for selected time periods (75-, 50-, and 30-
regions by river basins, but these divisions are not necessar- year periods) or the whole record (Figure 2-4). Regionally,
ily representative of the complex regional climates in the the north-central part of the state has been warming the
state. A new set of climate divisions has been developed fastest (a +2.5°F change in the annual average over the past
FIGURE 2-4. Colorado Regional Temperature Trends
North Central Mountains North Front Range
Division 0.8 0.0
2.6 1.5 Northeast
1932–2006
75-year trend (°F) 0.3
1.6 2.5
1957–2006 0.5
50-year trend (°F)
1.8
1977–2006
30-year trend (°F)
Grand Junction & Gunnison Arkansas Valley
-0.1 0.7
1.6 2.0
1.2 1.8
Southwest Lower Arkansas Valley
-0.3 -1.3
0.2 Southern Front Range 0.5
San Luis Valley
2.0 na -0.1
na
0.7
1.9
1.1
2.4
Fig. 2-4. Regional trends in annual average temperature (°F) for experimental climate divisions in Colorado. Groups of stations with similar climates
comprise the divisions indicated by colored circles; there are no delineated geographic boundaries. Gray shading indicates terrain at an elevation higher
than 9850 feet (3000 m). The tables show temperature changes for the 30-, 50-, and 75-year periods ending in 2006, as determined from linear trend
analysis. Statistically significant trends (>95%; see the online Methods Supplement) are shown in red (warming) and blue (cooling). Trends were computed
by averaging observations from a subset of locations within each division (between three and seven stations, depending on the division) that met quality
control requirements. Although some divisions extend beyond the state’s borders, only stations within Colorado were used to determine trends. Insufficient
data were available to calculate 75-year trends for the San Luis Valley and the Southern Front Range divisions. Significant warming is evident in most
divisions in the past 30 and 50 years.
10 Climate Change in Colorado50 years), while the southwestern corner has warmed the 2-4. Statewide Average Temperature,
slowest over the same time period (+0.2°F). The most 1930s to present
striking trends are for the most recent 30-year period Colorado’s climate since 1930 shows a warm period in the
(1977–2006), about a +2°F change during this period for 1930s and the 1950s, a cool period though the 1960s and
most of the state, except the Lower Arkansas Valley (pink 1970s, and a consistent upward trend in the 10-year average
circles, Figure 2-4) climate division in the southeast cor- since about 1970 (Figure 2-5). The temperature has in-
ner of the state. This division also shows a regional cooling creased by +2.0°F from 1957 to 2006 (50 years), and by
trend for the 75-year period. This period begins during the +2.1°F from 1977 to 2006 (30 years). These trends are based
1930s Dust Bowl years in Colorado, which were some of the on the NCDC traditional climate division data.
warmest years on record for many stations. This division This estimate can be compared with an alternate calcu-
extends well beyond the state’s borders; only two stations, lation using spatial averages of the experimental climate di-
Holly and Lamar were used to compute the regional aver- visions (see Figure 2-4) that are based on unadjusted
age. Pielke et al. (2002, 2007) discuss problems with the COOP station data. This calculation results in statewide
observational record at these stations, including changes in linear trends of +1.6°F from 1957 to 2006 and +1.7°F from
observation time that may have introduced a cold bias. 1977 to 2006. Although the analysis methods and choice of
Using a larger selection of COOP stations in this division in dataset lead to the differing estimates of statewide trends,
Colorado and in neighboring states yields the following these methods converge on a statewide temperature
linear trends: 1932–2006 (-1.4°F), 1957–2006 (+0.1°F), increase of about 2°F. The above trends were calculated by
1977–2006 (+0.7°F). fitting a straight line through the data. Temperatures
Minimum temperatures show greater overall warming changes between the beginning and the end of these
than maximum temperatures in the last 50 years. Analysis of periods show similar results.
seasonal trends for minimum and maximum temperatures
for Northern Colorado Mountains and the Arkansas Valley FIGURE 2-5. Colorado Annual Mean Temperatures (°F) for 1930–2007
(green circles, Figure 2-4) show upward trends in minimum 4
temperatures in all seasons, with the largest trends in spring
(Table 2-1). This finding is consistent with Knowles et al. 3
(2006) who also found large and widespread warming trends
2
in the intermountain west in March over a similar period.
DEGREES FAHRENHEIT
Across the state, winters also warmed during this 50-year
1
period, but this trend is less pronounced than for spring.
0
T ABLE 2-1: Seasonal Temperature Trends (1957–2006)
in the Northern Colorado Mountains and the Arkansas Valley
1
winter spring summer autumn annual
Arkansas
2
Valley Tmax +2.1 +3.8 +0.4 +1.0 +1.8
Tmin +3.2 +3.0 +1.4 +1.4 +2.2
3
North Central
Mountains Tmax +1.3 +4.6 +1.8 - 0.1 +1.9
4
Tmin +2.7 +4.7 +3.0 +2.7 +3.2 1930 1940 1950 1960 1970 1980 1990 2000 2010
The observed trend in average maximum (Tmin) and minimum temperatures Fig. 2-5. Colorado annual mean temperatures (°F) from 1930 to 2007.
(Tmax) from 1957 to 2006 for the Arkansas Valley and the North Central Annual departures are shown as gray bars relative to a 1950–1999 reference
Mountains experimental climate divisions. Locations of the divisions are period. The 10-year moving average of available data (black curve)
shown in FIGURE 2-4. The 50-year trends for individual seasons and the highlights low frequency variations in the record. Warm periods occurred in
annual mean are shown. Statistically significant (red) warming trends are Colorado in the 1930s and the 1950s, followed by a cool period through the
evident in all seasons for Tmin. Springtime trends for Tmin and Tmax are 1960s and 1970s. Since about 1970, there has been a consistent upward
particularly large. trend in the 10-year average. (Data source: NCDC Climate Divisions, see
http://www7.ncdc.noaa.gov/CDO/CDODivisionalSelect.jsp)
Climate Change in Colorado 11FIGURE 2-6. Temperature Trend and Elevation (1979–2006)
(m)
(ft) 4000
12000
10000 3000
8000
2000
6000
4000
1000
2000
0 0
(oC) 0 1 2 3 4 (oC) 0 1 2 3 4
(oF) 2 4 6 8 (oF) 2 4 6 8
Tmin Trend Tmax Trend
Fig. 2-6. Dependence of temperature trends on elevation. Annual mean daily minimum (left panel) and maximum (right panel) temperature trend (1979–2006)
plotted in successive 250-meter elevation bands. The red dot is the median trend over the period of analysis at all locations within its elevation band; the
crosses are the approximate 5th and 95th percentile values, and represent the range of trends throughout the state in the elevation band. The dotted line is
zero trend or no change. (Diaz and Eischeid 2007)
2-5. Elevation 2-6. Trends in Hydroclimatic Variables:
Another regional view of temperature is its relationship Temperature, Precipitation, Snow,
with elevation. Temperature typically decreases as elevation and Streamflow
increases, and temperature is a significant factor in defining Colorado’s temperature trends are consistent with multiple
the ecosystems and habitats at different elevations. Diaz independent analyses showing widespread warming in the
and Eischeid (2007) analyzed the temperature record using West (CCSP SAP 4.3 2008; Udall and Bates 2007; Mote et al.
the Parameter-elevation Regressions on Independent 2005; Stewart et al. 2005; Diaz and Eischeid 2007). However,
Slopes Model dataset (PRISM; http://www.prism.oregon a few sites in the southern San Juan Mountains show cool-
state.edu/). They find larger warming trends at high ing (Mote et al. 2005). Regonda et al. (2005) observed that
elevations (Figure 2-6). Few reliable long-term surface air the onset of spring warm spells (defined as seven days
temperature records are available above 9850 feet (3000 m). greater than 53°F/12°C) shifted to an earlier date over the
PRISM temperatures at these elevations are estimated from period 1950–99. Knowles et al. (2006) found positive
in situ observations at lower elevation and from free- temperature trends at the vast majority of stations across
atmosphere (above the land surface) temperatures. The the West. The greatest warming was generally observed at
magnitude of estimated temperature trends from Diaz and the higher elevations in the Interior West, with the most
Eischeid (2007) may not be consistent with in situ observa- warming observed in March (Figure 2-7; for other
tional data from alpine locations, such as Niwot Ridge in months see Knowles et al. 2006).
Boulder County (>11,000 ft) and Loch Vale in Rocky
Mountain National Park (>10,000 ft) (J. Baron pers.
comm., M. Williams pers. comm.).
12 Climate Change in ColoradoFIGURE 2-7. Trend in March Average Minimum Temperature spring pulse onset. Both studies (Clow 2007; Stewart et al.
on Days with Precipitation (1949–2004)
2005) attribute changes in snowmelt timing to springtime
warming. Hamlet et al. (2005) uses modeled runoff based
on observed meteorological data and drew the same con-
clusion. Regonda et al. (2005) observed that between 1950
and 1999, the onset of runoff in Colorado trended toward
later dates, but these data do not include the recent
Colorado drought years.
Looking beyond mean streamflows, Pagano and Garen
(2005) found increases in April–September streamflow
variability in Colorado (the USGS gauge on the White
5°F River near Meeker, 1943–2002) which they attribute to in-
creasing variability in spring precipitation. They also find
an increase in year-to-year persistence of high or low flows.
Snow water equivalent (SWE) is a measure of the amount
of water in the snowpack. SWE is measured at SNOTEL and
Fig. 2-7. Trend in March average minimum temperature on days with snow course sites across the West by the Natural Resource
precipitation (1949–2004, the latest data available at the time of analysis). Conservation Service (NRCS). Mote et al. (2005) and Re-
Red indicates an increase in temperature and blue indicates a decrease. The gonda et al. (2005) have both studied trends in April 1 SWE
size of the circle is proportional to the temperature change. For scale, the
in the West. While declining SWE is detected in other parts
arrow indicates a 5°F change. The circles represent statistically significant
findings and the squares are not significant. (from Knowles et. al. 2006, of the West, no spatially coherent trends were found in Colo-
FIGURE 9) rado and some stations in Colorado recorded increases.
Hamlet et al. (2005) concluded that those stations reporting
increased SWE were associated with modest upward precipi-
Water year precipitation ranges from roughly half the
tation trends, and that widespread warming caused many of
long-term average in a dry year to double the average in a
the downward trends in SWE.
wet year and varies across the state (see Figure 2-3). The
Elevation and temperature are factors in the evolution
El Niño Southern Oscillation (ENSO) has correlations with
of snowpack. Regonda et al. (2005) found that stations in
precipitation that vary regionally across Colorado
the western United States below 2500 m (8200 ft) exhibited
(http://www.cdc.noaa.gov/Climaterisks/), but do not domi-
the largest decreases in SWE at March 1, April 1, and May 1.
nate the variability on annual and longer time scales
Much of Colorado’s snowpack is above this elevation where
(Wolter 2008). Eastern Colorado is dominated by warm
winter temperatures remain well below freezing; note that
season precipitation, largely a result of localized convective
storms. The lower elevations of southern and central Colo-
FIG U RE 2-8. Trend in Snow vs. Rain in Winter (1949–2004)
rado receive significant precipitation from late summer
storms, while statewide, the mountains are dominated by
winter and spring precipitation.
A widespread increase in the proportion of precipitation MORE SNOW
falling as rain rather than snow has been found in the
winter months throughout the Western United States from
1949 to 2004; however, the data are highly variable for
Colorado (Knowles et al. 2006; Figure 2-8). L ESS SNOW
At gauges throughout the West, there has been either no
detected trend or a slightly increasing trend in mean annual
streamflow over the period 1948–2002 (Stewart et al. 2005).
In contrast, Walter et al. (2004) find a decrease in Colorado
River Basin flow (1950–2000), although the trend is not sta-
tistically significant. For Colorado, Clow (2007) found that
snowmelt and runoff timing shifted about two weeks
earlier from 1978 to 2004, with the strongest trends in the Fig. 2-8. Changes in the fraction of winter precipitation falling as snow vs.
western and southern regions of Colorado, and weak rain (1949–2004), after correcting for trends in precipitation amount. Blues
indicates increasing fraction of snow; yellow decreasing fraction. Data are
trends in the Northern Front Range. Stewart et al. (2005)
from NWS COOP stations. (from Knowles et. al. 2006, FIGURE 7)
also find a consistent one-to-four-week earlier shift in the
Climate Change in Colorado 13SIDEBAR 2-1. Paleoclimate
Paleoclimate refers to climate during the period prior to the system, and thus have the potential to inform sustainable
beginning of instrumental records—in Colorado, before the late management of water resources. The reconstructions indicate that
1800s. Various environmental indicators or “proxies” can be used more severe and sustained droughts occurred in the centuries prior
to reconstruct paleoclimatic variability extending back hundreds or to 1900 than those seen in the gaged records, including the most
thousands of years. recent drought (FIGURE 2.9).
In particular, the growth of trees in many parts of Colorado and For more information on streamflow reconstructions, including
the West closely reflects annual moisture variability, so tree-ring access to data for Colorado and the upper Colorado River basin, see
records can be used to reconstruct, or extend, gaged records of the WWA TreeFlow pages: http://wwa.colorado.edu/treeflow/.
annual streamflow. These streamflow reconstructions can provide Woodhouse and Lukas (2006) provide streamflow reconstructions at
water managers and stakeholders with a much longer window—500 14 gauges in the Upper Colorado and South Platte River basins.
years and more—into the past hydrologic variability of a river
FIGURE 2-9. Reconstruction of Streamflow for the Colorado River at Lees Ferry
Fig. 2-9. A reconstruction of streamflow for the Colorado River at Lees Ferry (five-year moving average, with 80% confidence interval shown
as gray band) is compared with the observed natural flow record (five-year moving average in black). The severity of the 2000–04 drought
was probably exceeded at least once in the previous 500 years. (from Meko et al. 2007)
about 70% of the Colorado River Basin annual runoff is all but the most recent studies were completed before data
contributed by this higher-elevation snowpack. Therefore was available from parts of the continuing 2000s drought,
the statewide average snowpack in Colorado does not show and all published analyses were completed before data on
the declines that have been observed at lower elevation the record-setting snows of 2007–08 were available. Fur-
mountains elsewhere in the West (Udall and Bates 2007). thermore, analysis of year-to-year variations using SWE
These studies also illustrate how analysis of trends may observations from any single month without seasonal
be influenced by the period studied and by anomalies oc- context (e.g., March 1, April 1, and May 1) may not reflect
curring during and after the period studied. For example, changes in the seasonal evolution of snowpack.
14 Climate Change in ColoradoYou can also read