COMMODITY MARKETS OUTLOOK - APRAPR OCTOCT
←
→
Page content transcription
If your browser does not render page correctly, please read the page content below
A World Bank Report   OCTOBER 2022

                      Commodity
                      Markets
                      Outlook
                      Pandemic, war, recession: Drivers
                      of aluminum and copper prices

                                                    Apr
                                                    Oct

OCTOBER 2022

Commodity
Markets
Outlook

© 2022 International Bank for Reconstruction and Development / World Bank
1818 H Street NW, Washington, DC 20433
Telephone: 202-473-1000; Internet: www.worldbank.org

Some rights reserved.

This work is a product of the staff of The World Bank with external contributions. The findings, interpretations, and
conclusions expressed in this work do not necessarily reflect the views of The World Bank, its Board of Executive
Directors, or the governments they represent. The World Bank does not guarantee the accuracy, completeness, or currency
of the data included in this work and does not assume responsibility for any errors, omissions, or discrepancies in the
information, or liability with respect to the use of or failure to use the information, methods, processes, or conclusions set
forth. The boundaries, colors, denominations, and other information shown on any map in this work do not imply any
judgment on the part of The World Bank concerning the legal status of any territory or the endorsement or acceptance of
such boundaries.

Nothing herein shall constitute or be construed or considered to be a limitation upon or waiver of the privileges and
immunities of The World Bank, all of which are specifically reserved.

Rights and Permissions

This work is available under the Creative Commons Attribution 3.0 IGO license (CC BY 3.0 IGO)
http://creativecommons.org/licenses/by/3.0/igo. Under the Creative Commons Attribution license, you are free to copy,
distribute, transmit, and adapt this work, including for commercial purposes, under the following conditions:

Attribution—Please cite the work as follows: World Bank Group. 2022. Commodity Markets Outlook: Pandemic, war,
recession: Drivers of aluminum and copper prices, October 2022. World Bank, Washington, DC. License: Creative
Commons Attribution CC BY 3.0 IGO.

Translations—If you create a translation of this work, please add the following disclaimer along with the attribution:
This translation was not created by The World Bank and should not be considered an official World Bank translation. The
World Bank shall not be liable for any content or error in this translation.

Adaptations—If you create an adaptation of this work, please add the following disclaimer along with the attribution:
This is an adaptation of an original work by The World Bank. Views and opinions expressed in the adaptation are the sole
responsibility of the author or authors of the adaptation and are not endorsed by The World Bank.

Third-party content—The World Bank does not necessarily own each component of the content contained within the
work. The World Bank therefore does not warrant that the use of any third-party-owned individual component or part
contained in the work will not infringe on the rights of those third parties. The risk of claims resulting from such
infringement rests solely with you. If you wish to re-use a component of the work, it is your responsibility to determine
whether permission is needed for that re-use and to obtain permission from the copyright owner. Examples of components
can include, but are not limited to, tables, figures, or images.

All queries on rights and licenses should be addressed to World Bank Publications, The World Bank Group, 1818 H
Street NW, Washington, DC 20433, USA; e-mail: pubrights@worldbank.org.

The cutoff date for the data used in this report was October 21, 2022.

Table of Contents
   Acknowledgments ....................................................................................................................... v
   Executive Summary ..................................................................................................................... 1
   Special Focus Pandemic, war, recession: Drivers of aluminum and copper prices ................................ 7
   Commodity Market Developments and Outlook .......................................................................... 17
        Energy................................................................................................................................ 19
        Agriculture .......................................................................................................................... 27
        Fertilizers ............................................................................................................................ 35
        Metals and Minerals............................................................................................................. 36
        Precious Metals ................................................................................................................... 39

   Figures         1 Commodity price developments............................................................................... 2
                   SF.1 Recent developments in global aluminum and copper markets .............................. 10
                   SF.2 Dynamics of aluminum and copper prices .......................................................... 12
                   SF.3 Decomposition of aluminum and copper price volatility ...................................... 13
                   SF.4 Drivers of aluminum and copper prices during global recessions ........................... 14
                   SF.5 Drivers of aluminum and copper prices since their pandemic trough ..................... 15
                   2 Oil market developments ...................................................................................... 19
                   3 Oil production ..................................................................................................... 20
                   4 Oil market outlook ............................................................................................... 22
                   5 Natural gas market developments ........................................................................... 24
                   6 Coal market developments .................................................................................... 26
                   7 Agricultural price developments ............................................................................. 28
                   8 Global supply conditions for grains and edible oils ................................................... 29
                   9 Risks to the food commodity outlook ..................................................................... 30
                   10 Domestic food price inflation............................................................................... 31
                   11 Food insecurity................................................................................................... 32
                   12 Beverage commodity market developments............................................................ 33
                   13 Agricultural raw materials market developments..................................................... 34
                   14 Fertilizer market developments............................................................................. 35
                   15 Metals and minerals market—supply structure and price forecasts............................ 37
                   16 Metals and minerals market developments............................................................. 38
                   17 Precious metals market developments ................................................................... 39

Table              1 World Bank Commodities Price Forecast (nominal U.S. dollars) ................................. 5

                                                                                                                                                      iii

Acknowledgments
This World Bank Group Report is a product of the Prospects Group in the Equitable Growth, Finance, and
Institutions (EFI) Vice Presidency. The report was managed by John Baffes under the general guidance of Ayhan
Kose and Franziska Ohnsorge.

Many people contributed to the report. The Special      managed by Joseph Rebello and Nandita Roy,
Focus on “Pandemic, war, recession: Drivers of          supported by Paul Blake, Sandya Deviah, Jose
aluminum and copper prices” was authored by             Carlos Ferreyra, and Torie Smith. Staff of the
Christiane Baumeister, Guillermo Verduzco-Bustos,       Translation and Interpretation Services unit
and Franziska Ohnsorge. Section authors include         provided translations of dissemination materials.
Peter Nagle (energy), John Baffes (agriculture),
Francisco Arroyo Marioli (metals), and Wee Chian        The World Bank’s Commodity Markets Outlook is
Koh (fertilizers and precious metals). Shane Streifel   published twice a year, in April and October. The
provided input and reviewed the report. Kaltrina        report provides detailed market analysis for major
Temaj provided research assistance and managed          commodity groups, including energy, agriculture,
the database. Maria Hazel Macadangdang produced         fertilizers, metals, and precious metals. Price
the forecast table. Design and production were          forecasts for 46 commodities are presented.
handled by Adriana Maximiliano. Graeme Littler          Commodity price data updates are published
produced the accompanying website.                      separately at the beginning of each month.

                                                        The report and data can be accessed at:
Hanane Ahmed, John Paxton Dearborn, Betty
                                                        www.worldbank.org/commodities
Dow, Graeme Littler, Patrick Alexander Kirby,
Franz Ulrich Ruch, and Garima Vasishtha reviewed        For inquiries and correspondence, email at:
the report. External affairs for the report were        commodities@worldbank.org

                                                                                                                v

C O M M O D I T Y M A R K E T S O U T LO O K | O C TO B E R 2 0 2 2                                       E X ECUTIVE SUMMARY   1

                                             Executive Summary
A sharp global growth slowdown and concerns about an impending global recession are weighing on commodity
prices. In many economies, however, prices in domestic-currency terms remain elevated because of currency
depreciations. This could deepen the food and energy crises already underway in a number of countries. As the
global growth slowdown intensifies, commodity prices are expected to ease in the next two years, but they will
remain considerably above their average over the past five years. Energy prices are expected to fall by 11 percent
in 2023 and 12 percent in 2024. Agricultural and metal prices are projected to decline 5 and 15 percent,
respectively, in 2023 before stabilizing in 2024. This outlook, however, is subject to numerous risks both in the
short- and medium-term. Energy markets face an array of supply concerns as worries about the availability of
energy during the upcoming winter intensify in Europe. Higher-than-expected energy prices could pass through
to non-energy prices, especially food, prolonging challenges associated with food insecurity. A sharper slowdown
in global growth presents a key downside risk, especially for crude oil and metal prices. A Special Focus section
suggests that concerns about a possible global recession have already contributed to a decline in copper prices
from their peak in March 2022, and a shift in demand from aluminum has contributed to lower aluminum
prices. Prices will likely remain volatile as the energy transition unfolds and demand moves from fossil fuels to
renewables, which will benefit some metal producers. Metal-exporting countries can make the most of the
resulting opportunities for growth over the medium-term, while limiting the impact of price volatility by
ensuring they have well-designed fiscal and monetary frameworks.

Recent trends                                                         Energy prices have diverged widely and have been
                                                                      extremely volatile since the outbreak of the war in
Most commodity prices have retreated from their                       Ukraine. Brent crude oil prices fell sharply during
peaks in the aftermath of the post-pandemic                           2022Q3 (nearly one-quarter lower in September
demand surge and war in Ukraine as global                             2022 relative to its June 2022 peak) due to
growth slows and worries about a global recession                     concerns about a global recession in 2023 and
intensify. However, individual commodities have                       tightening financing conditions. Prices partially
seen divergent trends amid differences in supply                       rebounded      in     October      following      the
conditions and their response to softening demand                     announcement by OPEC+ members on October
(figure 1.A). Moreover, currency depreciations in                      5th to reduce their production target by 2 million
many countries have resulted in higher                                barrels per day (mb/d) but have been volatile
commodity prices in local currency terms                              since. Natural gas prices in Europe reached all-time
compared to the price in U.S. dollars (figure 1.B).                    highs in August 2022 due to aggressive actions by
                                                                      several countries to rebuild their inventories as
For example, from February 2022 to September                          well as reduced flows of gas from Russia. Prices
2022, the price of Brent crude oil in U.S. dollars                    have since dropped sharply as inventories reached
fell nearly 6 percent. Yet, because of currency                       their target levels and demand has fallen. Coal
depreciations, almost 60 percent of oil-importing                     prices continued to increase in 2022Q3, as many
emerging market and developing economies saw                          countries turned to coal as a substitute for natural
an increase in domestic-currency oil prices during                    gas. During the past four quarters, natural gas
this period. Nearly 90 percent of these economies                     prices in Europe and seaborne coal prices have
also saw a larger increase in wheat prices in local-                  averaged 420 and 180 percent higher, respectively,
currency terms compared to the rise in U.S.                           than their average over the past five years.
dollars. As a result, commodity-driven inflationary
pressures in many countries with depreciating                         Non-energy prices declined 13 percent in 2022Q3
currencies may be more persistent than indicated                      (q/q). Metal prices declined the most, largely
by recent declines in global commodity prices.                        reflecting weaker global growth and concerns
This could prolong the food and energy crises                         about a slowdown in China (figure 1.C). Precious
already affecting many developing economies.                           metal prices fell 9 percent (q/q) as global interest
2 E X ECUTIVE SUMMARY C O M M O D I T Y M A R K E T S O U T LO O K | O C TO B E R 2 0 2 2
FIGURE 1 Commodity price developments rates rose sharply. Agricultural commodity prices fell
Commodity prices have diverged since the start of the war in Ukraine, with
11 percent in 2022Q3 (q/q). Fears about food
energy prices remaining elevated and non-energy prices declining. In shortages earlier in the year gradually eased.
many countries, however, most commodity prices are much higher in local Exports from Ukraine restarted and inventories of
currency terms because of the strength of the U.S. dollar. Metal demand
growth has fallen in most regions as the global economy has decelerated. key crops remain above historical levels, thereby
The production of grains was robust in 2021-22 but is expected to decline providing a buffer for the ongoing 2022-23
in 2022-23. Looking ahead, oil prices are expected to ease in 2023-24, but
there is much uncertainty to the outlook; a key downside risk is the
season. Notwithstanding the decline in
possibility of a global recession. agricultural commodity prices from their March
2022 highs, they remain nearly 9 percent higher
A. Commodity prices B. Changes in oil and wheat prices in than a year ago. Expected supply shortfalls in the
local currencies
current season for some key commodities,
especially maize, coupled with adverse weather and
high energy prices, could keep prices high during
the current season (figure 1.D).
Outlook and risks
After surging by an expected 60 percent in 2022,
energy prices are projected to decline 11 percent in
C. Metal demand growth D. Grains supply 2023 and a further 12 percent in 2024. Key
mmt, annual change
1990-2021 average
drivers of the outlook include slower global
250
200
growth, weaker demand for natural gas as
150 households and industry reduce consumption, and
100
some supply responses, primarily for coal.
50
0 However, prices will remain more than 50 percent
-50 above their five-year average through 2024.
-100
Persistently high energy prices will continue to
2005
2007
2009
2011
2013
2015
2017
2019
2021
2022
have inflationary implications, particularly
through second-round effects such as higher
E. Oil price forecasts F. Changes in oil demand around
recessions transport and electricity costs for businesses.
Inflationary pressures stemming from commodity
prices will be further exacerbated in countries that
have had sizeable currency depreciations against
the U.S. dollar.
Brent crude oil prices are forecast to average $92/
bbl in 2023, down from a projected $100/bbl in
2022, before easing to $80/bbl in 2024 (Figure
1.E). Oil consumption is expected to continue to
Sources: Bloomberg; Consensus Economics; U.S. Department of Agriculture; World Bank; World
Bureau of Metal Statistics. increase by just under 2 percent in 2023 as China
A. Monthly data. Last observation is September 2022.
B. Percent change in prices in local currency terms between February 2022 and September 2022. gradually reopens, and as switching from natural
C. Year-on-year growth of metal demand. Monthly data. Last observation is August 2022. gas to oil continues, especially in electricity
D. Supply is the sum of beginning stocks and production. Years refer to crop seasons (for example,
2022 refers to 2022-23). generation. A sharper-than-expected slowdown in
E. Consensus forecasts taken from the October 2022 survey. Futures prices average of October 3 to
October 21, 2022. global growth and continued COVID restrictions
F. Figure shows episodes of oil demand contractions around recessions. Year t is the peak in oil
demand prior to contractions. Dashed line shows IEA forecast for 2022 and 2023 from its Oil Market
in China are the key downside risks to oil
Report, October 2022 consumption. During previous global recessions
oil demand has declined by about 2 percent in the
first year and 1 percent in the second, although
with wide variation (figure 1.F).C O M M O D I T Y M A R K E T S O U T LO O K | O C TO B E R 2 0 2 2 E X ECUTIVE SUMMARY 3
Oil markets are expected to tighten over the next production is expected to increase as China, India,
few months as additional sanctions restrict exports and seaborne exporters boost output. The near-
from Russia, releases of oil from strategic reserves term outlook for natural gas and coal prices will
in several countries come to an end, and as depend heavily on the severity of the winter in
OPEC+ members cut production (even if Europe. As with crude oil, slower global growth is
somewhat less than the announced 2 mb/d since a key downside risk to the outlook for next year.
many of the OPEC+ members are already
producing below quota). This will more than Concerns about energy shortages, particularly in
offset the effect of rising production in a few Europe, will require careful policy coordination
countries, primarily the United States. among key importers to ensure the burden of high
energy prices, or future energy disruptions, is
The outlook is subject to numerous risks, equitably shared. Recent government policy
especially on the supply side. First, production in announcements to sharply increase the installation
the United States could disappoint as producers of renewable energy and reduce overall energy
prioritize returning cash to shareholders over consumption may feed through into lower energy
increasing output, and higher input costs prices, but this will take time, and a worsening
constrain new investment. Second, the outlook for supply outlook in the winter of 2023 is possible.
Russia’s production depends on the impact of Furthermore, the current high inflation and high-
trade measures. Russia’s exports next year could be interest rate environment will make financing
as much as 2 mb/d lower, as the EU embargo on investment in new energy production (both fossil
Russian oil and oil products (as well as restrictions fuels and renewables) more challenging, even if
on access to EU insurance and shipping services) recent declines in metal prices provide some
comes into effect. The proposed G7 oil price cap reduction in project costs.
could affect the flow of oil from Russia, but it is
an untested mechanism and would need the In the longer term, the prospect of persistently
participation of large emerging market and high energy prices may require a shift in industrial
developing economies to achieve its objectives. models in Northern European countries that have
Third, releases of crude oil from strategic reserves, historically relied on natural gas imports by
including the U.S. are due to end this year; while pipeline. Indeed, high energy prices have already
these could be extended further, it would risk led to the closure of some facilities in energy-
leaving strategic inventories at very low levels. intensive industries, including fertilizer and
chemical plants, as well as shifts in manufacturing
Amid low levels of inventories, limited spare patterns in others. Together, these changes should
production capacity, and ongoing geopolitical lead to reduced carbon emissions from the EU and
events, the oil market is susceptible to price spikes. may help accelerate its energy transition. In other
The materialization of some of these risks could countries, however, the implications for carbon
intensify challenges associated with energy security emissions are less clear. A reduction in carbon
in many countries. intensity globally, not simply a shift in activities
between countries, is needed to achieve climate
Natural gas and coal prices are also expected to change objectives.
ease in 2023 and 2024 but remain at much higher
levels than their pre-pandemic averages. By 2024, Following an estimated decline of nearly 2
Australian coal and U.S. natural gas prices are percent, metal prices are forecast to fall more than
expected to be double their average over the past 15 percent in 2023 before stabilizing in 2024. The
five years, while European natural gas prices could weakness reflects the deterioration of global
be four times higher. The expected easing of prices growth prospects along with China’s softening
next year is due to weaker demand for natural demand (due to its zero COVID policy and the
gas as households and industries curtail their slowdown of its real estate sector). Risks to the
consumption and switch to substitutes, while coal short-term outlook for metals are on the downside4 E X ECUTIVE SUMMARY C O M M O D I T Y M A R K E T S O U T LO O K | O C TO B E R 2 0 2 2
and reflect slower-than-expected global growth countries with conflict or countries that are facing
and a further deterioration of China’s property extreme weather events, especially in Sub-Saharan
sector. One upside risk is higher-than-expected Africa. Materialization of the upside risks to food
energy prices which could lead to increased prices outlined above could result in even larger
production costs for metal refiners. In the longer increases in the number of people suffering from
term, however, metal demand is expected to food insecurity.
increase, stimulated by recent government policies
to accelerate the energy transition and boost Special Focus. Pandemic, war,
renewables, which are metals intensive.
recession: Drivers of aluminum
Agricultural prices are forecast to decline by 5 and copper prices
percent in 2023 before stabilizing in 2024. The
projected decline in 2023 reflects a better-than- Over the past three years, the pandemic, the war
expected global wheat crop, stable supplies in the in Ukraine, and concerns about an impending
rice market, and the resumption of grain exports global recession caused large swings in prices of
from Ukraine (although the maize crop is expected aluminum and copper. Record price rebounds
to contract materially during the 2022-23 season). from pandemic lows in April 2020 were followed
However, there are numerous upside risks to the by renewed steep declines starting in March 2022.
price forecast. First, disruptions in exports from The price rebound after the pandemic was mainly
Ukraine or Russia, both key grain exporters, could driven by the economic recovery but, in contrast
once again interrupt global supplies, as they did in to the increase in prices after the global financial
the early stages of the war in Ukraine. Second, crisis, supply factors also contributed about one-
further increases in energy prices or disruptions in quarter to the rebound. Since March 2022, a steep
energy supplies (especially natural gas and coal, global growth slowdown, an unwinding of supply
which are key inputs to fertilizers) could exert constraints, and concerns about an imminent
upward pressure on grain and edible oil prices. global recession (especially for copper) contributed
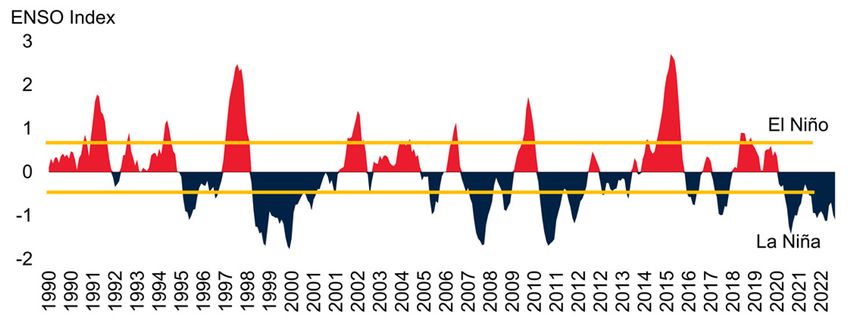
Third, adverse weather patterns can reduce yields; to the plunge in prices.
indeed, 2023 is likely to be the third La Niña year
in a row, potentially reducing yields of key crops Prices will likely remain volatile as the energy
in South America and Southern Africa. On the transition unfolds and as global commodity
downside, weaker-than-expected growth, espe- demand shifts from fossil fuels to renewables,
cially in China, could affect the prices of certain which are metals intensive. For metal-exporting
agricultural commodities such as maize and countries, the energy transition may bring
soybeans, which are used as animal feed. windfalls, but it could also increase their exposure
to price volatility. In this regard, policymakers
As a result of developments in food markets need to design strong fiscal and monetary
following the Russian invasion of Ukraine, the frameworks now—and foster an environment for
number of people subject to severe food insecurity diversification—to make the most of the resulting
is projected to exceed 200 million in 2022. opportunities for growth while limiting the impact
Populations facing food crises are typically in of price volatility.C O M M O D I T Y M A R K E T S O U T LO O K | O C TO B E R 2 0 2 2 E X ECUTIVE SUMMARY 5
TABLE 1 World Bank Commodity Price Forecasts
Differences in levels
Percent change from from April 2022
previous year projections
Commodity Unit 2020 2021 2022f 2023f 2024f 2022f 2023f 2022f 2023f
Price indexes in nominal U.S. dollars (2010=100)
Energy a/ 52.7 95.4 151.7 134.7 118.3 59.1 -11.2 8.1 8.9
Non-Energy Commodities 84.4 112.0 123.7 113.7 113.0 10.5 -8.1 -9.8 -8.0
Agriculture 87.5 108.7 123.2 117.7 117.5 13.4 -4.5 -4.7 -0.3
Beverages 80.4 93.5 108.7 101.5 101.5 16.3 -6.6 5.2 1.8
Food 93.1 121.8 143.6 134.7 134.1 17.9 -6.2 -6.1 0.5
Oils and Meals 89.8 127.1 145.7 134.3 133.7 14.7 -7.8 -19.2 -7.6
Grains 95.3 123.8 149.3 141.0 139.8 20.6 -5.6 0.3 7.4
Other food 95.5 113.1 135.7 129.5 129.4 19.9 -4.5 5.4 4.7
Raw Materials 77.6 84.5 81.2 84.7 85.4 -4.0 4.3 -6.0 -3.1
Timber 86.4 90.4 79.8 86.4 87.6 -11.8 8.3 -6.6 -3.1
Other raw materials 67.9 78.0 82.7 82.7 82.9 5.9 0.1 -5.4 -3.2
Fertilizers 73.2 132.2 219.5 192.2 174.1 66.1 -12.4 -4.2 -6.1
Metals and Minerals b/ 79.1 116.4 113.8 96.5 96.9 -2.3 -15.2 -21.0 -24.1
Base Metals c/ 80.2 117.7 121.2 103.0 103.8 2.9 -15.0 -22.7 -28.9
Precious Metals 133.5 140.2 134.6 129.7 126.7 -4.0 -3.6 -9.8 -1.8
Price in nominal U.S. dollars
Energy
Coal, Australia $/mt 60.8 138.1 320.0 240.0 212.3 131.8 -25.0 70.0 70.0
Crude oil, Brent $/bbl 42.3 70.4 100.0 92.0 80.0 42.0 -8.0 0.0 0.0
Natural gas, Europe $/mmbtu 3.2 16.1 40.0 32.0 28.0 148.2 -20.0 6.0 7.0
Natural gas, U.S. $/mmbtu 2.0 3.9 6.6 6.2 6.0 71.4 -6.1 1.4 1.4
Liquefied natural gas, Japan $/mmbtu 8.3 10.8 18.4 17.0 15.9 71.0 -7.6 -0.6 3.0
Non-Energy Commodities
Agriculture
Beverages
Cocoa $/kg 2.37 2.43 2.35 2.30 2.34 -3.2 -2.1 -0.10 -0.20
Coffee, Arabica $/kg 3.32 4.51 5.90 5.50 5.41 30.8 -6.8 0.40 0.20
Coffee, Robusta $/kg 1.52 1.98 2.35 2.10 2.11 18.6 -10.6 0.10 0.10
Tea, average $/kg 2.70 2.69 3.10 2.80 2.82 15.3 -9.7 0.40 0.20
Food
Oils and Meals
Coconut oil $/mt 1,010 1,636 1,660 1,670 1,672 1.4 0.6 -540 -230
Groundnut oil $/mt 1,672 … 2,200 2,100 2,091 … -4.5 -100 200
Palm oil $/mt 752 1,131 1,275 1,050 1,054 12.8 -17.6 -375 -350
Soybean meal $/mt 394 481 550 540 539 14.4 -1.8 -40 -10
Soybean oil $/mt 838 1,385 1,675 1,550 1,537 20.9 -7.5 -125 150
Soybeans $/mt 407 583 680 650 641 16.6 -4.4 -20 50
Grains
Barley $/mt 98 … 200 175 172 … -12.5 35 25
Maize $/mt 165 260 315 290 287 21.4 -7.9 5 10
Rice, Thailand, 5% $/mt 497 458 435 435 436 -5.1 0.0 10 20
Wheat, U.S., HRW $/mt 232 315 430 410 405 36.4 -4.7 -20 30
Other Food
Bananas, U.S. $/kg 1.22 1.21 1.50 1.40 1.39 24.4 -6.7 0.20 0.10
Beef $/kg 4.67 5.39 5.90 5.80 5.82 9.5 -1.7 -0.30 0.00
Chicken $/kg 1.63 2.26 3.35 3.10 3.07 48.5 -7.5 0.20 0.10
Oranges $/kg 0.60 0.65 0.88 0.85 0.85 34.8 -3.4 0.10 0.10
Shrimp $/kg 12.67 13.70 13.50 14.00 14.30 -1.5 3.7 -1.00 -0.80
Sugar, World $/kg 0.28 0.39 0.40 0.38 0.38 2.7 -5.0 0.00 0.006 E X ECUTIVE SUMMARY C O M M O D I T Y M A R K E T S O U T LO O K | O C TO B E R 2 0 2 2
TABLE 1 World Bank Commodity Price Forecasts (continued)
Differences in levels
Percent change
from April 2022
from previous year
projections
Commodity Unit 2020 2021 2022f 2023f 2024f 2022f 2023f 2022f 2023f
Price in nominal U.S. dollars
Non-Energy Commodities
Raw Materials
Timber
Logs, Africa $/cum 399 414 365 390 395 -11.9 6.8 -25 -30
Logs, S.E. Asia $/cum 279 271 230 250 254 -15.2 8.7 -25 -10
Sawnwood, S.E. Asia $/cum 700 750 670 725 735 -10.7 8.2 -50 -25
Other Raw Materials
Cotton $/kg 1.59 2.23 2.95 2.90 2.86 32.2 -1.7 -0.10 0.00
Rubber, RSS3 $/kg 1.73 2.07 1.80 1.90 1.94 -13.1 5.6 -0.30 -0.30
Tobacco $/mt 4,336 4,155 4,200 4,100 4,116 1.1 -2.4 0 0
Fertilizers
DAP $/mt 312 601 790 750 650 31.5 -5.1 -110 -50
Phosphate rock $/mt 76 123 270 200 175 119.1 -25.9 95 40
Potassium chloride $/mt 218 210 520 500 479 147.4 -3.8 0 30
TSP $/mt 265 538 735 650 550 36.6 -11.6 -15 0
Urea, E. Europe $/mt 229 483 720 650 600 49.0 -9.7 -130 -100
Metals and Minerals
Aluminum $/mt 1,704 2,473 2,700 2,400 2,434 9.2 -11.1 -700 -700
Copper $/mt 6,174 9,317 8,700 7,300 7,361 -6.6 -16.1 -1,400 -2,400
Iron ore $/dmt 108.9 161.7 120.0 100.0 98.0 -25.8 -16.7 -20 -5
Lead $/mt 1,825 2,200 2,100 1,900 1,917 -4.6 -9.5 -200 -200
Nickel $/mt 13,787 18,465 25,000 21,000 20,708 35.4 -16.0 -3,000 -1,000
Tin $/mt 17,125 32,384 31,000 22,000 22,257 -4.3 -29.0 -10,000 -13,000
Zinc $/mt 2,266 3,003 3,500 2,800 2,771 16.6 -20.0 -200 -400
Precious Metals
Gold $/toz 1,770 1,800 1,775 1,700 1,650 -1.4 -4.2 -105 0
Silver $/toz 20.5 25.2 21.3 21.0 21.0 -15.6 -1.2 -2.9 -1.5
Platinum $/toz 883 1,091 940 1,000 1,050 -13.9 6.4 -170 -180
Source: World Bank.
Note:
a/ = Energy price index includes coal (Australia), crude oil (Brent), and natural gas (Europe, Japan, U.S.).
b/ = Base metals plus iron ore.
c/ includes aluminum, copper, lead, nickel, tin, and zinc.
f = forecast.SPECIAL FOCUS
Pandemic, war, recession:
Drivers of aluminum and copper pricesC O M M O D I T Y M A R K E T S O U T LO O K | O C TO B E R 2 0 2 2 S P EC IAL FO CU S 9
Pandemic, war, recession:
Drivers of aluminum and copper prices
Over the past three years, the pandemic, the war in Ukraine, and concerns about global recession buffeted
global aluminum and copper markets and contributed to large swings in global prices. Record price rebounds
from pandemic lows in April 2020 were followed by renewed steep declines starting in March 2022. The price
rebound after the pandemic was mainly driven by the economic recovery but, in contrast to the rebound after
the global financial crisis, supply-side factors also contributed about one-quarter to the rebound. Since March
2022, a steep global growth slowdown, an unwinding of supply constraints, a shutoff of energy-intensive
smelters amid record high energy cost (especially for aluminum), and concerns about an imminent global
recession (especially for copper) contributed to the plunge in prices. More price volatility can be expected as the
energy transition unfolds and global commodity demand shifts from fossil fuels to metals. Appropriate policies
can help metal exporters make the most of the resulting opportunities for growth while limiting the impact of
price volatility.
Introduction Chinese growth led to a collapse and rebound in
global demand for metals. As global economic
Aluminum and copper prices have undergone activity shifted online and demand gravitated
sizable swings in the past three years. The towards consumer durables, demand for copper
COVID-19 pandemic triggered a severe global and aluminum—heavily used in consumer
recession and, in the three months from January electronics, household appliances, and cars—
2020, global aluminum and copper prices suffered increased disproportionately (figure SF.1E).
record declines. This episode was followed by the Meanwhile, COVID-19 restrictions, strikes and
strongest economic rebound in eight decades and political tensions, trade restrictions, and rapidly
steep rebounds in prices (figures SF.1A, B). By rising energy prices disrupted mining, refining, or
March 2022, inflation-adjusted copper and shipments of metals in Australia, Chile, China,
aluminum prices had reached their highest and Guinea, and Peru (figure SF.1F).
second-highest levels, respectively, in a decade.
As global metal price swings buffet economies,
Since then, aluminum and copper prices have
metal exporters will need to understand the
fallen again by 36 and 24 percent, respectively.
sources, features, and impacts of these swings to
These swings were the outcome of a confluence of design appropriate policy responses. Different
different shocks caused by the pandemic. Global types of shocks may cause price swings of different
economic activity contracted by more than 3 magnitudes and duration. More permanent shocks
percent in 2020, but then rebounded by almost 6 may warrant economic adjustments while the
percent in 2021 (figure SF.1C). In China, which impact of temporary shocks may be smoothed
accounts for about 60 percent of global aluminum with countercyclical policies.
and copper demand, growth slowed sharply from
This Special Focus explores how different types of
6 percent in 2019 to 2 percent in 2020 before
shocks affect global prices for copper and
rebounding to 8 percent in 2021 (figure SF.1D).
aluminum. Specifically, it addresses the following
Since metals are heavily used in cyclical sectors,
questions:
such as construction, the swings in global and
• How large and persistent is the impact of
different types of shocks on copper and
This Special Focus was prepared by Christiane Baumeister, aluminum prices?
Guillermo Verduzco-Bustos, and Franziska Ohnsorge. Research
assistance was provided by Kaltrina Temaj. Helpful comments were
provided by Alain Kabundi, Francisco Arroyo Marioli, Jeetendra
• Which shocks play the largest role in copper
Khadan, Ayhan Kose, and Peter Nagle. and aluminum price variations?10 S P EC IAL FO CU S C O M M O D I T Y M A R K E T S O U T LO O K | O C TO B E R 2 0 2 2
FIGURE SF.1 Recent developments in global aluminum • How did the evolution of aluminum and
and copper markets copper prices during the pandemic-induced
In early 2020, aluminum and copper prices underwent one of their steepest global recession in 2020 compare with that
three-month declines in a decade, followed by one of their strongest during the global financial crisis-induced
increases in more than three decades. This in part reflected the steep
global recession and subsequent economic rebound as well as a shift in
global recession in 2009?
demand towards goods and away from services from mid-2020.
This Special Focus builds on a rapidly growing
literature that, thus far, has focused on oil
A. Aluminum price B. Copper price
markets. Baumeister and Hamilton (2019)
identified four shocks as the main drivers of
oil prices—aggregate demand shocks (“econom-
ic activity shock”), commodity-specific de-
mand shocks (“consumption demand shock”),
commodity-specific supply shocks, and speculative
demand shocks (“inventory demand shocks”).
Their methodology is now widely used for oil
prices but has not yet been applied to metal prices.
A variant that identifies only a subset of these
C. Economic growth D. Share of China in aluminum and
copper demand, 2021
shocks has been applied to metal prices by
Stuermer (2018) and Kabundi et al. (2022).
Stuermer (2018) identifies only long run
(“commodity demand”) shocks and short run
(“commodity supply”) shocks without any further
decomposition of short run shocks. Kabundi et al.
(2022) neglect speculative demand shocks, which
turn out to be an important driver of short run
volatility in the analysis presented here.
This Special Focus offers the following main
E. Global goods exports F. Aluminum and copper production
findings. First, inventory and consumption
demand shocks cause much volatility in metal
prices in the very short term, accounting for about
one-third of global metal price volatility on
impact. However, these shocks are small, reverse
quickly, and have modest price impacts.
Second, a negative economic activity shock that
reduces copper or aluminum prices by 1 percent
on impact would continue to put downward
Source: UNComtrade; World Bank Pink Sheet Global Economic Prospects (June 2022); World
Bureau of Metal Statistics. pressure on prices such that three quarters later
A.B. Grey shades show global recessions.
C. GDP-weighted average at 2010-19 average prices and exchange rates. “e” stands for estimated
prices would be more than 5 percent below the
value. baseline before the effect begins to dissipate.
E. Export values. Electronics and vehicles include Harmonized System categories 85 (electrical
machinery and equipment and parts thereof; sound recorders and reproducers; television image and
sound recorders and reproducers, and parts and accessories of such articles), 87 (vehicles; other
than railway or tramway rolling stock, and parts and accessories thereof), and 90 (Optical,
Over a one-year horizon, economic activity
photographic, cinematographic, measuring, checking, medical or surgical instruments and apparatus;
parts and accessories).
shocks—which capture the global business cycle—
F. Refined aluminum and copper production. Monthly data until August 2022. are the single most important driver of copper and
aluminum prices, accounting for 74 and 91
percent of the variance in these prices, respectively.
Third, during global recessions and their
recoveries, economic activity shocks have been theC O M M O D I T Y M A R K E T S O U T LO O K | O C TO B E R 2 0 2 2 S P EC IAL FO CU S 11
main drivers of price changes. However, in the The Special Focus relies on monthly data from
recovery from the pandemic-induced global January 1995 to July 2022. This is a period when
recession of 2020, supply shocks also contributed, China’s role in global metal markets surged such
on average, one-quarter to the rebound in that, by 2019, China alone accounted for about
aluminum and copper prices. This contrasts with one-half of global metal demand. Aluminum and
the price swings during the financial crisis-induced copper prices are from the World Bank’s Pink
global recession of 2009 when supply shocks Sheet. Aluminum and copper production is from
played a negligible role in price swings. the World Bureau of Metal Statistics. Aluminum
and copper inventories are registered mineral
Methodology and data inventories as reported by the London Metal
Exchange and the World Bureau of Metal
Shocks are estimated in a Bayesian vector Statistics. Global economic activity is proxied by
autoregression of aluminum or copper prices, the GDP-weighted average of the OECD’s index
production, and inventories as well as global of industrial production in OECD countries and
economic activity. Sign restrictions and estimates industrial production in six major non-OECD
of elasticities from the literature are used to economies (Brazil, China, India, Indonesia, the
identify four types of shocks. Russian Federation, and South Africa).
• Economic activity shocks—such as global
recessions—imply a reduction in global
Drivers of aluminum
economic activity, metal prices, and and copper prices
production but an increase in metal
Aluminum and, especially, copper prices are
inventories.
highly sensitive to the global business cycle (World
• Consumption demand shocks—such as a shift in Bank 2018). Consequently, economic activity
demand caused by substitution from one shocks that reduced aluminum and copper prices
commodity to another, or an unanticipated on impact by 1 percent had a considerably larger
drop in construction activity in China, the and longer-lasting impact on prices than any of
world’s largest consumer of aluminum and the other three types of shocks. Three quarters
copper—imply a reduction in metal prices after such a shock, aluminum and copper prices
and production but an increase in metal were still more than 5 percent below the baseline
inventories and global economic activity. (figure SF.2A,B).1 The impact of the economic
activity shock on copper prices was somewhat
• Commodity supply shocks—such as the opening larger initially than on aluminum prices but
of new mines—imply an increase in metal dissipates sooner. For copper prices, the effect
production, inventories and economic dissipated and became statistically insignificant
activity, but a reduction in metal prices. after about a year. For aluminum prices, the effects
lessened over time but continued to be statistically
• Inventory demand (speculative) shocks—such as significant even 18 months later. The more
metal sales in anticipation of slowing pronounced swings in copper prices may reflect
construction activity in China—imply a the fact that copper is used considerably more
reduction in metal prices, production, and intensively than aluminum in highly cyclical
inventories but an increase in global economic infrastructure construction activity, especially in
activity. China, which now accounts for more than half of
global copper and aluminum consumption
The methodology corrects for the unusual nature
of the pandemic as in Ng (2021) and allows for
the possibility of measurement error in inventories
1 A 1 percent decline in aluminum and copper prices on impact
data as in Baumeister and Hamilton (2019). due to an economic activity shock is associated with a decline in
Details of the methodology are presented in global industrial production by 1.0 and 1.3 percent, respectively, on
Baumeister et al. (forthcoming). impact.12 S P EC IAL FO CU S C O M M O D I T Y M A R K E T S O U T LO O K | O C TO B E R 2 0 2 2
FIGURE SF.2 Dynamics of aluminum and copper prices (Kabundi et al. 2022; Kabundi, Vasishtha, and
Economic activity shocks that reduced aluminum and copper prices on
Zahid 2022).
impact by 1 percent had a considerably larger and longer lasting effect on
prices than the other types of shocks: consumption demand, supply, and In contrast, consumption demand shocks,
inventory demand. Consistent with these impulse responses, longer-term
fluctuations in aluminum and copper prices were predominantly driven by
inventory demand shocks, or commodity supply
economic activity shocks whereas the other shocks mostly caused short- shocks that also reduced copper or aluminum
term volatility in prices. prices by 1 percent on impact had much smaller
impacts (figure SF.2C-F).2 At their peak impacts,
A. Impulse response of aluminum B. Impulse response of copper price they reduced aluminum and copper prices by 1.2
price to economic activity shock to economic activity shock
percent (for inventory demand shocks), 1.2 and
Percentage points
Percentage points
15 15
1.6 percent (consumption demand shocks), and
10 10
by 1.6 and 2.5 percent (supply shocks),
5 5
respectively. The effects of these shocks were
0 0
persistent: estimated impulse responses are
-5 -5
statistically significant even 18 months after the
-10 -10
initial shocks. The impacts of consumption
0 2 4 6 8 10
Months
12 14 16 0 2 4 6 8 10
Months
12 14 16
demand and inventory demand shocks peaked two
to four months earlier than the impacts of
economic activity shocks. The impact of global
C. Impulse response of aluminum D. Impulse response of copper price aluminum supply shocks remained statistically
price to supply shock to supply shock
significant for two years after the shock but more
than halved in magnitude, whereas those for
copper supply shocks remained broadly steady.
The decline in the impact of supply shocks on
aluminum prices may in part reflect the larger
share of China—and its proactive policies to
stabilize markets—for aluminum than copper
(Kabundi et al. 2022).
Consistent with these impulse responses, longer-
E. Impulse response of aluminum F. Impulse response of copper price
price to consumption demand shock to consumption demand shock and term fluctuations in aluminum and copper prices
and inventory demand shock inventory demand shock were predominantly driven by economic activity
shocks whereas inventory, consumption demand
and supply shocks mostly caused short-term
volatility in prices. A forecast error variance
decomposition suggests that supply shocks
accounted for about one-quarter of aluminum and
copper price fluctuations on impact, and
inventory and consumption demand together for
another one-third (figure SF.3A, B). In contrast,
over a one-year horizon, economic activity shocks,
Source: World Bank.
Note: Solid lines represent median responses, dotted lines represent upper and lower bounds of 68
which capture the global business cycle, were the
percent confidence intervals. single most important driver of copper and
A.B. Impulse response of aluminum (A) and copper (B) prices to economic activity shock that lowers
the price on impact by 1 percent. A 1 percent decline in aluminum and copper prices on impact due
to an economic activity shock is associated with a decrease in global industrial production by 1.0 and
1.3 percent, respectively, on impact.
C.-F. Impulse response of aluminum (C, E) and copper (D, F) prices to supply shock (C, D) and
2 A 1 percent decline in aluminum and copper prices on impact
consumption demand and inventory demand shocks (E, F) that lower the price on impact by 1
percent. A 1 percent decline in aluminum and copper prices on impact due to a supply shock is due to a supply shock is associated with a 1.1 increase in aluminum
associated with a 1.1 percent increase in aluminum or copper production. A 1 percent decline in
aluminum and copper prices on impact due to an inventory demand shock is associated with a 0.7
or copper production on impact. A 1 percent decline in aluminum
percent decline in aluminum inventories and 0.6 percent decline in copper inventories. and copper prices on impact due to an inventory demand shock is
associated with a 0.7 percent decline in aluminum inventories and
0.6 percent decline in copper inventories.C O M M O D I T Y M A R K E T S O U T LO O K | O C TO B E R 2 0 2 2 S P EC IAL FO CU S 13
aluminum prices, accounting for 74 and 91 FIGURE SF.3 Decomposition of aluminum and copper
percent of the variance in these prices, respectively. price volatility
Consistent with these impulse responses, longer term fluctuations in
Drivers of aluminum and copper aluminum and copper prices were predominantly driven by economic
activity shocks whereas inventory demand, consumption demand, and
prices during global recessions supply shocks mostly caused short-term volatility in prices.
Over the past three years, a series of shocks have A. Forecast error variance B. Forecast error variance
decomposition of aluminum prices decomposition of copper prices
buffeted global metal markets. A steep pandemic-
induced global recession was followed by a sharp
rebound in global economic activity, which then
slowed sharply again amid policy tightening;
COVID-19 restrictions closed mines and
intermittently disrupted activity in China, the
world’s largest metals consumer; global demand
initially shifted from services to goods followed by
a reversal; and pandemic policies, the war in
Ukraine, and the recent policy tightening to rein Source: World Bank.
Note: Forecast error variance decomposition of aluminum (A) and copper (B) prices on impact and at
in inflation caused much speculation about the 12-month horizon, based on a structural vector autoregression as in Baumeister and Hamilton
(2019).
commodity market prospects.
In the three months between January and April
2020, aluminum and copper prices declined by 18 pandemic. During this period, demand in China,
percent and 16 percent, respectively, their steepest which accounts for about 60 percent of aluminum
drops over a corresponding period in more than a and copper demand, continued to expand,
decade. Subsequently, between April 2020 and although at a much reduced pace, whereas it
March 2022, aluminum and copper prices more contracted steeply elsewhere amid pandemic
than doubled—their steepest increases over a lockdowns (IWCC 2022; Statista 2022). In the
corresponding period in more than three decades subsequent twelve months between May 2020 and
for aluminum and more than one decade for May 2021, the rebound in economic activity lifted
copper. Since then, within five months, one- aluminum and copper prices by 39 and 42
quarter of the aluminum price gains and almost percent, respectively. Supply disruptions, such as
one-half of the copper price gains has been mine closures, added another 11 and 17
unwound again as mounting concerns about a percentage points to the increase in aluminum and
global recession put downward pressure on copper prices, respectively.
commodity prices more broadly.
The role of supply shocks during the pandemic
A historical decomposition of price movements differed from their role during the global financial
into the four shocks identified by the crisis. Both the pandemic and the global financial
methodology used here suggests that these crisis were accompanied by steep global recessions,
aluminum and copper price fluctuations were in 2020 and 2009, respectively, that drove down
largely the result of economic activity shocks prices. In contrast to the global recession of 2009,
(figure SF.4A,B). Between January and April when supply shocks played a negligible role,
2020, economic activity shocks depressed supply shocks contributed about one-quarter to
aluminum and copper prices by 27 and 23 the price rebounds following the pandemic.
percent, respectively; this was only partially offset Aluminum and copper supply disruptions are part
(9.7 and 4.4 percentage points, respectively) by of a broader phenomenon of severe supply
consumption demand shocks that raised prices. bottlenecks, shipping disruptions, and global value
These consumption shocks may reflect above- chain dislocations over the past two years. This
average economic growth in China during the largely demand-driven rebound in aluminum and14 S P EC IAL FO CU S C O M M O D I T Y M A R K E T S O U T LO O K | O C TO B E R 2 0 2 2
FIGURE SF.4 Drivers of aluminum and copper prices sumption demand shocks cause considerable
during global recessions volatility in metal prices in the very short term,
Aluminum and copper price fluctuations during and after the pandemic- accounting for about one-third of global metal
induced global recession of 2020 were largely the result of economic price volatility on impact. However, these shocks
activity shocks. Supply disruptions contributed about one-quarter to price
rebounds after the pandemic-induced recession, unlike the global financial
are small, reverse quickly, and have modest price
crisis-induced global recession of 2009 when supply shocks played a impacts.
negligible role.
The estimated impulse responses of aluminum
A. Contributions to aluminum price B. Contributions to copper price and copper prices to economic activity suggest
changes changes
considerable downside risks to global aluminum
and copper prices. There is a material risk of a
global recession as a result of highly synchronous
policy tightening around the world to rein in
record high inflation (Guénette, Kose, and
Sugawara 2022). Since industrial production tends
to be more volatile than output, this could be
accompanied by an even steeper slowdown in
industrial production which would also be
Source: World Bank. reflected in lower aluminum and copper prices.
Note: Contributions to cumulative aluminum (A) and copper (B) price changes during the specified
period. “During 2009” stands for the period September 2008-March 2009; “After 2009” stands for the
period April 2009-April 2010; “During COVID-19” stands for the period January-April 2020; “After The results point to metal price swings as an
COVID-19” stands for the period May 2020-May 2021.
important transmission channel for the global
business cycle to countries that rely heavily on
copper or aluminum sectors for exports, fiscal
copper prices continued through March 2022, revenues, and economic activity. More swings in
when prices soared to near-record (aluminum) and aluminum and copper prices can be expected as
record (copper) highs (figure SF.5A). the energy transition away from fossil fuels
towards renewable fuels and battery-powered
Since then, however, prices for both commodities transport gathers momentum. Renewable
have plunged. This has reflected an exceptionally electricity generation is considerably more metal
steep global growth slowdown as well as the intensive than traditional energy generation. Solar
unwinding of supply disruptions. In addition, or wind-powered electricity generation, for
aluminum smelting, which is extremely energy example, uses two to three times the amount of
intensive, has fallen sharply amid soaring energy copper per kWh than gas-powered electricity
prices. As a result, negative consumption demand generation; the production of a battery-powered
shocks contributed even more to the aluminum car uses more than three times the amount of
price decline than economic activity shocks (figure copper per car than an internal combustion engine
5B). Similarly, the real estate sector slowdown in car (IEA 2022). The war in Ukraine is likely to
China that began to intensify in April constituted accelerate the energy transition as countries seek to
a negative consumption shock for copper prices. reduce reliance on fossil fuels such as oil, coal, and
In addition, for copper, which is often considered natural gas, where Russia accounts for 11-25
a bellwether for global economic developments, percent of global exports (Guénette, Kenworthy,
growing concerns about the possibility of a global and Wheeler 2022).
recession in 2023—an example of an inventory
shock—have weighed on prices. For now, metal exporters are on average less
commodity reliant than energy exporters. For
Policy implications example, in the average copper-exporting
emerging market and developing economy
The results of the analysis conducted in this (EMDE), revenues from resource sectors ac-
Special Focus suggest that inventory and con- counted for 10 percent of government revenues inC O M M O D I T Y M A R K E T S O U T LO O K | O C TO B E R 2 0 2 2 S P EC IAL FO CU S 15
2019. This was about one-third of the share of FIGURE SF.5 Drivers of aluminum and copper prices
resources sectors in government revenues in the since their pandemic trough
average oil- or gas-exporting EMDE. However, Following the pandemic trough in April 2020, strong demand pressures
the growing exposure of metal exporters to volatile and continued supply disruptions pushed up aluminum and copper prices
global commodity prices points to two policy to record highs in March 2022. Since then, an exceptionally steep global
growth slowdown and an unwinding of supply disruptions helped to
priorities (Kabundi et al. 2022). reverse some of the price increases. For aluminum, consumption demand
shocks also depressed price, in part because highly energy-intensive
First, well-designed fiscal and monetary policy aluminum smelters were shut off around the world as energy prices
soared. For copper, often considered a bellwether of global economic
frameworks can dampen the economic impact activity, concerns about an incipient global recession have depressed
of metal price swings. This includes fiscal rules prices, as captured by inventory shocks.
to save revenue windfalls, sovereign wealth
funds, and countercyclical monetary and macro- A. Contributions to price changes, B. Contributions to price changes,
May 2020–March 2022 April–July 2022
prudential policy frameworks (see World Bank
2022 for details). Almost two dozen EMDE
commodity exporters have established fiscal rules
or sovereign wealth funds, including Chile, the
world’s largest copper producer. These tend to be
particularly successful at stabilizing business cycles
when they operate in the context of strong
institutions and resilient fiscal, monetary,
exchange rate, and financial frameworks.
Source: World Bank.
Note: Contributions to cumulative aluminum and copper price changes during May 2020-March 2022
Second, in addition to measures to dampen the when prices reached record or near-record highs (A), and during April-July 2022 when prices
plunged (B).
impact of global metal price swings, proactive
efforts at diversification may reduce metal export-
ers’ exposure to global shocks. This could Baumeister, C., G. Verduzco-Bustos, and F. Ohnsorge.
be achieved through export diversification or a Forthcoming. “Drivers of Aluminum and Copper
more comprehensive “national asset portfolio Prices.” Mimeo.
diversification” approach (Gill et al. 2014). The
latter would aim to strengthen non-resource Gill, I. S., I. Izvorski, W. van Eeghen, and D. De Rosa.
sectors through investment in strong institutions 2014. Diversified Development: Making the Most of
and governance, broad access to high-quality Natural Resources in Eurasia. Washington, DC: World
infrastructure, and robust measures to increase Bank.
human capital. Policies would also need to address Guénette, J. D., P. Kenworthy, and C. M. Wheeler.
broader concerns, such as the environmental 2022. “Implications of the War in Ukraine for the
pollution that can accompany metals mining. Global Economy.” EFI Policy Note 3, World Bank,
Washington, DC.
References Guénette, J. D., M. A. Kose, and N. Sugawara. 2022.
“Is a Global Recession Imminent?” EFI Policy Note 4,
Baumeister, C. and J. D. Hamilton. 2015. “Sign World Bank, Washington, DC.
Restrictions, Structural Vector Autoregressions, and
Useful Prior Information.” Econometrica 83 (5): 1963- IEA (International Energy Agency). 2022. The Role of
99. Critical World Energy Outlook Special Report Minerals in
Clean Energy Transitions. Vienna: International Energy
Baumeister, C., and J. D. Hamilton. 2019. “Structural Agency.
Interpretation of Vector Autoregressions with In-
complete Identification: Revisiting the Role of Oil IWCC (International Wrought Copper Council).
Supply and Demand Shocks.” American Economic 2022. End-Use Statistics 2022. London: International
Review 109(5): 1873-1910. Wrought Copper Council.You can also read