Community Respiratory Illness Surveillance Program (CRISP)
←
→
Page content transcription
If your browser does not render page correctly, please read the page content below
Community Respiratory Illness Surveillance Program (CRISP)
Situation Report: January 06, 2023 (Reporting Period Dec 18 –31, 2022)
Summary
COVID-19 lab-confirmed cases decreased from 326 to 302. Test positivity increased to 6.7%.
Influenza positive lab tests decreased from 122 to 69 with a test positivity of 5.0%.
RSV activity is increasing – from 167 to 176 positive lab tests with the highest respiratory virus test
positivity of 14.6%, mainly in preschool age children.
The majority of respiratory virus hospitalizations continue to be COVID-19, followed by RSV.
Weekly visits to Saskatchewan emergency departments for respiratory-like illness (RLI) are stable at
33.2 per 1,000 visits last week compared to 32.3 per 1,000 this week. Calls to 811 HealthLine for RLIs
have increased over the past month, from 116 to 141 per 1,000 calls.
COVID-19
COVID-19 test positivity in Saskatchewan was 6.7%, an increase from 5.8% last week. Cases are
largely in the 65 and over age group (47%).
The number of new COVID-19 outbreaks in high-risk settings remained steady at four to six per week
over the past month.
BA.5 and its sublineages (denoted as BA.5*) are the most commonly detected variants at 93.9% of
current reporting period, followed by BA.2* (4.0%) and BA.4* (1.4%).
The first detections of Omicron sublineage XBB.1.5 occurred in this reporting period.
COVID-19 hospitalizations decreased from 103 to 92 admissions per week.
COVID-19 ICU admissions remain stable at eight admissions per week – most were 60+ years old.
The proportion of staffed inpatient beds occupied by COVID-19 patients has decreased from 6.5% to
5.7% in the most recent week compared to the previous week.
COVID-19 deaths have dropped from an average of 11 deaths per week in the previous three weeks
to three reported deaths in the most recent week.
Having a COVID-19 booster in the last six months reduces the risk of a COVID-19 death eight times
compared unvaccinated individuals and over four times compared to those without a recent booster
dose.
With the exception of Regina, all areas of the province have less than 50% of their population up-to-
date 1 for COVID-19 vaccines. Less than half of individuals aged 50+ have had more than one booster
dose (46%).
Of those aged five years and older, 21% have received their latest booster dose in the last six
months. Only 18% of individuals aged 12+ years have received a bivalent booster dose (n = 191,441
doses).
* Represents all sublineages of Omicron
1 Up-to-date = completed a primary series and at least one additional booster, age 5+ years
Community Respiratory Illness Surveillance Program Page |1
Influenza
Influenza detections decreased from 122 to 69 positive lab test in this reporting period.
Influenza test positivity dropped from 20.1% in the first week of December to 5.0% in the week
ending December 31.
Influenza cases are predominately in the 20 – 64 year age group (41.0%).
One influenza outbreak in a high-risk setting was reported in the past week.
Influenza hospitalizations have decreased in this reporting period; however, influenza ICU admissions
increased.
Deaths due to Influenza continue to occur with three deaths reported in the last two weeks.
The influenza immunization campaign launched October 11, 2022. To date, one-quarter of the
Saskatchewan population (25%) have received an influenza vaccine, a one percent increase from the
previous reporting period. This is a 12% decrease in doses administered compared to the same time
last year.
Test positivity remains highest in the Far North East (La Ronge and area) at 15.8% and North East
(Melfort and area) at 25.0%.
Other Respiratory Viruses 2
RSV detections increased over the past month from 83 to 176 cases last week. Lab test positivity
tripled from 5.0% to 15%.
RSV cases are largely in the pediatric age group – in the most recent surveillance week 124 cases
(71%) were aged 0 – 4 years.
RSV hospitalizations have increased slightly from 44 hospitalizations to 47 in the most recent week.
The majority of RSV hospitalizations occurred in children aged 0 – 19 years.
‘Other’ respiratory viruses fluctuated between 121 to 155 lab confirmed cases per week over the
past month.
Outbreaks of ‘other’ viruses in high-risk settings varied between zero and five outbreaks per week
over the past month.
2Parainfluenza viruses 1 – 4 (PIV 1 – 4); Adenovirus (ADV); Rhinovirus (RV); Human Metapneumovirus (HMPV); NOTE: RSV test positivity now exceeds 1% and
is reported separately.
Community Respiratory Illness Surveillance Program Page |2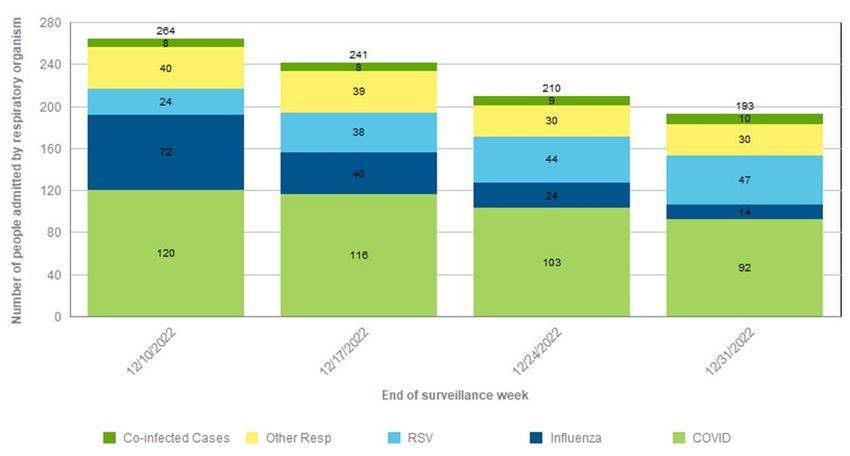
Table 1: Viral indicators by surveillance period, December 18– 31, 2022
                             COVID-19                                                                                                RSV                         ‘Other’1
                                                                                Influenza
                              positive                                                          Influenza                          positive                      positive
                                            COVID-19 test     COVID-19           positive                        Influenza                      RSV test                       ‘Other’1 test      ‘Other’1
   Report date            laboratory test                                                          test                          laboratory                    laboratory
                                              positivity      outbreaks        laboratory                        outbreaks                      positivity                       positivity      outbreaks
                                                                                                positivity                           test                          test
                                                                                   test

Dec 25 – Dec 31                 302            6.7%                4               69             5.0%               1              176          14.6%            121             5.3%               2
Dec 18 – Dec 24                 326            5.8%                5              122             7.7%               2              167          13.0%            135             5.2%               3
Dec 11 – Dec 17                 376            5.8%                6              268            14.2%               4              153          10.4%            155             5.1%               5
Dec 04 – Dec 10                 427            6.6%                4              411            20.1%               7              83            5.4%            121             3.5%               0
 Notes: Parainfluenza viruses 1 – 4; Adenovirus; Human Metapneumovirus, seasonal Coronavirus. See Technical Notes for further details.
        1

 Table 2: Patient-confirmed respiratory illness by age group, December 25-31, 2022

            Age group (Years)                     COVID-19 case count                   Influenza case count                   RSV case count                            Others case count1

                 0-4                                    18 (8%)                              15 (23%)                           124 (71%)

                 5 - 19                                 13 (5%)                               7 (11%)                             11 (6%)
                                                                                                                                                                                N/A
                20 - 64                                97 (40%)                              27 (41%)                            17 (10%)

                  ≥65                                 113 (47%)                              17 (26%)                            24 (14%)

                 Total                                242 (100%)                            66 (100%)                          176 (100%)                                       121
 Notes: Parainfluenza viruses 1 – 4; Adenovirus; Human Metapneumovirus, seasonal Coronavirus; age-specific data is unavailable for other respiratory pathogens. Due to the rounding, total percentage may not
        1

 add to 100%. See Technical Notes for further details.

 Community Respiratory Illness Surveillance Program                                         Page |3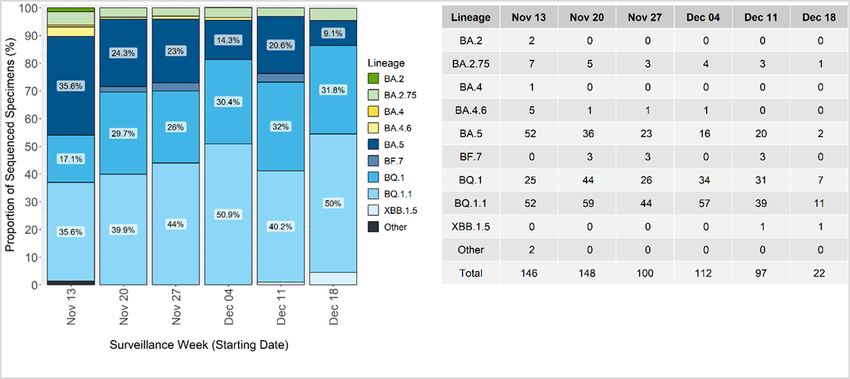
Table 3: Sentinel* indicators by surveillance period, December 18–31, 2022
                           School illness
                                                RLI** ED visits     RLI** 811 calls                                                                             Sentinel provider       Most commonly detected
   Report date             absenteeism                                                                  COVID-19 Wastewater indicator3
                                                  per 1,0002          per 1,000                                                                                   test positivity       virus: Sentinel providers
                              >=10%1

Dec 25 – Dec 31                N/A                   32.3               140.5                                       No data                                           15.4                    Adenovirus

                                                                                                                 Low (n=2);
Dec 18 – Dec 24                8.5%                  33.2               100.7                                                                                         41.7                    Rhino virus
                                                                                                               Moderate (n=5);
                                                                                                                 Low (n=3);
Dec 11 – Dec 17               13.2%                  32.0               99.7                                   Moderate (n=4);                                        32.0               Parainfluenza virus

                                                                                                               Low (n=3);
                                                                                                             Moderate (n=3);
Dec 04 – Dec 10               14.0%                  47.0               115.6                                                                                         30.8               Parainfluenza virus
                                                                                                            Moderate-High (n=1)

  Notes: *Sentinel surveillance are sampling programs representative of the population; **Respiratory-like illness (RLI); 1 School absenteeism is the proportion of scheduled children who were absent from the class
  due to illness. The type of illness is not specified. Due to Christmas break schools were closed and no absenteeism data was available for the most recent reporting week; Not Available (N/A). 2Dec 18-Dec 24 based
  on reports from eight of thirteen reporting areas; Dec 25-Dec 31 based on reports from seven of thirteen reporting areas. 3Count of wastewater treatment facilities reporting low, moderate or high levels of viral
  load causing COVID-19 infection (see Technical Notes for details); Due to the holidays, the University of Regina and University of Saskatchewan Waster Water teams didn’t provide data for the week Dec 25-31.

  Community Respiratory Illness Surveillance Program                                           Page |4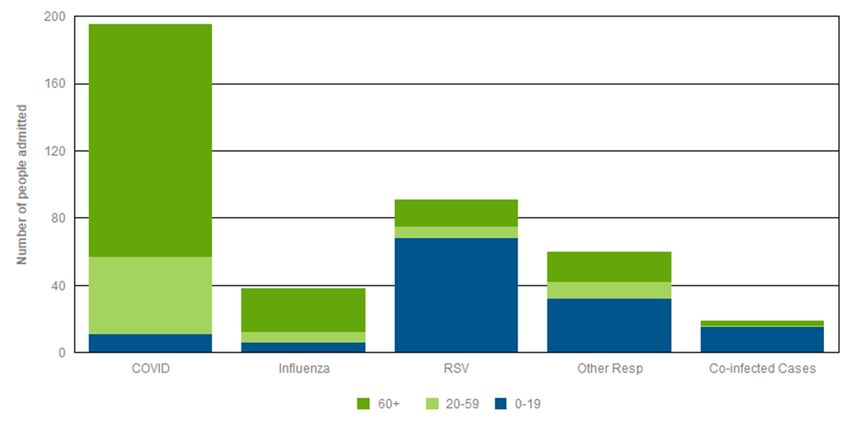
Table 4: Outcome, health care capacity and immunization coverage indicators by surveillance period, December 18–31, 2022¥
                                                                                                                                       % of staffed                                                        Total eligible
                                                                                                                                                                                        Total eligible
                                                                                                                                        inpatient                                                           population
                      Hospital                             Hospital                               Hospital                                              Deaths –                         population
                                     ICU admissions                        ICU admissions                         ICU admissions          beds                           Deaths –                         Immunized for
    Report date     admissions –                         admissions –                           admissions –                                             COVID-                         up-to-date –
                                       – COVID-19                            – Influenza                               – RSV           occupied by                      Influenza 3                          Influenza
                     COVID-191                            Influenza                                 RSV                                                   193                             COVID-19
                                                                                                                                        COVID-19                                                              vaccine5
                                                                                                                                                                                           vaccine4
                                                                                                                                        patients2

Dec 25 – 31               92                8                 14                  4                  47                  3                5.7%              3               2               45.9%               25%
Dec 18 – 24              103                8                 24                  2                  44                  3                6.5%              7               1               45.9%               25%
Dec 11 – 17              116                7                 40                  4                  38                  1                7.4%             11               1               45.8%               24%
Dec 4 – 10               120                8                 72                  8                  24                  0                8.4%             16               2               45.8%               23%
¥Additional  information on hospital admission stratified by respiratory organism and age group is provided below in Figure 5 and 6 respectively. Viral infection may not be the main reason for the admission.
3Deaths    due to Influenza continue to occur with three deaths reported in the last two weeks, for a total of fifteen during this season.

Cases by respiratory organisms across the age groups
•    From December 18 – 31, 2022, there were 403 respiratory illness cases hospitalized with lab-positive Covid19 (195), influenza (38), RSV (91), other respiratory illnesses (60), and co-infected cases (19). Among
     the 403 cases, 195 Covid19 lab positives were among age groups of 0-19 (11), 20-59 (46), and ≥60 (138). Influenza lab positives (38) were among age groups of 0-19 (6), 20-59 (6), and ≥60 (26). For RSV lab
     positives (91), cases were among the age groups of 0-19 (68), 20-59 (7) and ≥60 (16). For other respiratory lab positives (60), cases were in the age group of 0-19 (32), 20-59 (10), and ≥60 (18). For Co-infections
     lab positives (19), cases were in the age group of 0-19 (15), 20-59 (1), and ≥60 (3).
•    From December 18 - 31, 2022, there were 39 respiratory illness cases admitted to the ICU with lab-positive Covid19 (16), influenza (6), RSV (6), other respiratory illnesses (5), and co-infected cases (6). Among
     the 39 cases, 16 Covid19 lab positives were among age groups of 20-59 (5) and ≥60 (11). Influenza lab positives (6) were among age groups of 0-19 (1), 20-59 (3) and ≥60 (2). For RSV lab positives (6), cases
     were among the age groups of 0-19 (4), 20-59 (1) and ≥60 (1). For other respiratory lab positives (5), cases were in the age group of 0-19 (2), 20-59 (2), and ≥60 (1). For Co-infections lab positives (6), cases were
     among the age groups of 0-19 (4) and ≥60 (2).

Notes:
1 Because of the delay in date tested result, it affects the total number of Influenza (A/B), RSV and other respiratory virus admissions for a particular day. This lag in data impacts mostly the last couple of days from

the day the report is updated. The counts for influenza, RSV, and other respiratory virus-associated hospital and ICU admissions refer to individuals with laboratory tests positive for influenza, RSV, and other
respiratory viruses, respectively, occurring within four days before the admission date AND/OR at any point during the hospital stay. The counts for COVID-19 hospital and ICU admissions refer to individuals with
laboratory tests positive for COVID-19 virus, occurring within 21 days before the admission date and/or at any point during the hospital stay or 7 days from the discharge. Episodes of care considers patients total
movement within the health system related to their condition. It combines 2 or more admission from 2 or more different facilities, if they are transfers (No break in care). Transfer: Admission to any other hospital
within 24 hours of discharge from previous hospital. Co-infected cases: positive for influenza and RSV or, positive for influenza and other respiratory virus or positive for RSV and other respiratory viruses or, positive
for COVID-19 and influenza or, positive for COVID-19 and RSV or, Positive for COVID-19 and other resp viruses. Other includes: Parainfluenza 1-4, Adenovirus, Enterovirus, Human Metapneumovirus, Rhinovirus,
Seasonal Coronovirus (O43, NL63, 229E, HKU1f.)2 7-day average of percentage of acute inpatient beds staffed and in operation that are occupied by COVID-positive patients as of 8AM census
3
  Includes deaths entered into Panorama IOM among lab-confirmed cases. Deaths reported based on the actual date of death..Deaths reported in previous periods subject to change due death reporting data lags
4   Up-to-date = completed a primary series and at least one additional booster, age 5+ year. 5 Up-to-date = received a vaccination within the current influenza season, age 6 months+ See Technical Notes for details.

Community Respiratory Illness Surveillance Program                                             Page |5
Figure 1: Epidemic curve, respiratory illness by respiratory organism and test positivity, August 29, 2021 - December 31, 2022 Data sources: Panorama IOM extracted on January 2, 2023 (COVID-19 cases). Respiratory Virus Detections Surveillance System (influenza and other respiratory) (RRPL extracted January 3, 2023). As of September 4, 2022, COVID-19 cases include new and reinfections. For the two weeks of Dec 18 to Dec 31, 2022, there were 523 COVID-19 cases (71 were 0 to 19 years; 182 were 20 to 59 years; and 270 were 60 years and older). For the two weeks of Dec 18 to Dec 31, 2022, there were 191 influenza lab detections. For the two weeks of Dec 18 to Dec 31, 2022, there were 343 RSV detections. For the two weeks of Dec 18 to Dec 31, 2022, there were 256 other viral lab detections (parainfluenza, adenovirus, human metapneumovirus, rhinovirus, coronavirus) Figure 2: Percentage of SARS-CoV-2 variants by surveillance week*, November 13 – December 18, 2022 Data Source: Roy Romanow Provincial Laboratory, Saskatchewan Health Authority, as of January 4, 2023 The most recent VOC data available from the Provincial database is as of surveillance week ending December 18, 2022 * Surveillance week correspond to specimen collection date. Community Respiratory Illness Surveillance Program Page |6
Figure 3: Proportion of residents by age group and COVID-19 vaccination status to December 31, 2022

Data source(s): Data sources: Panorama January 2, 2023; Saskatchewan Covered Population, 12-Nov-2022, Ministry of Health version (2022 Version 2)
Note: Of those five years and older: 45.9% have completed their series and received a booster dose. 21.1% have received their latest dose in the last six
months. Of those 12 years and older, 18.4% were administered a Moderna or a Pfizer bivalent. As of Dec 31, 2023, cumulatively doses administered are as
follows: dose 1, n=992,032; dose 2, n=926,501; dose 3, n=530,373; completed plus 2 or more additional doses, n=359,658; total doses = 2,808,564

Figure 4: Booster dose within last 6 months reduces the risk of Hospitalization, ICU admission or Death (age
adjusted rates), June 24, 2022 – December 24, 2022

Data Source: Digital Health Analytics, Saskatchewan Health Authority
Definitions: Unvaccinated - Individuals with no record of vaccine received or vaccinated with first dose but less than 21 days from receiving the first dose.
Vaccinated with 2 doses - Individuals who have received their second dose for more than 14 days or their third dose is less than 14 days. Booster in the past 6
months - Individuals who have received any booster dose (3rd, 4th, 5th and so on) within the last 6 months. Details on methodology is provided in the technical
notes.

Community Respiratory Illness Surveillance Program                            Page |7
Figure 5: The number of COVID-19, influenza, RSV, other respiratory viruses and co-infected cases admitted to
hospital by week of the admission, December 04 – 31, 2022*

Data source(s): Digital Health Analytics, Saskatchewan Health Authority, Episode of Care methodology (Admission, Discharge, Transfer Database (ADT, RPPL,
Panorama); data extracted on January 3, 2023. * Viral infection may not be the main reason for the admission.
Note: Because of the delay in date tested result, it affects the total number of COVID 19 admissions for a particular day. This lag in data impacts mostly the
last couple of days from the day the report is updated. Includes lab positive for influenza, RSV, other respiratory viruses, four days prior to date of admission
AND/OR at any point during admission. Episode of Care considers patients total movement within the health system related to their condition. It combines 2
or more admissions from 2 or more different facilities, if they are transferred (no break in care). Transfer = admission to any other hospital within 24 hours of
discharge from previous hospital. Co-infected cases = positive for Influenza and RSV, or, Influenza and ‘other’, or, RSV and ‘other’, or, COVID-19 and Influenza,
or, COVID-19 and RSV, or, COVID-19 and ‘other’.

Figure 6: The number of COVID-19, influenza, RSV, other respiratory viruses and co-infected cases admitted to
hospital by age group, December 18 – 31, 2022*

Data source(s): Digital Health Analytics, Saskatchewan Health Authority, Episode of Care methodology (Admission, Discharge, Transfer Database (ADT, RPPL,
Panorama); data extracted on January 3, 2023. * Viral infection may not be the main reason for the admission
Note: Because of the delay in date tested result, it affects the total number of COVID 19 admissions for a particular day. This lag in data impacts mostly the
last couple of days from the day the report is updated. Includes lab positive for influenza, RSV, other respiratory viruses, four days prior to date of admission
AND/OR at any point during admission. Episode of Care considers patients total movement within the health system related to their condition. It combines 2
or more admissions from 2 or more different facilities, if they are transferred (no break in care). Transfer = admission to any other hospital within 24 hours of
discharge from previous hospital. Co-infected cases = positive for Influenza and RSV, or, Influenza and ‘other’, or, RSV and ‘other’, or, COVID-19 and Influenza,
or, COVID-19 and RSV, or, COVID-19 and ‘other’.

Community Respiratory Illness Surveillance Program                             Page |8
Figure 7: COVID-19 deaths by age group and week, September 4 - December 31, 2022*

Data source(s): Panorama January 2, 2022
In the past two weeks, Dec 18 to Dec 31, there have been 10 deaths in COVD-19 cases, one in the 20 to 59 age group, and nine in the 60 years or older
group.* Total COVID-19 deaths from March 2020 to December 31, 2022 (n = 1,800)

Community Respiratory Illness Surveillance Program                          Page |9
Table 5: Community Respiratory Infection Surveillance Program Indicators by zone, December 25 – 31, 2022
                                                         Test                                                                                                                    Total eligible
                                                                         Test positivity –                                                                                                             Total eligible
                                                      positivity –                               RLI* visits to                           School illness                          population
                                                                            Influenza                                RLI* 811 calls                            Wastewater                               population
                   Location                           COVID-191                                    EDs per                                absenteeism                             up-to-date
                                                                          (positive lab                               per 1,0003                                indicator5                              Immunized
                                                     (positive lab                                  1,0002                                   >=10%4                              vaccination –
                                                                              tests)                                                                                                                  for– Influenza7
                                                        tests)                                                                                                                    COVID-196
Far North West
                                                       13.9% (10)              2.6% (1)              No data                 -                                        -               24.3%                  10%
(Meadow Lake and area)
Far North Central                                       100% (2)               0.0% (0)              No data                 -                                        -               14.4%                   3%
Far North East
                                                        16.7% (6)             15.8% (3)              No data                 -                                       -                24.9%                   8%
(La Ronge and area)
North West
                                                        8.9% (18)              1.1%(1)                 24.6               126.7                                   No data             35.4%                  17%
(North Battleford/ Lloydminster and area)
North Central
                                                        9.2% (14)              6.0% (3)                10.1                  -                                    No data             40.6%                  21%
(Prince Albert and area)
North East
                                                        2.4% (2)              25.0% (3)               112.9               123.8                                       -               43.9%                  25%
(Melfort and area)
Saskatoon                                               8.0% (64)             3.8% (10)                16.9               158.2                                   No data             48.9%                  26%
Central West                                                                                                                               Not Available
                                                       14.7% (11)              2.4% (1)                77.3                  -                                        -               43.9%                  28%
(Kindersley and area)
Central East
                                                        7.0% (25)              3.0% (5)              No data                 -                                    No data             45.7%                  24%
(Yorkton/Melville and area)
Regina                                                  6.5% (32)             6.4% (24)                58.4               124.8                                   No data             51.6%                  26%
South West
                                                        1.2% (1)               3.9% (2)              No data              153.8                                   No data             40.8%                  25%
(Swift Current/Maple Creek and area)
South Central
                                                        5.9% (11)              2.7% (2)              No data                 -                                    No data             44.2%                  25%
(Moose Jaw and area)
South East
                                                        8.4% (15)              8.1% (8)               147.8               142.9                                   No data             39.3%                  23%
(Weyburn/Estevan and area)
Unknown/Out of Province                                5.1%^ (91)              3.2% (3)
                                                          6.7%                   5.0%                  32.3               140.5                                                       45.9%                  25%
SASKATCHEWAN
 Notes: 1by week of lab detection; effective Oct 30, 2022 includes cases who tested positive more than once >= 90 days apart; ^ For COVID-19 test positivity, all tests reported were performed within the province.
 2Based  on reports from five of thirteen reporting areas; 3811 data available at the five Integrated Service Areas geographical level; 4Due to Christmas break schools were closed and no absenteeism data is available
 for this reporting week.; *Respiratory-like illness; 5 Due to the holidays, the University of Regina and University of Saskatchewan Waster Water teams didn’t provide data for the week Dec 25-31 6Up-to-date =
 completed a primary series and at least one additional booster, age 5+ years; 7received a vaccination within the current influenza season, age 6 months+; Does not include doses administered through NITHA or
 FNIHB, therefore some zones underestimated coverage. ^Includes positive tests with pending locations. Numbers in parenthesis represents positive lab tests.

 Community Respiratory Illness Surveillance Program                           P a g e | 10
Technical Notes
1. Laboratory surveillance: Conducted through epidemiological analyses and 10. Variant of concern (VOC): VOCs are SARS-CoV-2 viruses that have undergone
Laboratory surveillance: Conducted through epidemiological analyses and genetic modification or mutation causing altered virus infectivity, replication and
positivity rate monitoring (counts and proportion of positive specimens, week of pathogenicity. As a result it can alter host immune response. The Roy Romanow
specimen collection, age category, geographical area, etiological type where Provincial Laboratory (RRPL) tests for and monitors COVID-19 variants of
applicable) of selected respiratory specimens submitted to the provincial concern (VOCs) in Saskatchewan. Confirmation of VOC linages is done by
laboratory in SK. Whole genome sequencing is conducted to detect changes conducting whole genome sequencing (WGS) at RRPL or the National
(emergence of sub-lineages, variant proportion, etc) of clinical and public health Microbiology Laboratory. one to two weeks to complete WGS. Data sources for
importance among circulating respiratory organisms. VOCs analysis include testing data from the RRPL, and epidemiological
information from Panorama. Where geographical zone is missing in RRPL or
2. Sentinel health providers: Comprise a geographical-based network in practices Panorama data, the Saskatchewan postal code file is used to identify cases’
across the province (n = 13 zones) who submit one to two specimens weekly to geographical information.
the Virology Section of the Roy Romanow Provincial Laboratory (RRPL),
Saskatchewan Health Authority, from patients presenting with respiratory-like 11. VOC Lineages B.1.1.529, BA.1, BA.2, BA.2.3.20, BA.2.75, BA.4, BA.4.6, BA.5,
symptoms. Specimens are tested for a wider complement of respiratory BF.7, BQ.1, BQ.1.1, and XBB.1.5 are all classified under the WHO Label of
organisms to monitor respiratory illness activity in the community. Assessment “Omicron”. Omicron lineages BA.2.3.20, BA.2.75, BA.4.6, BF.7, BQ.1, BQ.1.1,
of co-infection (infected by more than one respiratory virus organism and XBB.1.5 are emerging global variants that RRPL continues to monitor.
concurrently) occurs through sentinel provider submissions. Lineages that are not explicitly listed are aggregated under their corresponding
parent lineage (e.g., BA.1, BA.2, BA.4, or BA.5). Previously, BA.2.3.20 and
3. Wastewater data: Provided by the University of Saskatchewan and University of BA.2.75 were sublineages aggregated with BA.2; BA.4.6 was aggregated with
Regina Wastewater Team. Viral load for each zone was used to determine risk BA.4; BF.7, BQ.1, and BQ.1.1 were aggregated with BA.5. “Other” represents
level (Low, Medium, Medium-High, High) using a four-bin system based on non-Omicron lineages as well as recombinant genomes – these include 2 cases
100% of early Omicron peak reported. Locations sampled, includes: Saskatoon, of recombinant genomes that do not have a designated lineage name at the
Regina, Lumsden, North Battleford, Prince Albert, Yorkton, Swift Current, Moose time of this publication. Percentages are shown when a lineage constitutes 5%
Jaw, and Weyburn or more of total specimens evaluated for a given surveillance week. BA.5 and its
4. Data collection from Emergency Departments (ED): Monitoring is done for a sublineages (denoted as BA.5*) are the most commonly detected variants
twenty-four hour period on at least one-week day (the exact time vary with the (93.9% of current reporting period), followed by BA.2* (4.0%) and BA.4* (1.4%).
ED schedule). The ED reports to local public health services in their area on * Represents all sub-lineages of Omicron.
Wednesday afternoon and public health report to the Ministry of Health on 12. COVID-19 cases: Effective September 4, 2022,COVID-19 cases are based on
Thursday each week. The count of Respiratory Like Illness (RLI) patients as a lab detection and include cases who tested positive more than once 90 days, or
proportion of total ED admissions is captured. further, apart. Prior to this, cases include, only, first time cases reported and
5. Reporting ED surveillance information: Because there is no centralized data entered into Panorama.
capture source for ED admissions in the province, each health area sets up a 13. COVID-19 Deaths: Includes deaths entered into Panorama IOM among
mechanism for EDs to report to public health services. Public health aggregates laboratory confirmed cases. Deaths are reported based on the actual date of
raw data from their EDs on the prescribed data collection form and sends it to death. Deaths in previous periods may be adjusted from previous reports due to
the Ministry of Health for overall provincial monitoring. FNIHB and NITHA will data lag
report to the local zone which the ED or health centre is located. This does not
preclude monitoring in First Nations health care facilities. 14. COVID-19 Immunizations: Up-to-date (UTD) COVID-19 vaccination is the
proportion of people having completed a primary series and one booster for
6. HealthLine 811 callers with Respiratory Symptoms (RLI): This count of response ages five and older divided by the eligible population found in the Saskatchewan
protocols collected by HealthLine nurses specific to callers reporting respiratory- Covered Population, 12-Nov-2022 Ministry of Health version (2022 Version
like symptoms. HealthLine data is collected for a seven day week, Monday to 2). Though vaccinated children six months to four years of age may be
Sunday. Data is transformed into the rate of callers with respiratory symptoms technically UTD, this specific definition does not apply to them. In addition, UTD
from each Integrated Service Area (ISA) per 1000 calls from that ISA concerning in last six months is calculated by the proportion of people having received one
any type of symptom. or more boosters within the previous six months.
7. A confirmed outbreak: Defined as two or more lab confirmed respiratory virus 15. Influenza immunizations: UTD Influenza vaccination is the proportion of people,
cases in high-risk settings where transmission is evident or there is a high level six months and older, having one influenza dose this season divided by the
of suspicion of transmission. Outbreaks are reported by the week they were eligible population found in the Saskatchewan Covered Population, 12-Nov-
reported to the local public health office and not necessarily in the week that the 2022 Ministry of Health version (2022 Version 2). Vaccination for the current
outbreak began. For this report outbreaks in high risk settings comprise long influenza season officially began October 11, 2022. Some doses were
term care facilities, personal care homes and group homes administered prior to the start date.
8. COVID hospitalized admissions is the number of C-19 positive cases that during 16. Staffed Inpatient beds: Weekly average COVID Occupancy is a 7-Day average
the surveillance week were admitted as an inpatient to an acute care facility. percentage of acute inpatient beds staffed and in operation COVID positive
This includes patients with C-19 related illness, incidental COVID infection, and patients occupy. The full calculation of this metric is: Average COVID
patients under investigation. COVID ICU admissions is the number of C-19 occupance=∑(8am covid census) ÷ ∑(8am beds staffed and in operation) ×
positive cases that during the surveillance week were admitted to an ICU 100%. Where “bed staffed and in operation = ”Planned beds” + “Surge Beds” -
location in SK. This includes both infectious and non-infectious cases. ”Closed” and ∑(…) indicates summation over 7-day period from Sunday to
9. Influenza, RSV and other respiratory virus admissions: Delays in testing results Saturday. 8am COVID census is taken from the ADT patient registration, which
affect the total number of Influenza, RSV and other respiratory virus admissions is fed to the provincial data-mart and archived hourly. 8am planned bed, surge
for a particular day. This lag in data has the greatest impact on the two days beds, and closed beds is compiled via data feeds from APF (Saskatoon &
prior to when the report is updated. Counts include individuals who are Regina) and the provincial bed edits interface (INH &IRH).
laboratory positive for influenza, RSV, and other respiratory viruses, within four 17. Rate of COVID-19 hospitalization (ICU or Death) were calculated by summing
days prior to date of admission AND/OR at any point during the hospital stay. the daily number of hospitalizations (ICUs or Deaths) for the period by vaccine
Episode of Care considers patients’ total movement within the health system status (numerator) divided by the mid period population by respective vaccine
related to their condition. It combines 2 or more admissions from 2 or more status (denominator), multiplied by 100,000. This estimate is further divided by
different facilities, if they are transfers (i.e., no break in care). Transfer: the number of days to obtain the daily rate. Denominator for individuals in the
Admission to any other hospital within 24 hours of discharge from previous Booster in the past 6-months group are all Saskatchewan residents who have
hospital. Co-infected Cases = if positive for Influenza and RSV or, positive for had their booster dose within the last 6 months. To eliminate bias of age all rates
Influenza and Other Respiratory viruses or, positive for RSV and Other are adjusted by age. Direct standardization method is employed using the
respiratory viruses or, positive for Covid-19 and Influenza or, positive for Covid- Saskatchewan population as the standard population. Age at first dose used in
19 and RSV or, positive for Covid-19 and Other Respiratory viruses. the rate calculation. Individuals with unknown age are excluded from age-
specific analyses. Estimates of relative risk (i.e. rate ratios) is obtained by
comparing vaccinated with 2 doses (Any Booster dose) and unvaccinated. Risk
estimates may differ from other reports due to differing methodologies.
Community Respiratory Illness Surveillance Program P a g e | 11You can also read