MI COVID response Data and modeling update - April 19, 2022 - State of Michigan

 
CONTINUE READING
MI COVID response Data and modeling update - April 19, 2022 - State of Michigan
MI COVID response
Data and modeling update
April 19, 2022
MI COVID response Data and modeling update - April 19, 2022 - State of Michigan
Executive Summary
Situational Awareness
• Global and National Trends show continued spread of Omicron BA.2 lineage
    •   Many countries in Europe showing early signs of decline
    •   U.S. cases increasing at a faster rate
•   As of April 14th, 92% of Michigan Counties at Low COVID-19 Community Levels
•    Michigan is seeing an increase in BA.2 with the limited number of specimens being sequenced
    • Nationally, the proportion of specimens sequenced as BA.2 is greater than 70%
• COVID+ census in hospitals, hospital admission, ICU utilization, and pediatric census is plateaued and, in some areas, starting to increase

Public Health Response
• Current case rates and hospitalizations, and increased access to mitigation, indicate Michigan continues in a post-surge recovery phase
• Vaccinations and Boosters administration remains a critical component during the recovery phase
MI COVID response Data and modeling update - April 19, 2022 - State of Michigan
Epidemiologic Surveillance: Key Messages
Global and National Trends show continued spread of Omicron BA.2 lineage
• Many countries in Europe showing early signs of decline
• U.S. cases increasing at a faster rate

As of April 14th, 92% of Michigan Counties at Low COVID-19 Community Levels
• Nationally and within the state, a majority of counties are classified as low
• This week no Michigan counties were classified as “high”

Case rates in Michigan are slowly increasing, with increases occurring more in the Southeast Michigan
• The proportion of BA.2 in the U.S. and Michigan continues to rise
  • Should case rates follow UK trends, we are expected to peak sometime between end of April and early May
• 65% of SWEEP sites saw an increase in the most recent week and another 20% of sites saw a plateau in trends
• Case trends are increasing for many age groups and for Asian/Pacific Islanders
• Cases within older school age children and LTCF are beginning to increase

Hospitalization Metrics in Michigan showing modest increases
• Two thirds of age groups saw increases for COVID-19 hospital admissions this week
• COVID+ hospital census has shown a slight increase (+3%) but ICU census continues to decline (-3%)
MI COVID response Data and modeling update - April 19, 2022 - State of Michigan
Global and National Trends
                                                                                                                                                  Region 5 New COVID-19 Cases, Reported to CDC
                                                                                                                                                      Seven-day moving average of new cases per 100K
                                                                                                                                   30

                                                                                                                                   25

                                                                                                                                   20

                                                                                                                                   15

                                                                                                                                   10

                                                                                                                                    5

                                                                                                                                    0
                                                                                                                                        3/1              3/8          3/15            3/22     3/29      4/5     4/12
                                                                                                                                              Illinois         Indiana        Michigan       Minnesota   Ohio   Wisconsin

  Globally, 504,621,243 cases and 6,198,920 deaths (Data* through 4/18/2022)
  •    Case rates appear to be declining or plateauing in most European countries following second Omicron wave
  United States: Reported cases (7-day average) have increased over 23.4% since the prior week¶
  •    In the U.S., the case rate is 73.3 cases/100,000 in last 7 days (last week: 59.4 cases per/100,000)
  Region 5 (Midwest) states are either plateaued or increasing at the moment
  •    Illinois and Wisconsin have the highest case rates in Region 5 (4/15)

Source: * Johns Hopkins Coronavirus Resource Center; ¶ CDC COVID Data Tracker Weekly Review; † CDC COVID Data Tracker – CDC recently updated their methodology for reporting case rates
MI COVID response Data and modeling update - April 19, 2022 - State of Michigan
As of April 14th, No Michigan Counties at High COVID-19 Community
      Levels

                                                                  Percent of Counties
                                                                                                                   United States                            Michigan
                                                                       Low                                                94.1%                               91.6%
                                                                       Medium                                              5.4%                                8.4%
                                                                       High
MI COVID response Data and modeling update - April 19, 2022 - State of Michigan
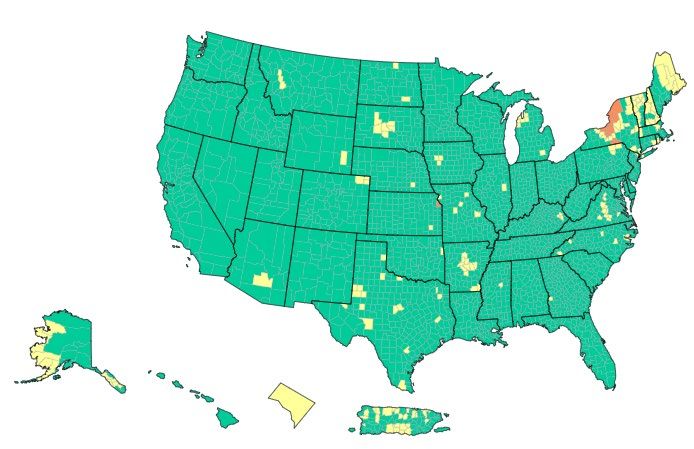
State Comparisons: Ohio and Indiana
Ohio Confirmed New Cases / 1M (7 days average)                                                                    Indiana Confirmed New Cases / 1M (7 days average)

2K                                                                                                                2K

1K                                                                                                                1K

0K                                                                                                                0K
             Aug 1, 20    Nov 1, 20    Feb 1, 21      May 1, 21   Aug 1, 21     Nov 1, 21   Feb 1, 22 May 1, 22                Aug 1, 20    Nov 1, 20    Feb 1, 21    May 1, 21   Aug 1, 21   Nov 1, 21   Feb 1, 22 May 1, 22

                                                                                                                  60K
60K
         Percent Positive (7 day average)                           New Tests
                                                                                                                             Percent Positive (7 day average)
                                                                                                                  40K                                                             New Tests
40K

20K                                                                                                               20K
                                                                                                                                                                                                                       4.7%
                                                                                                         3.4%

 0K                                                                                                                0K
              Aug 1, 20    Nov 1, 20    Feb 1, 21     May 1, 21   Aug 1, 21     Nov 1, 21   Feb 1, 22                           Aug 1, 20    Nov 1, 20    Feb 1, 21   May 1, 21   Aug 1, 21   Nov 1, 21   Feb 1, 22

  0                                                                                                                  0
             Mobility retails and recreational                                                                               Mobility retails and recreational
 -50                                                                                                               -50

 600
                                                                                                                   400
 400              Hospitalizations / 1M                                                                                               Hospitalizations / 1M
                                                                                                                   200
 200
                                                                                                          27                                                                                                            17
   0                                                                                                                 0
              Aug 1, 20    Nov 1, 20      Feb 1, 21   May 1, 21   Aug 1, 21     Nov 1, 21   Feb 1, 22                           Aug 1, 20    Nov 1, 20    Feb 1, 21   May 1, 21   Aug 1, 21   Nov 1, 21   Feb 1, 22

                                                                                                                                                                                                                        7
MI COVID response Data and modeling update - April 19, 2022 - State of Michigan
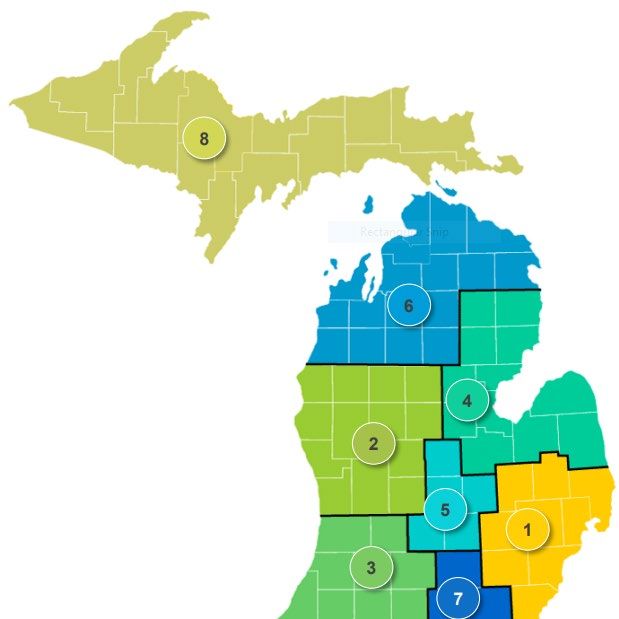
State Comparisons: Wisconsin and Michigan
Wisconsin Confirmed New Cases / 1M (7 days average)                                                               Michigan Confirmed New Cases / 1M (7 days average)

4K                                                                                                                 4K

2K
                                                                                                                   2K

0K                                                                                                                 0K
             Aug 1, 20    Nov 1, 20    Feb 1, 21      May 1, 21   Aug 1, 21     Nov 1, 21   Feb 1, 22 May 1, 22                Aug 1, 20    Nov 1, 20     Feb 1, 21   May 1, 21   Aug 1, 21   Nov 1, 21    Feb 1, 22 May 1, 22

60K                                                                                                               100K
         Percent Positive (7 day average)                           New Tests

40K                                                                                                                          Percent Positive (7 day average)

                                                                                                                  50K                                                                          New Tests
20K
                                                                                                         5.7%

                                                                                                                                                                                                                        6.0%
 0K                                                                                                                0K
              Aug 1, 20    Nov 1, 20    Feb 1, 21     May 1, 21   Aug 1, 21     Nov 1, 21   Feb 1, 22                           Aug 1, 20    Nov 1, 20    Feb 1, 21   May 1, 21   Aug 1, 21   Nov 1, 21    Feb 1, 22

  0                                                                                                                  0

 -50
             Mobility retails and recreational                                                                     -50
                                                                                                                             Mobility retails and recreational

                                                                                                                  -100
 400
                                                                                                                   400
                                                                                                                                  Hospitalizations / 1M
                  Hospitalizations / 1M
 200                                                                                                               200
                                                                                                          23                                                                                                             40
   0                                                                                                                 0
              Aug 1, 20    Nov 1, 20      Feb 1, 21   May 1, 21   Aug 1, 21     Nov 1, 21   Feb 1, 22                           Aug 1, 20    Nov 1, 20    Feb 1, 21   May 1, 21   Aug 1, 21   Nov 1, 21    Feb 1, 22

                                                                                                                                                                                                                         8
MI COVID response Data and modeling update - April 19, 2022 - State of Michigan
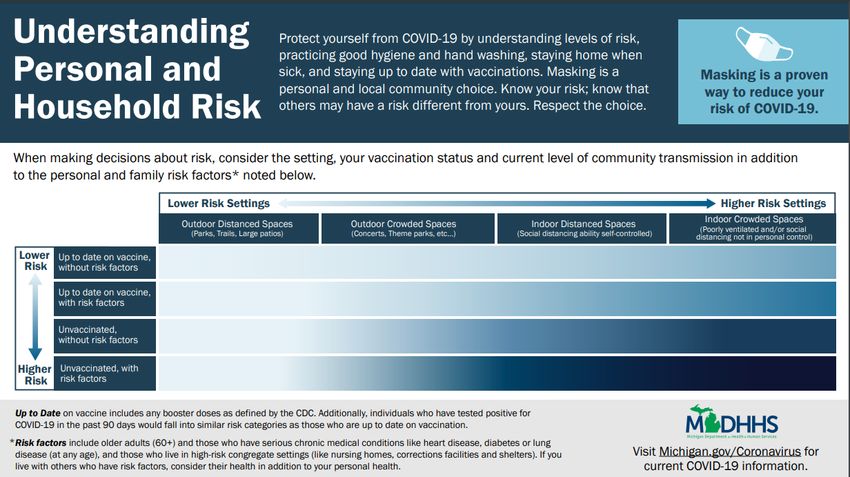
State Comparisons: Illinois and Minnesota
Illinois Confirmed New Cases / 1M (7 days average)                                                                Minnesota Confirmed New Cases / 1M (7 days average)

 3K                                                                                                                3K

 2K                                                                                                                2K

 1K                                                                                                                1K

 0K                                                                                                                0K
             Aug 1, 20    Nov 1, 20    Feb 1, 21      May 1, 21   Aug 1, 21     Nov 1, 21   Feb 1, 22 May 1, 22                Aug 1, 20    Nov 1, 20     Feb 1, 21   May 1, 21   Aug 1, 21   Nov 1, 21    Feb 1, 22 May 1, 22

200K                                                                                                              100K
         Percent Positive (7 day average)                           New Tests
                                                                                                                             Percent Positive (7 day average)

100K                                                                                                              50K                                                                          New Tests
                                                                                                                                                                                                                        6.0%
                                                                                                         4.4%

 0K                                                                                                                0K
              Aug 1, 20    Nov 1, 20    Feb 1, 21     May 1, 21   Aug 1, 21     Nov 1, 21   Feb 1, 22                           Aug 1, 20    Nov 1, 20    Feb 1, 21   May 1, 21   Aug 1, 21   Nov 1, 21    Feb 1, 22

   0                                                                                                                 0
             Mobility retails and recreational                                                                               Mobility retails and recreational
 -50                                                                                                               -50
                                                                                                                  -100
                                                                                                                   300
 400                                                                                                                              Hospitalizations / 1M
                  Hospitalizations / 1M                                                                            200
 200                                                                                                               100
                                                                                                          25                                                                                                             35
   0                                                                                                                 0
              Aug 1, 20    Nov 1, 20      Feb 1, 21   May 1, 21   Aug 1, 21     Nov 1, 21   Feb 1, 22                           Aug 1, 20    Nov 1, 20    Feb 1, 21   May 1, 21   Aug 1, 21   Nov 1, 21    Feb 1, 22

                                                                                                                                                                                                                         9
MI COVID response Data and modeling update - April 19, 2022 - State of Michigan
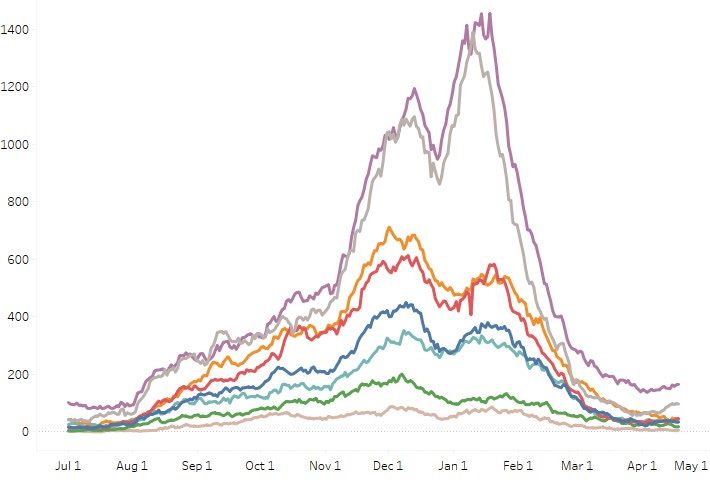
Recent statewide trends
          Statewide trends                                                         MERC Regional breakdown: Positivity, cases, hospitalization
                                                                                   rate, and deaths
                                                                                                                  Positivity: 7-day average positivity, %
                                   7-day average   Daily values                                                   Cases: 7-day average cases per million
                                                                                                                  Hosp. rate: 7-day average hospitalization rate, %
                                                                                                                  Deaths: 7-day average deaths per million

  Positivity, %                                                   Current: 6.7%
                                                                                                                                    Positivity: 4.3%
                                                                                                                                    Cases: 35.7
                                                                                                                                    Hosp. rate: 1.3%
                                                                                                                                    Deaths: 0.0

                                                                                    Positivity: 8.2%
                                                                                    Cases: 52.7
  Daily cases                                                      Current: 83.5    Hosp. rate: 3.2%
                                                                                    Deaths: 1.9
  per million
                                                                                               Positivity: 8.9%
                                                                                                                                                  Positivity: 6.1%
                                                                                               Cases: 44.4
                                                                                                                                                  Cases: 34.1
                                                                                               Hosp. rate: 2.1%
                                                                                                                                                  Hosp. rate: 1.6%
                                                                                               Deaths: 0.4
                                                                                                                                                  Deaths: 0.7
                                                                                             Positivity: 6.0%
                                                                                             Cases: 68.7                                           Positivity: 6.5%
  Daily                                                                                      Hosp. rate: 3.1%                                      Cases: 114.5
                                                                                             Deaths: 0.5                                           Hosp. rate: 2.5%
  hospitalization                                                                                                                                  Deaths: 0.4
                                                                  Current: 2.5%
  rate, %                                                                                  Positivity: 8.3%
                                                                                           Cases: 56.6                                              Positivity: 6.6%
                                                                                           Hosp. rate: 3.4%                                         Cases: 47.6
                                                                                           Deaths: 1.2                                              Hosp. rate: 3.4%
Source: https://mistartmap.info/                                                                                                                    Deaths: 0.9

                                                                                                                                                             10
Recent trends: Case Rates*   Recent trends: Hospital Capacity

Detroit MERC
Region

                                                                                                  All charts
Lansing                                                                                           represent
MERC Region                                                                                       data from
                                                                                                  03/17/22 –
                                                                                                   04/17/22

Saginaw
MERC Region

*Case rates reported by onset date are subject to backfill                                                11
Source: MI Start Map; MDOC excluded
Recent trends: Case Rates*   Recent trends: Hospital Capacity

Kalamazoo
MERC Region

                                                                                                  All charts
Jackson                                                                                           represent
MERC Region                                                                                       data from
                                                                                                  03/17/22 –
                                                                                                   04/17/22

Grand Rapids
MERC Region

*Case rates reported by onset date are subject to backfill                                                12
Source: MI Start Map; MDOC excluded
Recent trends: Case Rates*   Recent trends: Hospital Capacity

Traverse City
MERC Region

                                                                                                  All charts
                                                                                                  represent
                                                                                                  data from
                                                                                                  03/17/22 –
                                                                                                   04/17/22
Upper
Peninsula
MERC Region

*Case rates reported by onset date are subject to backfill                                                13
Source: MI Start Map; MDOC excluded
Case rate are plateaued or increasing for stratified groups
 Daily new confirmed and probable cases per million by age group (7-day rolling average)
  150                      0-9                 30-39              60-69
                           10-19               40-49               70-79
  125                      20-29               50-59               80+                                                          •     Case rates by onset date for all age groups are
                                                                                                                                      between 57.1 and 119.5 cases per million
  100
                                                                                                                                      (through 4/11)
    75
                                                                                                                                •     Case counts and case rates are highest for 20-
    50                                                                                                                                29-year-olds this week, followed by 30–39-year-
                                                                                                                                      olds and the 40–49-year age groups
    25

      0
          3/1              3/8              3/15               3/22                 3/29   4/5              4/12

 Daily new confirmed and probable cases per million (7 day rolling average) by race & ethnicity category
                American Indian/Alaska Native                Black/African American                        Hispanic or Latino         Not Hispanic or Latino
  150                                                                                       150
                Asian/Pacific Islander                       White
                                                                                                                                                                      •   Case rates are
  125                                                                                       125
                                                                                                                                                                          highest for
  100                                                                                       100                                                                           Asian/Pacific
    75                                                                                       75                                                                           Islander populations
                                                                                                                                                                          (135.4
    50                                                                                       50
                                                                                                                                                                          cases/million)
    25                                                                                       25
                                                                                                                                                                      •   18% of cases
      0                                                                                          0                                                                        missing race in last
          3/1        3/8         3/15        3/22        3/29         4/5           4/12             3/1       3/8     3/15         3/22    3/29     4/5       4/12
                                                                                                                                                                          30 days
 Note: Case information sourced from MDHHS and reflects date of onset of symptoms                                                                                                        14
 Source: MDHHS – Michigan Disease Surveillance System
Identified COVID-19 Cases Caused by Variants of Concern (VOC) in
  US and Michigan
      SARS-CoV-2 Variants Circulating in the                                                                      VOC Distribution in Michigan
      United States, Apr 10 – Apr 16 (NOWCAST)

Data last updated April 19, 2022
Source: MDSS                                                                                                           •   Since March 15, there have 934 VOC specimens sequenced
¶ Sequence specimens are from the most recent week by onset date which may change as more specimens are sent in
                                                                                                                       •   Cumulatively, 785 Omicron BA.2 specimens identified from 50
                                                                                                                           counties and City of Detroit
Emerging Variant Update
   • Omicron continues to be the predominant variant of concern, including all its sublineages
          • There are several sublineages of this variant, including BA.4, BA.5, BA.2.12.1, and several
            recombinants of BA.1 and BA.2, most notable the XE recombinant
   • Most of these sublineages are just a small fraction of specimens sequenced internationally
     and nationally
          • Here in the U.S., BA.2 remains the most predominant but the proportion of BA.2.12.1 is increasing
            faster than other lineages
   • In the UK, XE appears to have a slight growth advantage over BA.2 in the UK but is still less
     than 1% of cases
   • BA.2.12.1 is the most common circulating strain in Northeastern U.S., where cases are on
     the rise
   • Globally, BA.4 and BA.5 have only been identified in a handful of countries with around
     200 specimens sequenced
          • To date, there does not appear to be an increase in transmissibility, change in hospital epidemiology,
            or additional evasion of current counter measures compared to predominant Omicron variant
Sources: UKHSA technical briefings, WHO science briefing , GSAID – COVID sequencing
Case rates in Michigan are plateauing, projections based on UK
suggest a coming increase, although not to the levels of BA.1 wave
            Michigan Rt                                                                             Sixteen counties currently showing increases and
                                                                                                    28 in elevated incidence plateaus (via
                                                                                                    mistartmap.info as of 4/18/22, data through
                                                                                                    4/10/22).

                                                                           Data incomplete
               Michigan Case Rates
                                                         Data incomplete

Sources: MDSS cases plotted by onset date as for 4/8/22, UK case rates from Our World in Data. Projections
are a what-if scenario supposing Michigan’s transmission levels (Rt) follow the UK’s Rt for the BA.2 wave.
Sentinel Summary
                                                                                                                                                       •   15% (3/20) of
                                                                                                                                                           sentinel sites are
                                                                                                                                                           showing declines in
                                                                                                                                                           the previous 15-
                                                                                                                                                           days
                                                                                                                                                       •   65% (13/20) of
                                                                                                                                                           sentinel sites are
                                                                                                                                                           showing increasing
                                                                                                                                                           trends over last 15-
                                                                                                                                                           days
                                                                                                                                                       •   The remaining 20%
                                                                                                                                                           of sites have
                                                                                                                                                           plateaued over the
                                                                                                                                                           last 15 days.

Source: MDHHS – Sentinel Wastewater Epidemiology Evaluation Project - https://www.michigan.gov/coronavirus/0,9753,7-406-98163_98173-573480--,00.html                        18
Interpreting Wastewater Should Be In Context with Other Indicators

       •     When levels of virus in wastewater are low, a
             modest increase overall in virus level can appear
             much larger as numbers are translated into
             percentages
            • This does not necessarily mean we will see
               major increases in transmission in the
               community

       •     When increases are seen within one wastewater
             site, public health officials compare with
             neighboring communities and other data sources
             to understand potential of surges
            • For example, the Ypsilanti WWTP saw
                increases in SARS-CoV-2 levels which
                correlated with increasing presence of Omicron
                BA.2 lineage and then followed by an increase
                in cases

Source: MDHHS – Sentinel Wastewater Epidemiology Evaluation Project - https://www.michigan.gov/coronavirus/0,9753,7-406-98163_98173-573480--,00.html   19
Slow case rate increase in the school-aged population statewide
 •    Case rates in 5–18-year-olds are lower than rates in 19–50-year-olds
 •    Case rates among all populations (school-aged and non) are plateauing
                                                                                       Age groups

                                                                                       Age groups

Sources: MDSS case data as of 4/18/2022 (data through 4/6/22), line charts use statewide age group population, map uses ISD enrolled populations from EOG mask tracker data.
Cases continue are plateaued or increasing in staff and residents in Long
   Term Care Facilities
                                STATE OF MICHIGAN WEEKLY TOTAL CONFIRMED COVID-19 CASES IN                                      STATE OF MICHIGAN WEEKLY TOTAL CONFIRMED COVID-19 CASES IN SNF
                                                AFC/HFA RESIDENTS AND STAFF                                                                          RESIDENTS AND STAFF
                                                  04/14/2021 TO 04/13/2022                                                                         04/16/2021 TO 04/15/2022
                     1800
                                                                                                                              1800
                     1600
                                                                                                                              1600
                     1400

                                                                                                            Number of Cases
   Number of Cases

                                                                                                                              1400
                     1200
                                                                                                                              1200
                     1000
                                                                                                                              1000
                      800
                                                                                                                               800
                      600
                                                                                                                               600
                      400                                                                                                      400
                      200                                                                                                      200
                       0                                                                                                        0
                            4/14 5/14 6/13 7/13 8/12 9/11 10/11 11/10 12/10 1/9              2/8 3/10 4/9                            4/16 5/16 6/16 7/16 8/16 9/16 10/16 11/16 12/16 1/16 2/16 3/16
                                Weekly Total Confirmed Cases Resident   Weekly Total Confirm Cases Staff                                  Weekly Total Confirmed Cases Resident   Weekly Total Confirm Cases Staff

  •                  Case counts in residents are plateaued in AFC/HFA (71) but increased in SNFs (76)
  •                  Case counts in staff increased in both AFC/HFA (39) and SNF (110)

  Abbreviations: AFC: Adult Foster Care; HFAs: Homes for the Aged; and SNF: Skilled Nursing Facilities

                                                                                                                                                                                                                     21
The data is from weekly reporting by facilities with bed occupancy of at least 13 beds.
Hospital admissions due to COVID-19 are Low but Increasing

•    Trends for daily average hospital admissions increased (+16%) since last week (vs. +10% prior week)
•    Two thirds of age groups saw increases this week
•    Fewer than 20 daily hospital admissions was seen for every age groups
Source: CHECC & EM Resource

                                                                                                           22
Hospital Admissions and Admission Rates by Age Group
 Daily new hospital admission per million by age group (7-day rolling average)
       Age                  Average† daily                          Average† Daily                         One Week           •   Through April 18, there were an average of 71.3
      Group               number of hospital                          Hospital                           % Change (Δ #)           hospital admissions per day due to COVID-19; an
                             admissions                            Admission Rate*                                                increase from last week (+16%, +10)
   0-11                                   1.9                                    1.3                              -41% (-1)   •   Two thirds of age groups saw increases this week
   12-17                                  0.7                                    0.9                          +25% (+
Statewide Hospitalization Trends: Total COVID+ Census
          Hospitalization Trends 7/1/2021 – 4/18/2022         The COVID+ census in hospitals has increased
     Confirmed Positive & Persons Under Investigation (PUI)   again this week (3% increase). This is the 2nd
                                                              week of small week over week increases.

                                                                      Hospitalized COVID Positive Long Term
                                                                         Trend (beginning March 2020)
            Confirmed Positive

                                     PUI

                                                                                                              24
Statewide Hospitalization Trends: Regional COVID+ Census
                                                    This week the COVID+ hospital census has
      Hospitalization Trends 7/1/2021 – 4/18/2022   decreased in Regions 1, 5, 6, 7, and 8. The COVID+
             Confirmed Positive by Region           census has increased in Regions 2N, 2S, and 3.

               Region 1
               Region 2N
               Region 2S
               Region 3
               Region 5
               Region 6
               Region 7                                 Region   COVID+ Hospitalizations       COVID+
               Region 8                                           (% Δ from last week)     Hospitalizations /
                                                                                                 MM
                                                    Region 1            34 (-13%)                31/M
                                                    Region 2N           97 (29%)                 44/M
                                                    Region 2S           165 (6%)                 74/M
                                                    Region 3            46 (24%)                 41/M
                                                    Region 5             35 (-8%)                37/M
                                                    Region 6            44 (-19%)                30/M
                                                    Region 7            18 (-22%)                36/M
                                                    Region 8             6 (-33%)                19/M

                                                                                                         25
Statewide Hospitalization Trends: ICU COVID+ Census
      Hospitalization Trends 7/1/2021 – 4/18/2022   Overall, the census of of COVID+ patients in ICUs is
                Confirmed Positive in ICUs          down 3% vs last week and essentially flat over the
                                                    past 2 weeks. There are less than 100 COVID+
                                                    patients in ICU beds across the state.

                                                    All regions have 5% or fewer ICU beds filled with
                                                    COVID+ patients.

                                                       Region   Adult COVID+ in      ICU      % of ICU beds
                                                                 ICU (% Δ from    Occupancy      COVID+
      Confirmed                                                    last week)
      Positive in ICU                               Region 1        8 (33%)          81%           4%
                                                    Region 2N      16 (-11%)         74%           3%
                                                    Region 2S       37 (-8%)         80%           5%
                                                    Region 3        8 (-11%)         85%           3%
                                                    Region 5        8 (60%)          67%           5%
                                                    Region 6        6 (-14%)         76%           3%
                                                    Region 7        5 (-17%)         71%           3%
                                                    Region 8         1 (0%)          52%           1%

                                                                                                         26
Statewide Hospitalization Trends: Pediatric COVID+ Census
                 Hospitalization Trends 1/1/2021 – 4/18/2022
                    Pediatric Hospitalizations, Confirmed
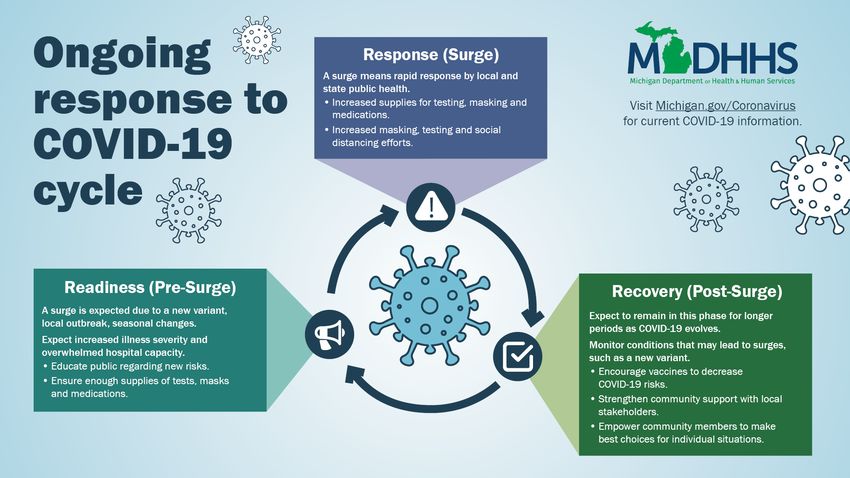
                                                               27
Harm Reduction: Key Messages
Currently in Recovery Phase of Michigan COVID-19 response cycle and most counties are at the low CDC Covid Community Level:
• Stay up to date on vaccine and get tested if feeling ill
• Empowering community members to make best choices for their individual circumstances

 Vaccinations and Boosters administration remains a critical component during the recovery phase,
 Unvaccinated people in Michigan had 1.8 times the risk of testing positive for COVID-19 in February compared to people up to date on their
   vaccination
   — In February, unvaccinated people in Michigan had 2.8 times the risk of testing positive for COVID-19 and 16 times the risk of dying from
      COVID-19 compared to people up to date on their vaccination
 Vaccination coverage has increased modestly with greatest increases in the percent who have received a booster dose
 MDHHS now has an additional tab for booster coverage data on the vaccine dashboard
 COVID-19 vaccinations remain safe and effective to prevent spread and severe disease
Vaccines                                                            Tests
Protect against                                              Prevent spread
severe outcomes                                      Over-the-counter tests
Vaccines are available                                    allow for testing at
for ages 5 and up.                                      home; an important
Boosters are available                                    addition to on-site
for ages 12 and up.
                                Protect Yourself,   antigen and PCR testing.

                                  Protect Your
Masks, Distancing
                                  Community
& Ventilation                                              Treatment
Prevent spread                                             Protect against
                                                         severe outcomes
People with symptoms, a
positive test, or exposure to                            Oral antivirals and
someone with COVID-19                                monoclonal antibodies
should wear a mask. Masking                           can reduce the risk of
may also be based on personal                           hospitalization and
preference and informed by                           death from COVID-19.
personal level of risk.
Unvaccinated people in Michigan had 1.8 times the risk of testing positive for              `

  COVID-19 in March compared to people up to date on their vaccination

                                                  Unvaccinated people aged 12 years and older had:
                                                                      2.8 X                             AND                            16 X                           in February, and
                                                     Risk of Testing Positive for COVID-19                                Risk of Dying from COVID-19

                                                                      1.8 X                          in March,* compared to people vaccinated with a primary series and a booster dose.**
                                                     Risk of Testing Positive for COVID-19
*These data reflect cases among persons with a positive specimen collection date through March 19, 2022, and deaths among persons with a positive specimen collection date through February 26, 2022.
Please note that these provisional data are subject to change. **Data on immune status are unavailable, thus an additional dose in an immunocompromised person cannot be distinguished from a booster dose.
Vaccinations and Boosters

    •   Over 15.7 million COVID-19 vaccine doses have been administered in Michigan
         •   Over 6.6 million Michiganders have received at least one dose (66.8%)
         •   Nearly 6 million Michiganders have completed a primary series (60%)
         •   Over 3.23 million additional/booster doses have been administered in Michigan
              •   54% of the fully vaccinated population has received a booster
              •   76.2% of the fully vaccinated population 65 years of age or older has received a booster

        COVID-19 Vaccine Coverage by Age Group                                     Initiation and Completion Trends in
                                                                                              5–11-year-olds

https://www.michigan.gov/coronavirus/0,9753,7-406-98178_103214_103272-547150--,00.html
                                                                                                                         31
https://covid.cdc.gov/covid-data-tracker/#vaccinations
Additional Doses and Booster Coverage

https://www.michigan.gov/coronavirus/0,9753,7-406-98178_103214_103272-547150--,00.html
CDC Authorizes 2nd Booster for those moderately to severely
immunocompromised or those 50 years of age and above

Four months after receipt of a first booster dose of Pfizer
BioNTech, Moderna or Janssen (Johnson & Johnson),
the following are now authorized and individuals may
choose to receive:                                                    Michigan currently has over 2.5
   • A second booster dose of the Pfizer-BioNTech COVID-19            million adult COVID vaccine
     vaccine or Moderna COVID-19 vaccine may be                       doses:
     administered to individuals 50 years of age and older.
                                                                          • 1.03 million Pfizer
   • A second booster dose of the Pfizer-BioNTech COVID-19
     vaccine may be administered to moderately or severely                • 1.2 million Moderna
     immunocompromised individuals 12 years of age and older.             • 0.27 million J&J
   • A second booster dose of the Moderna COVID-19 vaccine
     may be administered to moderately or severely
     immunocompromised individuals 18 years of age and older.         If you are interested in an
                                                                      additional/booster dose, you
The CDC definition for Up to Date on COVID-19 Vaccine is not          should not feel the need to
changed:                                                              wait.
   • A person is up to date with their COVID-19 vaccination if they
     have received all recommended doses in the primary series and
     one booster when eligible. Getting a second booster is not
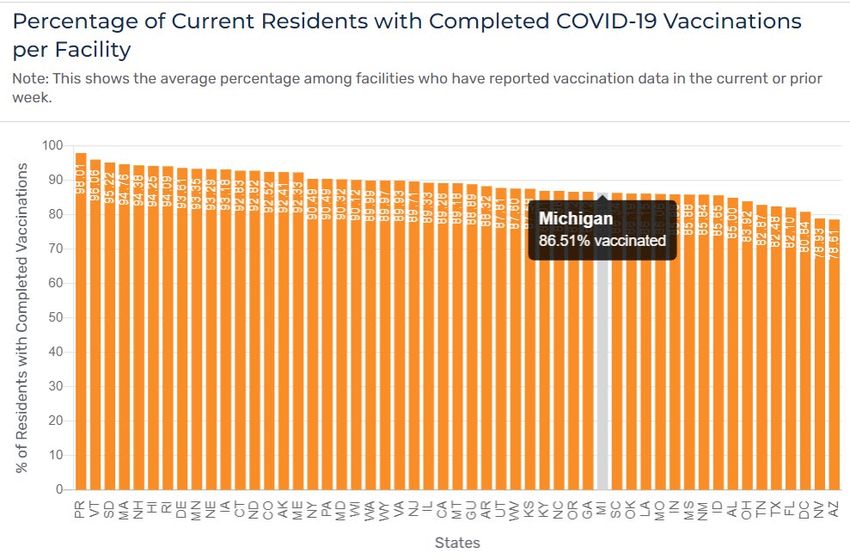
     necessary to be considered up to date at this time.
Completed vaccination among Skilled Nursing Residents and Staff is
plateauing                          83.5% of SNF staff are fully vaccinated, 45 of 53 states/territories
  86.51% of SNF residents are fully vaccinated; 35 of 53       1.7% of SNF staff are partially vaccinated
  states/territories                                       Week ending 11/7, 63.6% of staff initiated COVID-19 vaccine,
                                                           compared to 82.4% the week ending 1/30 (nearly a 30% increase)

                                                                                     1/27/22 CMS Rule Phase 1
                                                             11/5/21 CMS Healthcare  Requirement Deadline
                                                             Worker COVID-19 Vaccination
                                                             Final Rule Announced

https://data.cms.gov/covid-19/covid-19-nursing-home-data        https://www.cdc.gov/nhsn/covid19/ltc-vaccination-dashboard.html
Federal website assists COVID positive residents find treatment
 COVID-19 resources available on federal website: COVID.gov
 Test-to-Treat program simplifies access to COVID treatment: Find a Test-to-Treat location near you
            If you have COVID-19 symptoms, do not wait to get treated
            You must take oral COVID-19 medication within 5 days of your first COVID-19 symptoms
            Use the tool to find a location that is right for you
APPENDIX
Case Rate Trends by Age Group
Daily new confirmed and probable cases per million by age group (7-day rolling average)
    3000                    0-9                 30-39               60-69
                            10-19               40-49               70-79
                            20-29               50-59               80+
    2500

    2000

    1500

    1000

     500

         0
             10/1                           11/1                             12/1      1/1   2/1   3/1              4/1

•      Case rate trends for all age groups experienced a plateau over the last week
•      Case rates by onset date for all age groups are between 57.1 and 119.5 cases per million (through 4/11/22)
•      Case counts and case rates are highest for 20-29-year-olds this week, followed by 30–39 and the 40-49 age groups
    Note: Case information sourced from MDHHS and reflects date of onset of symptoms
    Source: MDHHS – Michigan Disease Surveillance System

                                                                                                                          37
Case Rates by Reported Racial and Ethnic Group
      Daily new confirmed and probable cases per million                                                      Daily new confirmed and probable cases per
      (7 day rolling average) by race category                                                                million (7 day rolling average) by ethnicity category
    2000              American Indian/Alaska Native                    Black/African American                           Hispanic or Latino          Not Hispanic or Latino
                                                                                                              2000
                      Asian/Pacific Islander                           White
              Race                       Case Rate                                                                       Race               Case Rate

                                                                                                                         Hispanic/Latino    67.7
    1500      American Indian/
              Alaskan Native
                                         69.8
                                                                                                              1500
                                                                                                                         Non-Hispanic       68.9
              Asian/Pacific Islander     135.4

              Black/African American     60.9
    1000      White                      67.1                                                                 1000

    500                                                                                                       500

       0                                                                                                        0
        10/1             11/1           12/1            1/1             2/1           3/1               4/1      10/1       11/1           12/1         1/1     2/1          3/1   4/1

Updates since last week:
•     Cases per million are increasing at the same rate for all reported racial and ethnic groups, with the exception of Asian/Pacific Islander
•     In the past 30 days, 18.6% (↓ 0.5%) of race data and 23.4% (↓ 1.0%) ethnicity data was either missing or reported as unknown

Note: Case information sourced from MDHHS and reflects date of death of confirmed and probable cases.
Source: MDHHS – Michigan Disease Surveillance System

                                                                                                                                                                                         38
Average and total new deaths, by age group
    Daily COVID-19 deaths in confirmed and probable                                                              Total COVID-19 deaths in confirmed and probable
    cases per million by age group (7 day rolling average)                                                       cases by age group (past 30 days, ending 4/11/2022)
     50
                         0-19                40-49               70-79                                       •       12.2% of deaths below age sixty
                         20-29               50-59               80+
                         30-39               60-69               Total                                                                                                   151
     40

     30
                                                                                                                                                                  88

     20                                                                                                                                                   62

     10                                                                                                                                           24
                                                                                                                                          12
                                                                                                                 0        1-5     1-5
       0
           3/1           3/8           3/15           3/22           3/29           4/5           4/12       0-19        20-29   30-39   40-49   50-59   60-69   70-79   80+

•      Through 4/11, the 7-day avg. death rate is less than 5 daily deaths per million people for those over the age of 80
•      In the past 30 days, there are fewer than 10 among confirmed and probable COVID-19 cases under the age of 40
•      30-day proportion of deaths among those under 60 years of age is 12.2%

    Note: Death information sourced from MDHHS and reflects date of death of confirmed and probable cases.
    Source: MDHHS – Michigan Disease Surveillance System (MDSS)                                                                                                                39
30-day rolling average daily deaths per million people by race and
ethnicity
          Average daily deaths per million people by race                                                Average daily deaths per million people by ethnicity
    10                                                                                                   10
                American Indian/Alaska Native                     Black/African American                            Hispanic or Latino   Not Hispanic or Latino
                Asian/Pacific Islander                            White
     8                                                                                                    8

     6                                                                                                    6

     4                                                                                                    4

     2                                                                                                    2

     0                                                                                                    0
         3/1          3/8           3/15            3/22           3/29            4/5            4/12        3/1        3/8      3/15    3/22      3/29          4/5   4/12

•        Deaths are lagging indicator of other metrics
•        Currently, Whites have the highest death rate (1.17 deaths/million)
Note: Death information sourced from MDHHS and reflects date of death of confirmed and probable cases.
Source: MDHHS – Michigan Disease Surveillance System

                                                                                                                                                                               40
Guiding Principles
    To prioritize equity in each of the following objectives

 01                                        02                                     03
Prevent death and severe                   Protect health care                    Keep vital infrastructure
outcomes                                   capacity (from hospitals to            (schools, corrections)
                                           first responders to LTFS)              functioning safely, while
Prioritize uptake of vaccinations and
booster doses.                             Reduce community spread during a
                                                                                  planning for recovery
                                           surge through all available tools.     Establish a new normal at every phase
Protect the most vulnerable                                                       of the pandemic.
    Mitigate risks in congregate          Reduce severity of cases, need for
                                           ICU/ventilators through vaccines and      Utilizing all available tools and the
     settings using all available tools.                                              concept of "risk budget“.
                                           therapeutics.
Maximize early access to testing and                                              Provide tools to the public to protect
therapeutics.                                                                     themselves.
                                                                                     Including OTC testing and
                                                                                      instructions for isolation and
                                                                                      contact tracing.
Considerate Mask Use

              • Masking is one of the most considerate things you can do
                for other vulnerable members of your community
                      • Extra precautions are needed to protect our friends,
                        neighbors, and loved ones who are at increased risk of severe
                        illness.
                      • People who are at increased risk of severe illness—and
                        family, friends, and coworkers who spend time with them—
                        should consider taking extra precautions even when the
                        COVID-19 Community Level is low.
                      • These precautions can include wearing masks and getting
                        tested before gathering together
                      • If you think you are at increased risk of severe COVID-19, talk
                        to your healthcare provider about the precautions you
                        should take
              • Be respectful of others decision to wear a mask, regardless
                of the reason

Source: CDC COVID-19 Information for Specific Groups of People https://www.cdc.gov/coronavirus/2019-ncov/need-extra-precautions/index.html
You can also read