Construction Materials Market Outlook - Summer 2019 - FMI

Page created by Melanie Hansen
 
CONTINUE READING
Construction Materials Market Outlook - Summer 2019 - FMI
Construction Materials Market Outlook
                             Summer 2019
Construction Materials Market Outlook - Summer 2019 - FMI
The premier advisor to the Construction Materials Industry for over 35 years,
         completing over 100 transactions, more than any peer advisory group

           MORE THAN                                            OVER

        35              YEARS OF
                        EXPERIENCE
                                                            100                TRANSACTIONS

Servicing All Segments of the CM Supply Chain            Active Members in Industry Organizations

   Aggregates          Crushed Stone | Sand | Gravel

                        Concrete | Asphalt | Cement
    Products

                    Asphalt Paving | Road Construction
  Construction

                                            Recent Transactions

                          MERGERS & ACQUISITIONS | FINANCIAL ADVISORY

                 George Reddin | 919.349.1919                       Scott Duncan | 713.936.4930
                     greddin@fminet.com                                sduncan@fminet.com
Construction Materials Market Outlook - Summer 2019 - FMI
Construction Materials Market Update
2019 has been an interesting year thus far for the Construction Materials
(CM) industry, from both a performance and M&A perspective. FMI’s
Construction Materials Index (CMI) has slightly outperformed the major
indexes year to date, after suffering sharp valuation declines in the second
half of 2018. The Q1 earnings of public companies in the CMI were largely
positive, and Q2 has generally proven to yield similar results.
While M&A deal-flow was relatively quiet in the first half of 2019, we did see
some activity focused mainly on smaller, bolt-on transactions. As predicted,
buyers concentrated on “safe” transactions, targeting companies in their
existing geographic markets with complementary core competencies. As Q2
earnings are finalized and faith in the segment continues to stabilize, we
anticipate an uptick in activity for the second half of 2019.

CMI vs. Major Indexes (2018)
In 2018, major market indexes outperformed the CMI…
                                                                                       CMI “decouples” from major indexes
 20%
 10%
                                                                                                                                        -6%
  --%
(10%)                                                                                                                                    -7%

(20%)
(30%)                                                                                                                                   -32%
(40%)

                                   CM Index                                  DJIA                        S&P 500

CMI vs. Major Indexes (2019 YTD Performance)
…but CMI companies have performed well in 2019

 30%
                                                                                                                                        20%
 25%
 20%
                                                                                                                                          16%
 15%
 10%                                                                                                                                   13%
  5%
  --%
 (5%)

                                                       CM Index             DJIA         S&P 500

          FMI’s CMI is up over 19.9 percent year to date, compared to 16.4 percent
            & 12.7 percent for the S&P 500 and Dow Jones Industrial Average

         Source: Capital IQ; CM Index is Price Weighted; market data as of 8/11/2019                         FMI Corporation Copyright 2019     3
Construction Materials Market Outlook - Summer 2019 - FMI
Economic Performance
Growth & Economic Environment

While macroeconomic forecasting is notoriously difficult, key drivers for the construction materials sector appear positive.
Construction put-in-place highlights include:
 Transportation spending continues to lead economic growth, with outlays projected to increase by 8% in 2019 over 2018
 Year-over-year spending growth for Highways and Streets has risen since Q1, and is now projected at 6%
 The USGS reports a 9% increase in aggregates production in Q1 2019 as compared to Q1 2018

                Construction Put In Place Growth for Selected Markets
                                                    Actuals                                     Forecast            Growth in non-
                             2014        2015         2016         2017        2018          2019       2020
                                                                                                                       residential
Transportation                   7%           7%         (3%)          4%         15%            8%        8%
                                                                                                                  construction shows
Highway & Street                 4%           7%           2%        (4%)          4%            6%        5%       optimism, while
Residential                    14%           14%         11%          12%           3%          (4%)       1%     residential markets
Non-Residential                  9%          14%          8%           2%           4%           4%        1%        appear stable
Public Safety                  (1%)       (10%)          (5%)          3%         11%            7%        8%

“Trade War” with China                                                                  Interest Rate Cut

Trade tensions between China and the U.S. continue to mount                             In late July, the Federal Reserve cut interest rates by a quarter
in 2019. In July, the U.S. announced additional tariffs on $300                         point. This was the first reduction of interest rates since 2008,
billion of Chinese goods. Shortly thereafter, the People Bank of                        and a pre-emptive move to cushion the economy from slower
China devalued the Yuan, leading the U.S. to accuse China of                            growth and trade tensions. Additional rate cuts could follow as
currency manipulation. 87% of economists now classify the                               the Fed attempts to mitigate signs of weakening economic
trade disputes as a “trade war.”                                                        performance.

Probability of a Recession

An unprecedented bull market raises the possibility of recession for the U.S. economy. Historically, an inversion in 10-year and 2-
year interest rates is a highly predictive recession indicator. The 2-year interest rate has yet to overcome the 10-year rate, yet the
two rate continue to hang just above an inversion signal.

U.S. Treasury Spreads (10 Year Yield vs. 2 Year Yield)

  3%
                                                                                                                    “More than half of
                                                                                                                     economists polled
  2%
                                                                                                                     expected the next
  1%                                                                                                                recession to start in
                                                                                                                    2020, and just over a
  0%
                                                                                                                   quarter expected in to
 -1%                                                                                                                   start in 2021”
    1988              1993            1998             2003            2008              2013          2018
                                                                                                                    ~ Wall Street Journal
Note: The red circles indicate yield curve inversions and blue bars denote recessions

Recessions are inevitable, BUT economists predict the next downturn will not be as severe as the “Great Recession of 2008.”
Additionally, a recession will have varying degrees of severity for different CM market segments:
    Public revenue streams could only see modest declines
    Exposure to residential construction will be significantly impacted

           Source: Federal Reserve; FMI; Wall Street Journal                                                            FMI Corporation Copyright 2019   4
Construction Materials Market Outlook - Summer 2019 - FMI
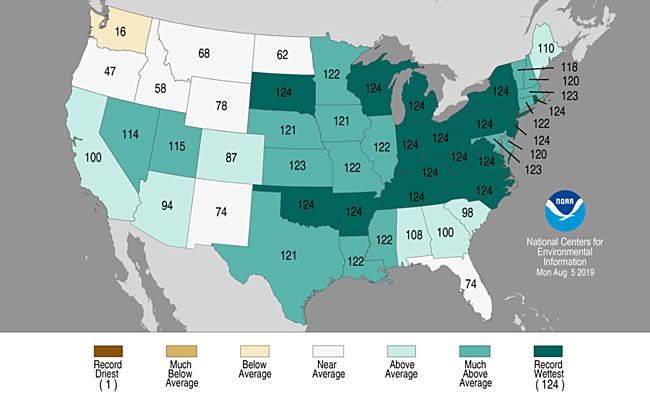
Public Company Performance Metrics
Operating metrics comparing margins, valuations, and debt levels of the public CM companies all point towards a stable
environment with attractive acquisition opportunity.

CMI Composite Debt Analysis                                                          CMI Median Net Debt/EBITDA
Debt levels have slowly risen only slightly since 2014                               Net Debt/EBITDA ratios remain below peak levels

($ in billions)
                                                                                                                                                                           Mean: 3.0x
   $90                                                                                4.5x
   $80                                                                                                                           3.9x
                                                                                      4.0x                                3.6x
   $70                                                                                3.5x                         3.1x                 3.2x
                                                                                                                                               3.1x
   $60                                                                                                      3.0x
                                                                                                                                                      2.8x                 2.8x 2.7x 2.8x
                                                                                      3.0x
   $50                                                                                                                                                              2.6x
                                                                                      2.5x                                                                   2.3x
   $40                                                                                               1.9x
   $30                                                                                2.0x
                                                                                              1.5x
   $20                                                                                1.5x
   $10                                                                                1.0x
    $--
                                                                                      0.5x
                                                                                       --x

            Total Debt                        Cash & Cash Equivalents

            Net Debt

CMI Average EBITDA Margin                                                            CMI TEV/EBITDA
EBITDA margins have stabilized since 2016                                            Valuation multiples remain at attractive levels

                                                                 Mean: 18.9%                                                                                               Mean: 9.5x
  24%
                                                                                     16.0x
              22%
  22%      21%
                                                                                     14.0x
  20%
                        19%                                19%                       12.0x
  18%                                                          18%18% 18%
                            17%                      17%                             10.0x
                                                  16%
  16%                                                                                  8.0x
                                14%
                                   14%14%14%
  14%                                                                                  6.0x
  12%                                                                                  4.0x

  10%                                                                                  2.0x

      Each company in the CMI operates with a different financial structure, however
                     general trends can be observed in key metrics

                  Source: Capital IQ; market data as of 8/11/2019
                  Total Enterprise Value (TEV) defined as market capitalization plus debt minus cash & cash equivalents                    FMI Corporation Copyright 2019               5
Construction Materials Market Outlook - Summer 2019 - FMI
CMI Metrics
 In Q1 2019, revenues and volumes for most CM companies were generally up year-over-year. Q2 results have shown continued
 growth for the most part, with strong margins and stable cash flow. Growing share prices and attractive trading multiples signal a
 return of investor confidence in the CM sector.

                                                                                                                                LTM Median TEV/EBITDA: 8.9x
 24x
                                                                                                                               NTM Median TEV/EBITDA: 8.0x

 20x                                                                                                                          19.1
                              18.5
                                                    17.2
                                 15.8
 16x                                                   14.5
                                                                                                        12.4
 12x                                                                                          10.7                10.6
                                                                                                 10.0      10.0                                       9.9      9.9
                  8.9                                                                                                   8.8               8.8                              8.5
                        7.4             7.5                   7.3                                                                               7.7                              7.2
  8x    6.9 6.6                               6.6                                                                                                                    6.9
                                                                    6.2 6.4         6.1 6.4                                         6.3

  4x

  0x                                                                          N/A

($ in millions USD)

                                                                            Share Price

                                                                              YTD %       Vs 52 Wk         Market                         EBITDA            TEV/     Net Debt/
                      Company                                 Current         Change           High            Cap            TEV         Margin       EBITDA         EBITDA
LafargeHolcim Ltd                                               $47.83         16.2%           (13.9%)     $28,949 $44,984                  21.2%            6.9x           2.2x
CRH plc                                                             31.83      20.4%            (7.4%)         25,385         33,854        12.5%             8.9            2.1
Vulcan Materials Company                                        140.00         41.7%            (1.3%)         18,520         21,841        25.3%            18.5            2.8
Martin Marietta Materials, Inc.                                 249.41         45.1%            (1.4%)         15,573         19,139        26.7%            17.2            3.2
HeidelbergCement AG                                                 68.00      11.8%           (17.3%)         13,492         26,872        15.5%             7.5            3.6
Colas SA                                                        155.02          (3.3%)         (23.1%)          5,059          5,659          5.7%            6.4            0.7
CEMEX, S.A.B. de C.V.                                                0.31      (35.3%)         (56.5%)          4,686         16,620        16.2%             7.3            4.6
Buzzi Unicem S.p.A.                                                 20.52      19.3%            (9.5%)          3,955          4,833        20.3%             6.1            1.2
Eagle Materials Inc.                                                84.32      38.2%           (13.7%)          3,543          4,469        27.8%            10.7            2.4
Cementos Argos S.A.                                                  2.15       0.1%           (21.7%)          2,879          5,309        16.9%            12.4            5.1
Summit Materials, Inc.                                              19.28      55.5%           (11.8%)          2,161          4,059        18.1%            10.6            4.9
Grupo Cementos de Chihuahua, S.A.B. de C.V.                          5.27       3.1%           (21.8%)          1,751          2,240        28.5%             8.8            2.0
Titan Cement International S.A.                                     22.03       (0.7%)         (11.3%)          1,742          2,770        16.0%             9.9            NM
Granite Construction Incorporated                                   28.46      (29.3%)         (51.7%)          1,333          1,452          2.1%           19.1            1.0
Construction Partners, Inc.                                         14.01      58.7%           (11.6%)            724           716         10.9%             8.5            NM
U.S. Concrete, Inc.                                                 45.04      27.7%           (18.0%)            736          1,527        10.5%             9.9            NM
The Monarch Cement Company                                          59.81       (9.4%)         (19.2%)            236           231         24.9%             5.2            NM
Mean                                                                           15.3%           (18.3%)                                       17.6%          10.2x           2.8x
Median                                                                         16.2%           (13.9%)                                       16.9%           8.9x           2.4x

             Data as of 7/29/2019; companies ordered by Market Capitalization
             NOTE: Graphic does not include Monarch Cement Company, as the company does not trade on a major index                        FMI Corporation Copyright 2019           6
Construction Materials Market Outlook - Summer 2019 - FMI
Weather & Market Activity
State Precipitation (August 2018-July 2019)

For much of the US, weather played a significantly large role in the 2018 performance of the CM industry. Companies are now
hoping for a “return to normal” precipitation levels, however the first half of 2019 continued to be extremely wet. The map below
illustrates the trailing-twelve-month precipitation levels by state (from July 2018 – June 2019). The numbers on each state represent
the ranking of precipitation in the past twelve-month period as compared to historic periods. The data has been gathered from 1895
– 2019; therefore, “1” represents the driest period on record, while “124” represents record setting wetness.

Select M&A Market Activity (2019)

As expected, M&A activity in the CM space has been limited in the first half of 2019, however there is always an appetite for
compelling, strategic targets when available. Most transactions in early 2019 were bolt-on acquisitions in nature, securing buyers
market presence in existing geographies.

 Announce Date                                      Target                                                Acquirer
       Jul-19         Undisclosed HMA Producer and Paver                                   Construction Partners Inc.
       Jul-19         Southern Lime                                                        Missippi Lime
       Jul-19         Dan Malloy Paving                                                    Advanced Pavement Group (APG)
       May-19         Coots Materials Company                                              Wendling Quarries, Inc.
       May-19         Midwest Block & Brick                                                Quikrete
       Apr-19         PCS Concrete                                                         Chaney Enterprises
       Mar-19         United Materials                                                     Votorantim Cimentos North America
       Mar-19         Windsor Rock Products, Inc                                           RiverBend Materials (CRH)
       Mar-19         Viesko Redi-Mix                                                      Knife River (MDU Resources)
       Mar-19         Aggregate Deposit in Texas                                           Knife River (MDU Resources)
       Feb-19         Liquid Asphalt Terminal in Florida and HMA and RMC Company           CPI
       Feb-19         100M tons of mineral reserves in Somerset County, PA                 New Enterprise Stone & Lime Co., Inc.
       Feb-19         Yager Materials                                                      Carmeuse Lime & Stone
       Feb-19         Transit Mix Concrete                                                 LafargeHolcim Ltd (SWX:LHN)
       Jan-19         USG Boral                                                            Boral (ASX: BLD)

         Sources: NOAA; FMI                                                                           FMI Corporation Copyright 2019   7
Construction Materials Market Outlook - Summer 2019 - FMI
Infrastructure Funding
Federal Infrastructure Funding
Outside of a robust economy, the single most important driver for the construction
materials industry is infrastructure funding. National funding for the US infrastructure
                                                                                                                                                                                             “It is our shared goal
continues to be a topic of focus for both local and federal politicians. While substantial                                                                                                  to advance a bill out of
obstacles to new legislation persist, infrastructure legislation appears to be one of the few
areas where Democrats and the President can broadly agree. On April 30th, President                                                                                                             committee this
Trump and House Speaker Nancy Pelosi agreed on a $2.0 trillion infrastructure package,                                                                                                              summer”
however negotiations broke down shortly after in May.
On July 29th, the Senate Committee on Environment and Public Works introduced
                                                                                                                                                                                               ~ Chairman John
America’s Transportation Infrastructure Act of 2019 (“ATIA”). ATIA would authorize $287                                                                                                         Barasso (R-WY)
billion in infrastructure spending over five years, including $259 billion for roads and
bridges. On an annualized basis, ATIA represents a 27% increase over FAST Act funding.
The introduction of ATIA is a positive signal for federal infrastructure spending, yet ATIA is
a long way from becoming official.

                               $50
                               $45                1992 Constant Dollars
 Billions of Current Dollars

                               $40
                               $35
                               $30
                               $25
                               $20
                               $15
                               $10                    ISTEA                                     TEA-21                                    SAFTEA-LU                                   MAP-21                            FAST ACT
                               $5
                                        1992
                                               1993
                                                      1994
                                                             1995
                                                                    1996
                                                                           1997
                                                                                  1998
                                                                                         1999
                                                                                                2000
                                                                                                       2001
                                                                                                              2002
                                                                                                                     2003
                                                                                                                            2004
                                                                                                                                   2005
                                                                                                                                           2006
                                                                                                                                                  2007
                                                                                                                                                         2008
                                                                                                                                                                2009
                                                                                                                                                                       2010
                                                                                                                                                                              2011
                                                                                                                                                                                     2012
                                                                                                                                                                                            2013
                                                                                                                                                                                                   2014
                                                                                                                                                                                                          2015
                                                                                                                                                                                                                 2016
                                                                                                                                                                                                                        2017
                                                                                                                                                                                                                               2018
                                                                                                                                                                                                                                      2019
                                                                                                                                                                                                                                             2020
States Enacting Recurring Transportation Revenue

 States are adopting supplemental infrastructure funding                                                                                                                               Since 2012, 37 states have
                                                                                                                                                                                        approved plans to raise additional
     due to the lack of movement on the federal front                                                                                                                                   transportation revenue
                                                                                                                                                                                       The federal government has
                                                                                                                                                                                        signaled that states which raise tax
                                                                                                                                                                                        rates could receive bonus federal
                                                                                                                                                                                        funding
                                                                                                                                                  Enacted 2012
                                                                                                                                                                                       From January through March 2019,
                                                                                                                                                  Enacted 2013
                                                                                                                                                                                        37 state legislatures introduced
                                                                                                                                                  Enacted 2014                          185 bills targeting transportation
                                                                                                                                                  Enacted 2015                          investments, including proposed 21
                                                                                                                                                  Enacted 2016                          fuel tax increases
                                                                                                                                                  Enacted 2017
                                                                                                                                                                                       Some States have launched major
                                                                                                                                                  Enacted 2018
                                                                                                                                                                                        initiatives to prevent the further
                                                                                                                                                  Enacted 2019
                                                                                                                                                                                        degradation of their struggling
                                                                                                                                                                                        infrastructure – ex. The Kentucky
                                                                                                                                                                                        bridge initiative, launched in June
                                                                                                                                                                                        of 2018, with the goal to upgrade
                                                                                                                                                                                        over 1,000 bridges statewide

                                     Sources: Transportation for America; Transportation Investment Advocacy Center                                                                                FMI Corporation Copyright 2019                   8
Construction Materials Market Outlook - Summer 2019 - FMI
Activist Investors
A recent development in the CM market is the emergence of “activist investors” – financial institutions that take significant stakes in
public companies with the goal of quickly implementing changes and improving stock performance. So far in 2019, three investment
firms have taken large stakes in CM public companies.
Actions in the past from these activist shareholders include: Management reorganizations, share buy-back programs,
divestitures/spin-offs, and other operational initiatives. Often, involvement from activist shareholders can signal a “slow-down” in
M&A activity, as non-operating initiatives are paused to assess overall corporate strategies. However, once companies have
completed the strategic initiatives implemented by activists, they are frequently left in positions primed for in-organic growth, with
excess cash available for acquisitions and newly defined strategic growth targets.

           Sachem Head                                           Cevian                                 Southeastern Asset
        Capital Management                                       Capital                                   Management
     has purchased a large share of                  has purchased a large share of                  has purchased a large share of
            Eagle Materials                         CRH (Formerly Oldcastle)                                Summit Materials

  Profile                                         Profile                                         Profile

   Sachem is an activist hedge fund               Cevian is an activist investor fund            Southeastern is an investment
    headquartered in New York, NY                    headquartered in Stockholm, SE                  management firm headquartered
                                                                                                     in Memphis, TN
   Founded in 2012 by Scott                       Founded in 1996 by CEO
    Ferguson                                        Christer Gardell & Managing                    Founded in 1975 by Mason
                                                    Partner Lars Förberg                             Hawkins
   Value-oriented strategy
                                                   Among the largest activist funds               Value-oriented strategy
   Approximately $4.0B in assets                   in Europe, with approximately
    under management                                $14.5 billion in assets under                  Approximately $35.0B in assets
                                                    management                                      under management

  Eagle Materials Campaign                        CRH Campaign                                    Summit Materials Campaign

   On March 28, 2019, Sachem                      On Feb. 6, 2019, Cevian publicly               Southeastern disclosed a large
    disclosed an 8.9% stake in Eagle                disclosed that it had become                    position in Summit in Nov. 2018,
    Materials; Eagle shares rose                    CRH’s second largest                            but the position was filed
    15.0% on the news, closing at                   shareholder, implying ownership                 passively
    $84.30                                          of roughly 2.8%
                                                                                                   On June 13, 2019, Reuters
   In response to pressure from                   CRH has been undergoing a                       reported that Columbian
    Sachem, Eagle announced a plan                  comprehensive strategic review                  aggregate firm Cementos Argos
    to separate its Heavy Materials                 of all businesses, bolstered by                 approached Summit with a
    and Light Materials into                        Cevian’s investment strategy                    proposed merger
    independent corporations
                                                   As previously contemplated, CRH                On June 17, 2019, Southeastern
   Sachem believes that a breakup                  is divesting its European                       submitted a Schedule 13G filing
    of Eagle could result in a                      distribution arm and                            to the SEC, signaling its intention
    combined valuation of $130/share                Fencing/Security group                          to actively engage management

  Other Investments                               Other Investments                               Other Investments

          Sources: CapIQ; Seeking Alpha                                                                      FMI Corporation Copyright 2019   9
Renewed Optimism and Forward Expectations
For the construction materials space, M&A activity in the first half of 2019                                              Market Geography
began slowly as expected. Buyers were focused on compelling, strategic                                               New Market        Existing Presence
bolt-on transactions - targeting companies with similar core competencies
to their own in existing markets. In order to renew a more robust M&A
scene in 2019, we projected that two things were necessary: Q1 and Q2

                                                                                                   Expansion
earnings needed to meet analyst expectations and weather would need to
return to normal. While earnings reports have played out as expected thus

                                                                                 Industry Sector
far as hoped, the weather has continued to be an issue in many markets.
Discussions on infrastructure spending and speculation about the
reauthorization of the Fast Act continue with increased optimism, while
State funding initiatives continue to grow at an increased pace. Public

                                                                                                   Core Competency
spending on road related projects is very active, resulting in strong volumes
and backlogs for many CM companies. Labor constraints continue to be a                                                                      H1 2019
significant challenge across the industry, however the overall outlook for the                                                               M&A
remainder of 2019 and early 2020 looks positive.
FMI anticipates an active M&A market for the second half of the year. While
sounding repetitive, a return to normal weather is expected to produce
improved earnings and return a strong appetite for acquisitions.

            M&A in the first half of 2019 has been focused on bolt-on targets in
           existing markets. As we move into the second half of 2019, we expect
                          a return to a robust transaction climate

        Sources: CapIQ; Seeking Alpha                                                                                     FMI Corporation Copyright 2019   10
Q2 2019: Earnings Report Update
As of 8/12/2019, 11 companies out of 17 reporting CMI companies have released their second quarter earnings (first half earnings
for non-US companies) for 2019. Revenues and volumes for most CM companies were generally up 2%, year-over-year in Q2.

                                        Revenue Revenue ▲ EBITDA EBITDA EBITDA ▲                       Analyst Revenue              Analyst
               Company                   Q2 2019      (YOY %)       Q2 2019 Q2 2018      (YOY %)         Expectations       EBITDA Expectations
                                                                CMI Member Firms
Buzzi Unicem S.p.A.                         864.4         10.7%       153.8     120.8      27.3%            MISS                    EXCEED
CEMEX, S.A.B. de C.V.                     3,523.1         (4.8%)      607.0     722.3     (16.0%)           MISS                      MISS
Colas SA                                       -                -       -        10.5              -         N/A                       N/A
*Construction Partners, Inc.                227.3         16.5%        30.3      21.3      42.2%             HIT                       HIT
CRH plc                                        -                -       -       652.2              -         N/A                       N/A
*Eagle Materials Inc.                       370.6         (5.9%)       82.0     113.5     (27.7%)            HIT                      MISS
Granite Construction Incorporated           789.5         (2.2%)      (89.5)     47.1    (290.1%)            HIT                      MISS
The Monarch Cement Company                   50.3          3.5%        11.6      12.9     (10.0%)          EXCEED                   EXCEED
HeidelbergCement AG                       5,246.0         (6.5%)      751.3 1,020.7       (26.4%)           MISS                      MISS
LafargeHolcim Ltd                         6,691.4          0.2% 1,312.3 1,130.3            16.1%            MISS                      MISS
Martin Marietta Materials, Inc.           1,279.5         13.3%       377.5     349.7        7.9%            HIT                       HIT
Grupo Cementos de Chihuahua                 240.5          3.5%        70.3      65.5        7.2%            HIT                       HIT
Cementos Argos S.A.                            -                -       -        85.3              -         N/A                       N/A
Summit Materials, Inc.                      600.9          0.0%       134.8     131.6        2.4%            HIT                       HIT
Titan Cement International S.A.             481.0          5.7%        85.8      86.8      (1.1%)            HIT                       HIT
U.S. Concrete, Inc.                         367.5         (9.1%)       31.5      52.2     (39.7%)           MISS                      MISS
Vulcan Materials Company                  1,327.7         10.6%       357.9     319.4      12.1%             HIT                       HIT
                                                                     Other Firms
Arcosa, Inc.                                434.1         23.0%        64.0      46.4      37.9%             HIT                    EXCEED
Bouygues SA                                    -                -       -      1,022.1             -         N/A                       N/A
MDU Resources Group, Inc.                 1,303.6         22.4%       159.8     128.5      24.3%             HIT                    EXCEED
VINCI SA                                 12,608.1          7.2% 1,928.2 1,829.4              5.4%           MISS                    EXCEED
Skanska AB (publ)                         4,585.7         (5.5%)      280.7     190.8      47.1%             HIT                    EXCEED

                                                   Select Highlights from Earnings Reports
                             Granite Construction (NYSE:GVA) – In August, Granite announced that Q2 earnings would be offset
                             by a major write down, resulting from non-cash charges related to four legacy, unconsolidated heavy
                             civil joint venture projects. The total after-tax effect of this write down was a $100+ million deduction
                             from the bottom line. As a result, Granite has pledged a switch strategies, dedicated to the pursuit of
                             sole ventures and Granite-led projects

                             Martin Marietta (NYSE:MLM) - Martin Marietta Materials Inc. reported results for a record-breaking
                             quarter ending June 30, 2019. Total revenues amounted to $1.279 billion, proving 6.4% YOY growth.
                             The company attributes the growth to increases in both volumes and pricing in MLM’s aggregate
                             shipments. Earnings from operations increased by 8.3% YOY, stimulating a stock price jump of 4% the
                             day after MLM’s earnings report was released.

                             MDU Resources Group, Inc. (NYSE:MDU) – Revenues for MDU Resources Group in Q2 were up
                             41% in the second quarter at $61.8 million. The increase can be attributed to acquisitions made in 2018
                             and early 2019, as well as increased opportunities from strong economic environments in many of the
                             group’s operating states. Construction Materials earnings were up 20% with a backlog 42% higher than
                             the same period last year.

          Source: CapIQ; Revenue and EBITDA figures as reported by CapIQ and may excluded misc. income
          *Asterisk notes company on different quarter                                                             FMI Corporation Copyright 2019   11
          Note: “HIT/MISS/Exceed” categories defined within 5% of consensus analyst expectations
Our Team

                           George Reddin                                  Scott Duncan
                           Managing Director                              Managing Director
                           919.349.1919                                   713.936.4930
                           greddin@fminet.com                             sduncan@fminet.com

   Education: B.A. University of North Carolina   Education: B.A. Denison University
              MBA University of North Carolina               MBA University of Denver
   Experience: 30+ Years in Investment Banking    Experience: 7+ Years in Investment Banking

                                                                         FMI Corporation Copyright 2019   12
You can also read