CONTACT TRACING TO MAINTAIN MOBILITY AT THE BORDER DURING A PANDEMIC
←
→
Page content transcription
If your browser does not render page correctly, please read the page content below

CONTACT TRACING TO MAINTAIN MOBILITY
AT THE BORDER DURING A PANDEMIC
by

Okan Gurbuz, Ph.D.
Assistant Research Scientist

Rafael M. Aldrete, Ph.D.
Senior Research Scientist

David Salgado, Ph.D.
Assistant Research Scientist

Mario Vazquez
Non-affiliated Student Assistant

Project performed by
Center for International Intelligent Transportation Research

185921-00008: Contact Tracing to Maintain Mobility at the Border
during a Pandemic

September 2021
Report prepared by

Center for International Intelligent Transportation Research
Texas A&M Transportation Institute
4050 Rio Bravo, Suite 151
El Paso, Texas 79902

TEXAS A&M TRANSPORTATION INSTITUTE
The Texas A&M University System
College Station, Texas 77843-3135

TABLE OF CONTENTS

 Page

List of Figures ............................................................................................................................... vi
List of Tables ................................................................................................................................ vi
Disclaimer and Acknowledgments ............................................................................................ vii
Executive Summary ...................................................................................................................... 1
Chapter 1: Introduction ............................................................................................................... 3
 1.1 Background ........................................................................................................................... 3
 1.2 Objective ............................................................................................................................... 4
 1.3 Outline of Report .................................................................................................................. 4
Chapter 2: Literature Review ...................................................................................................... 5
 2.1 Pandemics and COVID-19 ................................................................................................... 5
 2.2 Transportation and COVID-19 ............................................................................................. 6
 2.3 Borders in the Time of COVID-19 ....................................................................................... 6
 2.4 Contact tracing ...................................................................................................................... 7
 2.5 El Paso–Juarez Binational Region ...................................................................................... 10
 2.6 Chapter Summary ............................................................................................................... 12
Chapter 3: Border Restrictions and Destination Shifts........................................................... 13
 3.1 Border Restrictions and Mobility ....................................................................................... 13
 3.2 Destination Changes of Cross-Border Commuters ............................................................. 14
 3.2.1 Data Sources ................................................................................................................ 15
 3.2.2 Findings........................................................................................................................ 17
 3.2.3 Maps ............................................................................................................................. 24
Chapter 4: Model Development................................................................................................. 27
 4.1 Data ..................................................................................................................................... 27
 4.2 Border Crossing Epidemiology Model ............................................................................... 27
Chapter 5: Scenarios and Model Results .................................................................................. 32
 5.1 Scenario Development ........................................................................................................ 32
 5.2 Results ................................................................................................................................. 33
 5.3 Stakeholder Input ................................................................................................................ 34
 5.4 Limitations .......................................................................................................................... 35
Chapter 6: Findings and Conclusions ....................................................................................... 36
References .................................................................................................................................... 37
Appendix: Online Map Manual................................................................................................. 41
 Zoom ......................................................................................................................................... 41
 Navigation ................................................................................................................................. 42
 Visualize Attribute Table .......................................................................................................... 43
 Change Layer Transparency ..................................................................................................... 45

Center for International Intelligent Transportation Research
Texas A&M Transportation Institute Page v

LIST OF FIGURES

 Page

Figure 1. Google and Apple System Use for Contact-tracing Apps in the United States. ........... 10
Figure 2. Identified Contacts Notified within 48 Hours. .............................................................. 11
Figure 3. El Paso Infection Source. .............................................................................................. 11
Figure 4. Northbound Privately Owned Vehicle Crossings.......................................................... 14
Figure 5. Border Mobility Index for Northbound Personal Vehicle Crossings. ........................... 14
Figure 6. Estimated Number of Northbound Daily Trips. ............................................................ 19
Figure 7. Number of Daily Contacts of Border Crossing Travelers at Different Land Uses. ...... 23
Figure 8. Trip Density Map. ......................................................................................................... 25
Figure 9. Contact Density Map. .................................................................................................... 25
Figure 10. Trip Change Block Group Map. .................................................................................. 26
Figure 11. Contact Change Block Group Map. ............................................................................ 26
Figure 12. SIR Model Methodology. ............................................................................................ 29
Figure 13. Reported Cases and Simulation Results. ..................................................................... 30
Figure 14. Reported Deaths and Simulation Results. ................................................................... 31
Figure 15. Simulation Results for Scenarios (Number of Cases). ................................................ 33
Figure 16. Simulation Results for Scenarios (Number of Deaths). .............................................. 34
Figure 17. Zoom Online Map Interface. ....................................................................................... 41
Figure 18. Navigation Online Map Interface. ............................................................................... 42
Figure 19. Layers Icon. ................................................................................................................. 43
Figure 20. Expand Layers. ............................................................................................................ 43
Figure 21. Layer View. ................................................................................................................. 44
Figure 22. Show Table. ................................................................................................................. 44
Figure 23. Attribute Table Display. .............................................................................................. 45
Figure 24. Show Properties. .......................................................................................................... 45
Figure 25. Change Transparency. ................................................................................................. 46

LIST OF TABLES

 Page

Table 1. INRIX Dataset Number of Data Points. ......................................................................... 17
Table 2. INRIX Sampling Rate for Northbound Border Crossing Travelers. .............................. 18
Table 3. Trip Destinations Based on Land Uses. .......................................................................... 22

Center for International Intelligent Transportation Research
Texas A&M Transportation Institute Page vi

DISCLAIMER AND ACKNOWLEDGMENTS
 This research was performed by the Center for International Intelligent Transportation
Research, a part of the Texas A&M Transportation Institute. The contents of this report reflect
the views of the authors, who are responsible for the facts and the accuracy of the data presented
herein.

 The authors would like to thank David Coronado, director of the City of El Paso International
Bridges Department who operates the international bridges in El Paso, for providing data,
feedback, and support scheduling stakeholder meetings.

 The authors would also like to thank Emma Schwartz, president of the Medical Center of the
Americas Foundation, for allowing us to present at the El Paso/Juarez COVID Communications
and COVID Community Partners meetings.

 The authors would also like to thank Veronica Gonzalez, directora de Juárez Resiliente, for
providing feedback.

 The authors would also like to thank Dr. Tugba Mehmetoglu-Gurbuz for sharing her
expertise in infectious disease, which strengthened the study.

Center for International Intelligent Transportation Research
Texas A&M Transportation Institute Page vii

EXECUTIVE SUMMARY
 COVID-19 is the infectious disease caused by the most recently discovered coronavirus
(SARS-CoV-2). Although most of the people who have COVID-19 have mild symptoms, it can
also cause severe illness and even death. The United States is the most affected country based on
the total number of cases and fatalities. To slow down the speed of spread, most countries
applied travel restrictions, school closures, shutdowns, and stay-at-home orders. A fiscal year
2020 Center for International Intelligent Transportation Research study, Cross-Border
Transportation as a Disease Vector in COVID-19, found that in both countries, the U.S. and
Mexico border crossing has a significant effect on the speed of spread. The El Paso–Juarez
region is one of the places hit hard by the virus spread. This was Phase I of the COVID and
border studies done by the researchers. (The report is available at
http://tti.tamu.edu/documents/185920-00015.pdf.)

 As a follow-up, in Phase II, researchers wanted to focus on a commonly used practice to slow
down the spread with a focus on the same region. Contact tracing is an approach to track down
anyone that was in close contact with a person who has been diagnosed with the illness. It is
considered one of the key practices to slow the spread for all infectious diseases. The traditional
way is accomplished through manual interview of the infected individuals. The main challenge
with this practice is that people may not accurately recall each person they have been in contact
with and cannot identify the people if they do not personally know them. Considering the
limitations, researchers started focusing on emerging technology solutions to automate the
contact-tracing process. During the COVID-19 pandemic, many smartphone contact-tracing apps
have been proposed and deployed. However, the number of downloads and active users
remained low worldwide. In the United States, states initiated their programs and have been
developing contact-tracing apps, and so far, only half of the states have a contact-tracing app for
their residents. The apps rely on the users’ willingness to participate, and the privacy concerns
are still a major obstacle against wide use. Although the effectiveness of contact-tracing apps is
questionable, taking advantage of mobile technology is expected to help in transitioning back to
daily life while managing the risk of future outbreaks.

 One objective of this study is to explore the destinations of the trips in the United States that
originated in Mexico and crossed the border in the El Paso–Juarez region. The changes before
and after border restrictions are documented and illustrated by using mapping techniques. The
results are documented in two categories: number of trips and number of contacts. The total
number of trips decreased 63 percent, and the highest decrease was experienced at schools and
churches with a 79 and 90 percent decrease, respectively. The follow-up study showed that the
highest decrease in the number of contacts was also experienced at schools and churches. These
are followed by commercial land uses with a 79 percent decrease in the number of contacts.
Total daily contacts decreased 61 percent for the residential land uses. The lowest decrease was
experienced at industrial land uses, which was 42 percent.

 In this study, researchers developed a mathematical model based on a simple susceptible,
infected, and recovered (SIR) model coupled with mobility trends and linear regression
expressions to understand the outbreak spreading. Linear regression analyses were generated and
embedded into the SIR model to estimate the consequences of the different what-if scenarios in
Center for International Intelligent Transportation Research
Texas A&M Transportation Institute Page 1
the region. Using the cumulative number of cases, researchers could evaluate the border
restrictions and contact-tracing practices for four different scenarios:
 • Scenario 1 was developed to explore the effects of the increasing border mobility.
 • Scenario 2 was developed to understand the effectiveness of a mandatory border-crossing
 contact-tracing program.
 • Scenario 3 was developed to see the potential benefits of substituting the conventional
 contact-tracing efforts with a contact-tracing app.
 • Scenario 4 was developed to show the impact of a comprehensive contact-tracing system
 that includes traditional contact-tracing efforts and the use of a contact-tracing app.

 The model was run for each scenario, and the results of the cumulative number of cases were
compared with the base scenario. Scenario 1 findings are telling; if northbound mobility was
50 percent higher than the actual (with border restrictions in place), there would be a 14 percent
increase in cases in El Paso. With the same conditions but if there was a mandatory contact-
tracing program just for travelers from Mexico, there would be a 9 percent increase in cases.
However, if 50 percent of the entire El Paso population participated in a contact-tracing program
without any other conventional contact-tracing practice, there would be 15 percent or fewer
cases. Finally, the best-case scenario was Scenario 4, which keeps the existing contact-tracing
efforts and has 25 percent of the community use a contact-tracing app. This would result in up to
a 22 percent reduction in the number of cases in El Paso County.

 In February and March 2021, researchers reached out to various stakeholder groups in the
El Paso region and presented the findings at several virtual meetings attended by close to
100 individuals. Stakeholders are all aware of the importance of contact tracing and agree that if
the region had a more comprehensive contact-tracing program with increased use of a contact-
tracing app, the number of cases and deaths would be fewer. Health officials also advised
researchers to improve the study by including the vaccination efforts and total number of
immunized people. Researchers will conduct a follow-up study as Phase III of the overall
COVID and border studies.

Center for International Intelligent Transportation Research
Texas A&M Transportation Institute Page 2

CHAPTER 1:
INTRODUCTION

1.1 BACKGROUND

 COVID-19 is the infectious disease caused by the most recently discovered coronavirus
(SARS-CoV-2). It was first identified in December 2019 in Wuhan, China, and spread to all
countries in the world. As of February 10, 2021, more than 107 million confirmed cases and over
2.3 million deaths have been reported globally (1). The United States is the most affected
country based on the total number of cases and fatalities. To slow down the speed of spread,
most countries applied travel restrictions, school closures, shutdowns, and stay-at-home orders,
which caused millions of people to lose their jobs and global economic uncertainties.

 Although some measures and restrictions were introduced locally, the El Paso–Juarez region
is one of the places hit hard by the virus spread. Currently, El Paso County has more than
117,000 cases (14 percent of the population) and over 2,000 deaths (2). On the other side of the
border, Ciudad Juarez has over 21,000 confirmed cases and around 2,600 deaths (3). Juarez
accounts for 50 percent of the cases and 53 percent of the disease-related deaths in the state of
Chihuahua (3).

 A Center for International Intelligent Transportation Research (CIITR) project conducted by
the authors in 2020 and titled Cross-Border Transportation as a Disease Vector in COVID-19
focused on developing an understanding of the relationship among socioeconomic,
transportation, and border-crossing-related parameters and the speed of spread of COVID-19.
The study found that in both countries, the U.S. and Mexico border crossing has a significant
effect on the speed of spread. The United States and Mexico has had an agreement to restrict
border crossings on nonessential travel since March 2020, but as the economies started to reopen,
border crossings increased significantly during the summer months of 2020.

 Contact tracing is an approach to track down anyone that was in close contact with a person
who has been diagnosed with the illness. As a result, those contacts can quarantine themselves,
preventing further spread. To be successful in the fight against widespread outbreak, the use of
contact tracing is required and commonly used by nearly all countries throughout the world. An
effective contact-tracing program tailored to the unique characteristics of the U.S.–Mexico
border communities may allow border agencies and other stakeholders to develop approaches
that are equally effective in maintaining public health while minimizing the negative impacts on
cross-border mobility.

Center for International Intelligent Transportation Research
Texas A&M Transportation Institute Page 3
1.2 OBJECTIVE

 The objectives of this study are to:
 • Conduct extensive literature research on contact tracing.
 • Measure the trip changes and mobility at the border with border restrictions.
 • Explore the impacts of border restrictions and measures and contact-tracing practices by
 developing an epidemiological simulation model.

 This project allows researchers to understand the impact of border restrictions on the spread
of the disease and answer what-if questions from stakeholders regarding contact-tracing
implementation in the border communities.

1.3 OUTLINE OF REPORT

 The remaining chapters of this report include the following:
 • Chapter 2: Literature Review—This chapter reviews existing literature and reputable U.S.
 and Mexican news sources to provide background information about the COVID-19
 pandemic. Literature documenting the use of different means of contact-tracing
 approaches are also explored.
 • Chapter 3: Border Restrictions and Destination Shifts—This chapter explores the impacts
 of the border restrictions on border mobility and illustrates the changes of the destinations
 of border-crossing travelers by comparing before and after border restrictions.
 • Chapter 4: Model Development—This chapter presents the data, the development of the
 epidemiological model, and the details of the simulation.
 • Chapter 5: Scenarios and Model Results—This chapter introduces the scenarios and
 shares the findings from the model deployment with a focus on El Paso County.
 • Chapter 6: Findings and Conclusions—This chapter presents the main findings and
 conclusions drawn from the study and discusses the potential for further studies.

Center for International Intelligent Transportation Research
Texas A&M Transportation Institute Page 4
CHAPTER 2:
LITERATURE REVIEW
 This chapter summarizes pandemics with a focus on COVID-19, border crossings, and
contact-tracing practices based on the literature reviewed. The purpose of this chapter is to
provide background on the operations of contact-tracing use, its issues, potential solutions, and
research gaps. From these reviews, five sections were identified:
 • Pandemics and COVID-19.
 • Transportation and COVID-19.
 • Borders in the time of COVID-19.
 • Contact tracing.
 • El Paso–Juarez binational region.

 This chapter concludes with a final summary section, which highlights the review findings.

2.1 PANDEMICS AND COVID-19

 A pandemic is defined as the worldwide spread of a new disease (4). Throughout history, as
people have moved, infectious diseases have spread across the world, and millions of people
have died because of pandemics (the Black Death, smallpox, the Spanish flu, HIV, SARS,
MERS, etc.). The World Health Organization (WHO) officially declared COVID-19 a pandemic
on March 11, 2020 (5), and as of February 10, 2021, the number of cases is more than
107 million globally with more than 2.3 million deaths (1).

 COVID-19 first arrived in the United States early in 2020, and the first case was officially
reported on January 20, 2020. Afterward, the virus started to spread at an increasing pace.
Currently, the United States is one of the worst affected countries and is still facing an increased
incidence with more than 27 million COVID-19 positive cases and over 470,000 deaths (1). In
the United States, the worst affected states are California, Texas, Florida, New York, and Illinois.
They all recorded more than 1 million positive cases by March 2021. The death rates across these
states have increased alarmingly and are still surging.

 Based on epidemiological research, COVID-19 has distinct features and significantly differs
from recent outbreaks (SARS, MERS, and Ebola). The virus has a comparatively longer
incubation period with high variance (6). Other studies also showed that people infect others
before showing symptoms (7, 8). Moreover, a significant percentage of asymptomatic carriers
(estimated between 6 percent and 41 percent) never develop symptoms but still significantly
contribute to epidemic dynamics (9). One other specific feature of COVID-19 is the difference in
symptom development for different age groups. Children and young adults generally have milder
symptoms and easily carry and transmit the disease. However, seniors are more likely to exhibit
serious symptoms.

 First reactions with the focus on social distancing aimed to compensate for clinical
unpreparedness and to control the load on the health care systems by flattening the infection
curve. Countries first put into place international travel restrictions, followed by school closures
Center for International Intelligent Transportation Research
Texas A&M Transportation Institute Page 5
and limits or bans on all other gatherings including at bars, restaurants, churches, and
entertainment venues.

 Although strict measures and closures seemed to help reduce the infectivity rate, economic
and social needs started putting pressure to consider reopening strategies. Still, researchers are
trying to explore the contribution of isolation, social distancing, and hygiene to keeping the
disease contained at some level. Over a year of experience and research on COVID-19 led to a
better understanding of both virus-related and social dynamics including classifying destinations
by the risk of infectivity. The use of face masks is considered the most crucial aspect along with
keeping a minimum distance of 6 feet especially in enclosed spaces (10).

2.2 TRANSPORTATION AND COVID-19

 In response to the rapid spread of COVID-19, countries worldwide applied widespread
measures to attempt to flatten the curve. One of the major measures taken is to limit people’s
mobility. With fast and more accessible transportation systems, people are getting more
interconnected, which leads to quicker spread of infectious disease outbreaks, which then turns
into a global pandemic. COVID-19 was the latest example of this phenomenon. After WHO
declared a pandemic, countries started to take strict measures, and the first reaction was to limit
people’s mobility. Shutdowns of borders and airlines were announced to restrict the movement
of people to slow the spread. Ninety percent of the commercial passenger flights were grounded,
and nearly all countries have introduced some form of transportation- and mobility-related
measures including screening, quarantine, and/or restrictions for people traveling from high-risk
areas.

 Askitas et al. (11) collected data related to COVID-19 and population mobility patterns
across 135 countries. Canceling public events and banning private gatherings were found to be
the most effective strategies followed by school closures, workplace mobility restrictions, and
stay-at-home orders. Bonardi et al. (12) collected data from 184 countries and checked the
effects of lockdowns on the number of cases and deaths. Movement within countries increases
the cases, and limiting people’s mobility reduces the spread of disease. Xiang et al. (13)
reviewed over 50 COVID-19 mathematical models with focus on different measures taken by the
countries. The most significant effect was travel restrictions.

2.3 BORDERS IN THE TIME OF COVID-19

 Infectious disease outbreaks can cause serious damage to the human population if effective
measures are not taken. To slow down the spread, one of the first reactions made by governments
was to implement travel bans or travel restrictions. However, restricting travel has social and
economic consequences. Travel bans can be implementation of visa bans based on nationality,
bans on direct flights from origin countries, or complete bans on anyone (regardless of
nationality) entering a country (14). On the other hand, the majority of countries allowed
essential travelers, citizens, and people who have permanent residencies.

Center for International Intelligent Transportation Research
Texas A&M Transportation Institute Page 6
Severe acute respiratory syndrome (SARS) was an outbreak experienced in 2003.
International travel was treated as one of the main reasons for the rapid spread. SARS never
reached the level of a pandemic and stayed at a local level. Still, the outbreak reaction and
consequences taught lessons to researchers and decision makers. During SARS, Singapore took
measures at airports, seaports, and land ports of entry including travel restrictions and visual and
temperature screenings. However, no infected travelers were detected after the implementation
of these screening methods. Only 0.03 percent of the incoming passengers were sent to a hospital
for a secondary check, and none were diagnosed with SARS. In summary, existing screening
technologies at entry points are costly in time and money and did not show expected results (15).
During the Ebola outbreak in 2016 in West Africa, the Centers for Disease Control and
Prevention (CDC) implemented travel and border health measures to prevent the international
spread of the disease. Staff was located in Ebola-experiencing countries and provided technical
assistance for exit screening. Cohen (16) believed that although it is difficult to assess, border
health measures might have helped control the Ebola outbreak before it turned into a pandemic.
In another study, Gold et al. (17) found that exit screening is more effective than entry screening
to capture the sick person before entering the country. On the other hand, in their study,
Mouchtouri et al. (18) reported that based on SARS and Ebola experiences, entry or exit
screenings were not significant in identifying cases. Mouchtouri et al. also reported that there
might be several hidden effects of border screening that are very difficult to assess including
discouraging travel of sick people, raising awareness, and educating people.

 Since many newly reported cases of COVID-19 during early phases of the pandemic had
been associated with travel history from the epidemic region, the majority of the countries took
measures with a focus on border crossings. Moreover, the authors’ previous study, which covers
the early months of the disease spread, found border crossing is a significant parameter in
spreading the virus (19). In other words, cities or counties having a border crossing are more
likely to have more COVID-19 cases than others. However, secondary cases, known as
community spread, continued to increase and be transmitted to locals who had no travel history.
Different studies assessed the impacts of border control and quarantine. Eckardt et al. (20)
conducted a study in the Schengen area of Europe that covered COVID-19 cases until the end of
April 2020 and found that border controls had a significant effect to limit the pandemic. Hossain
et al. (21) evaluated border control measures with different infectivity rates and found that the
border restrictions were not very effective when the infectivity rate was high, which is the case
with COVID-19 in the early days of the outbreak. Similarly, using the actual data of COVID-19,
Askitas et al. (11) found that international travel controls and restrictions on movements across
cities and regions are not significant in reducing the daily incidence of disease spread.

2.4 CONTACT TRACING

 Contact tracing is considered one of the key practices to slow disease spread for all infectious
diseases. Contact tracing has been widely used during the COVID-19 pandemic all over the
world. The aim of contact tracing is to let people know that they may have been exposed to the
virus and should monitor themselves for signs and symptoms. Therefore, all potentially sick
people can be self-quarantined and tested. If tested positive, they are asked to self-isolate.
Ultimately, these practices reduce the community spread in a region.

Center for International Intelligent Transportation Research
Texas A&M Transportation Institute Page 7
One of the challenges with the COVID-19 outbreak is the high rate of asymptomatic cases.
This increases the necessity of contact tracing to identify all individuals who had close contact
with a positive carrier. CDC defines close contact as someone who was within 6 feet of an
infected person for a cumulative total of 15 minutes or more over a 24-hour period starting from
2 days before illness onset until the time the patient is isolated (22). Countries worldwide have
implemented contact tracing by using different methods with the aim of reaching all close
contacts of each positive case. The most common and traditional way is accomplished through
manual interview of the infected individuals. The main challenge with this practice is that people
may not accurately recall each person they have met and cannot identify people if they do not
personally know them. A secondary challenge may be the requirements of the considerable
workforce necessary to conduct interviews.

 Considering these limitations, researchers started focusing on emerging technology solutions
to automate the contact tracing process. High use of smart devices with location tracking
technology and built-in Bluetooth® technology allowing location and proximity detection makes
them reliable solutions for contact-tracing efforts. During the COVID-19 pandemic, many
smartphone contact-tracing apps have been proposed and deployed. In September 2020, Google
and Apple, two major companies whose operating systems run nearly all smart devices, jointly
created the Exposure Notification System, which allows public health authorities to build apps
by using the system to support their contact-tracing efforts. This system does not collect or use
the location of the user. The system only uses Bluetooth® technology to detect and store the
information of the other devices with defined proximity and time of exposure (23).

 Ahmed et al. (24) classified and grouped the system architectures considering how the server
is used and what data are stored in it. The three system architectures commonly used in
developing the contact-tracing apps are as follows:
 • The centralized approach requires users to pre-register with a central server. Users’
 devices store their locations and/or contacted people’s anonymized IDs and upload all
 messages to the central server when tested positive.
 • The decentralized approach moves the functionalities to the users’ devices. The users’
 devices keep real user identities and process the exposure notifications on individual
 devices instead of a central server.
 • The hybrid approach keeps the anonymized ID generation and management decentralized
 on the users’ devices, and the analysis and notifications are done by a central server.

 A contact-tracing app basically stores close contacts and immediately notifies users if they
have contacted infected individuals. Technologically, the concept of location and proximity are
embodied in two standard smart device components: global positioning system (GPS) receivers
and Bluetooth® transceivers. GPS-derived location data capture makes it easy to map and
analyze the movements of all individuals who use the app. Bluetooth® communication allow the
capture of all individuals that have been within 6 feet for at least 15 minutes and will notify the
user if the contacted person is infected and will share his/her data. In the United States, nearly 80
percent of the population have smart devices with these technologies. In order to capture the
remaining population, one way recently developed in Singapore is using smart tokens. Some
countries like New Zealand use quick response (QR) code technology and ask all businesses,
workplaces, and public transit services to display a QR code for each location. Therefore, anyone
Center for International Intelligent Transportation Research
Texas A&M Transportation Institute Page 8
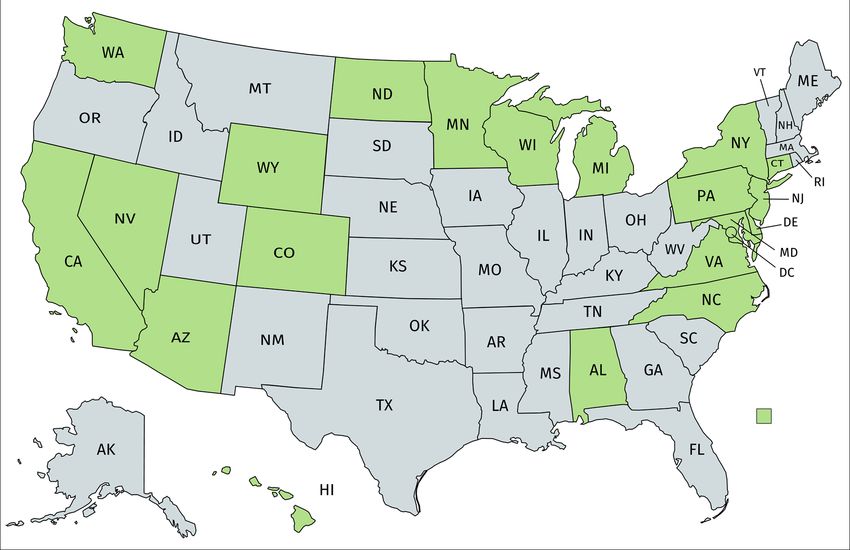
entering the building or transit service should scan his/her device, and all the people using the
services are recorded with respect to time.

 During the development of the apps, researchers have worked on the apps’ effectiveness to
slow the spread of disease. Braithwaite et al. (25) reported that there was no evidence of the
effectiveness of contact-tracing apps on the reduction of transmission. More than half of the
modeling studies suggested that to control COVID-19, a high rate of public use (market
penetration), from 50 percent to 90 percent, is required alongside other control measures.
However, a recent study found that even if 15 percent of the population used a contact-tracing
app alongside the conventional practice, the spread of the virus may be slowed by around 5 to
10 percent (26).

 Despite the early expectations for the comprehensiveness of contact-tracing app use, the
number of downloads and active users remained low worldwide. In Germany, it is around
25 percent, and in Japan it is only 15 percent of the adult population. Very few countries, Ireland,
Iceland, and New Zealand, have higher download rates to date, all above 50 percent. None of the
countries reached 60 percent of their adult population that uses a contact-tracing app (27). In the
United States, states initiated their programs and have been developing contact-tracing apps.
There is still no national contact-tracing program. The Google and Apple systems allow different
apps developed by different states to communicate and share information. Therefore, interstate
travelers can be tracked. With the deployment of the apps, concerns have arisen regarding the
users’ privacy issues, and these concerns are the main factor that influences their adoption (28).
An analysis in December 2020 by the Associated Press found that in the states providing contact-
tracing apps, only 7 percent of the population have used the technology (29). Figure 1 illustrates
the states that signed an agreement with Google and Apple and developed an app using the
Exposure Notification System. Some other states are conducting pilot programs and are expected
to expand to state level soon (Oregon and South Carolina). Some other states developed their
own contact-tracing apps without using the Google and Apple systems (South Dakota and Rhode
Island).

 The system relies on the users’ willingness to participate. One limitation is that people want
to load the app so that they can be notified if someone else was positive, in a self-serving way,
but if they are positive, they do not have the motivation to share the information and take the
time. Some studies showed that the number of downloads does not represent the number of uses.
In summary, the apps have not been used enough to slow the spread of disease. The technical
shortcomings and privacy concerns are still the major obstacles against the wide use of the apps
in contact tracing.

Center for International Intelligent Transportation Research
Texas A&M Transportation Institute Page 9
Figure 1. Google and Apple System Use for Contact-tracing Apps in the United States.

2.5 EL PASO–JUAREZ BINATIONAL REGION

 The El Paso–Juarez region has more than 2 million residents, which induces significant
cross-border passenger travel. The El Paso–Juarez corridor is the busiest border crossing in
Texas, with its unique location encompassing a binational conurbation of two large cities, one on
each side of the border. This corridor supports major binational manufacturing, warehousing, and
transportation industry. Both cities on each side of the border were hit hard by the COVID-19
pandemic. As of mid-February 2021, although vaccination efforts have started, the disease still
has not been controlled.

 To limit the further spread of disease, the United States has reached agreements with both
Canada and Mexico to limit travel across borders (30). The United States does not allow
non-essential travelers to enter the country, excluding citizens and permanent residents, but has
not taken any other special measures at the borders.

 The City of El Paso provides daily information regarding the city and El Paso County on its
website (El Paso Strong) (31). Daily and cumulative cases and deaths are given with some other
epidemiological parameters including infectivity rate, positivity rate, identified contact rate, case
fatality rate, etc. Currently, contact tracing in El Paso is done by public health officials who
reach all the identified contacts and ask the questions listed in the case investigation form about
the patient and his/her previous contacts. There is not a smart device application or an automatic
contact-tracing program in use. According to El Paso Strong (31), public health officials can
reach 86 percent of the contacts and manage to notify them within 48 hours. This number is
Center for International Intelligent Transportation Research
Texas A&M Transportation Institute Page 10
being updated daily and was below 10 percent in July and in November for a time (Figure 2).
El Paso Strong also reports the infection source of the individuals and reports that only
40 percent of the infections in El Paso were spread through close contacts (Figure 3). In other
words, more than half of the patients got the infection from other sources including community
transmission or travel sources, which are very hard to track with conventional contact-tracing
efforts.

 Figure 2. Identified Contacts Notified within 48 Hours.

 Figure 3. El Paso Infection Source.

Center for International Intelligent Transportation Research
Texas A&M Transportation Institute Page 11
2.6 CHAPTER SUMMARY

 Transportation is considered a vector for infectious diseases. The COVID-19 pandemic
showed once more how vital transportation is in spreading the disease as well as providing goods
and services for people. After WHO officially declared COVID-19 a pandemic in March 2020,
countries started taking measures focusing on social isolation and border restrictions. Most
governments have only allowed essential travelers to enter their countries since then. Alongside
the stay-at-home orders and closure of businesses and schools, border restrictions have impacted
the economies a great deal.

 Contact tracing has been considered one of the key practices to slow the spread of all
infectious diseases. A growing number of countries are implementing technology-based practices
to check the movement and proximity of their citizens. Using technology to supplement the
contact-tracing efforts was first used with the COVID-19 pandemic. One of the main objectives
of this study is to understand the potential benefits of increasing the comprehensiveness of
contact tracing by using technology-based contact-tracing programs. Researchers aim to explore
the different levels of adoption of the contact-tracing programs and see the impacts on reducing
the number of cases and deaths.

Center for International Intelligent Transportation Research
Texas A&M Transportation Institute Page 12
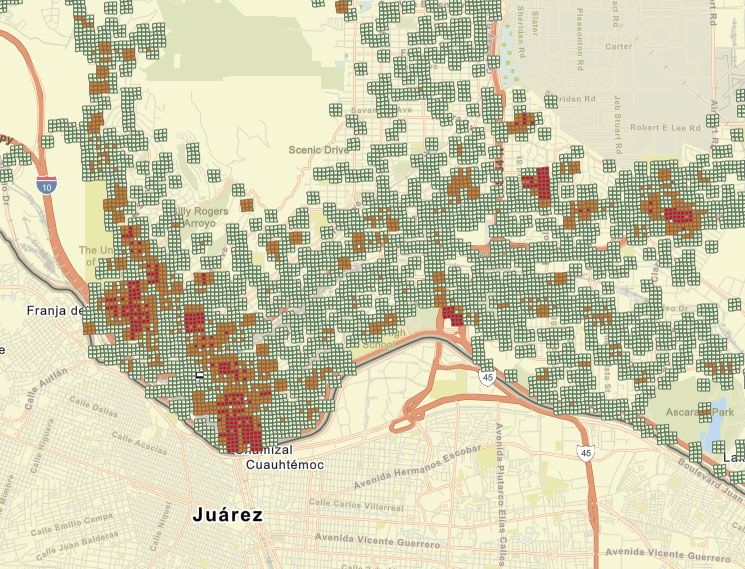
CHAPTER 3:
BORDER RESTRICTIONS AND DESTINATION SHIFTS
 This chapter focuses on exploring the trip destination changes of border-crossing travelers.
Different sources of trip data were used and aggregated to detect the destinations of the trips
crossing borders in the northbound direction. Researchers used state-of-the-art mobility analysis
to detect changes in mobility patterns. The changes before and after border restrictions are
documented and illustrated using mapping techniques.

3.1 BORDER RESTRICTIONS AND MOBILITY

 Soon after the WHO declared COVID-19 a pandemic, most countries started taking
measures, especially at their borders. Researchers have different views on this concept; some
promote the restrictions and believe that they may help at least delay the spread. Others think
that the effects are negligible.

 The United States and border countries Mexico and Canada have reached an agreement to
limit all non-essential travel across their borders. Non-essential travel includes travel that is
considered tourism or recreation oriented. U.S. citizens and lawful permanent residents are
exempt from this action and are allowed to enter the country. The measures were first
implemented on March 21, 2020, and were in place for 30 days. Several further monthly
extensions were made, and the latest is in place until February 20, 2021. The number of cases
and higher community spread are still a concern in the region; therefore, it is expected that there
will be more extensions before the spread is under control.

 In the El Paso–Juarez region, border restrictions alongside the stay-at-home orders and other
social isolation restrictions impacted border mobility significantly. Border mobility in the
El Paso–Juarez region has experienced ups and downs over the last 20 years. Figure 4
demonstrates the number of privately owned vehicles’ (POVs’) northbound crossings with the
different milestones in the last 20 years (32) including the 9/11 attacks, Mexico violence, U.S.
recession, and staff shortage of U.S. Customs and Border Protection. However, the most
dramatic change in border mobility was experienced with the COVID-19 pandemic. To
understand better, a simple border mobility index (BMI) was defined. The monthly average of
the last 5 years of border crossings was assigned as the base BMI with a value of 100. The BMI
stayed within 80 to 120 until the border restrictions and went down below 40 immediately after
the border restrictions. Afterward, the BMI recovered a little and went back to 60 but still needs
some increase to reach the values that it used to have (Figure 5).

Center for International Intelligent Transportation Research
Texas A&M Transportation Institute Page 13
Source: PDNUno
 Figure 4. Northbound Privately Owned Vehicle Crossings.

 Figure 5. Border Mobility Index for Northbound Personal Vehicle Crossings.

3.2 DESTINATION CHANGES OF CROSS-BORDER COMMUTERS

 One objective of this study is to explore the destinations of the trips in the United States that
originated in Mexico and crossed the border in the El Paso–Juarez region. Different sources of
trip and trajectory data were aggregated to detect the destinations. The changes before and after
border restrictions are documented and illustrated by using mapping techniques.

Center for International Intelligent Transportation Research
Texas A&M Transportation Institute Page 14
3.2.1 Data Sources

 This project used two main data sources to explore cross-border travelers’ behavior and
potential interaction with other people in El Paso County. CIITR obtained 3 months of vehicle
location-based cross-border trip data with the focus on five ports of entry (Zaragoza, Santa
Teresa, Paso del Norte, Stanton, and Bridge of Americas) from INRIX. 1 The data timeline starts
on January 20, 2020, and ends on April 20, 2020. All the data for the selected regions were
delivered in comma-separated value (CSV) format. Researchers used two datasets (Trips and
Trajectories). The Trips dataset contains the following information:
 • TripID: A trip’s unique identifier.
 • DeviceID: A device’s unique identifier. Set to the TripID for restricted data providers.
 • ProviderID: A provider’s unique identifier.
 • Mode: The mode of travel (walk, vehicles, or unknown).
 • StartDate: The trip’s start date and time in Coordinated Universal Time (UTC).
 • StartWDay: The trip’s start weekday in local time.
 • EndDate: The trip’s end date and time in UTC.
 • EndWDay: The trip’s end weekday in local time.
 • StartLocLat: The latitude of the centroid of the trip’s start quad key in decimal degrees.
 • EndLocLat: The latitude of the centroid of the trip’s end quad key in decimal degrees.
 • EndLocLon: The longitude of the centroid of the trip’s end quad key in decimal degrees.
 • GeospatialType: Describes the trip’s geospatial intersection with the requested zones:
 o Internal-to-Internal (II): Trips that start and end within any zone.
 o Internal-to-External (IE): Trips that start within any zone and end outside any
 zone.
 o External-to-Internal (EI): Trips that start outside any zone and end within any
 zone.
 o External-to-External (EE): Trips that start and end outside any zones but are
 selected because of an intersection with one or more zones.
 • ProviderType: A numeral representing the provider type (consumer, fleet, or mobile).
 • VehicleWeightClass: A numeral representing the vehicle weight class.
 • TripMeanSpeedKph: The mean speed of the trip in kilometers per hour (kph).
 • TripMaxSpeedKph: The maximum speed of the trip in kph.
 • TripDistanceM: The trip distance in meters.
 • OriginCensusBlockGroup: The census block group of the origin (United States only).
 • DestinationCensusBlockGroup: The census block group of the destination (United States
 only).

 The Trips dataset covers each captured trip by focusing on the locations of the origin and
destinations of the trips with exact timestamps. The Trajectories dataset, however, records all

1
 INRIX is a private company that provides location-based data and analytics and delivers real-time traffic and
parking information. More information is available at https://inrix.com/about/.
Center for International Intelligent Transportation Research
Texas A&M Transportation Institute Page 15
trips with the information of route (Trajectory). Therefore, Trajectory data have more datapoints
with the following information:
 • TripID: A trip’s unique identifier.
 • DeviceID: A device’s unique identifier.
 • ProviderID: The provider’s unique identifier.
 • TimeZone: The trip’s start time zone.
 • TrajIdx: The index of a trajectory for this trip.
 • TrajRawDistanceM: The cumulative distance of raw points in meters relative to the start
 of the trajectory.
 • TrajRawDurationMillis: The cumulative duration of raw points in milliseconds relative to
 the start of the trajectory.
 • SegmentId: The segment ID of the road section on the map. For the open street map, the
 segment ID includes a minus sign to indicate directionality.
 • SegmentIdx: An index of a segment within a trajectory.
 • LengthM: The length of the segment in meters.
 • CrossingStartOffsetM: The start offset in meters relative to the start of the segment where
 a device enters this segment.
 • CrossingEndOffsetM: The end offset in meters relative to the start of the segment where
 a device leaves this segment.
 • CrossingStartDateUtc: The start date in ISO 8601 format when a device enters this
 segment.
 • CrossingEndDateUtc: The end date in ISO 8601 format when a device leaves this
 segment.
 • CrossingSpeedKph: The segment crossing speed in kph.
 • ErrorCodes: The list of error codes associated with this segment.

 Although the Trips and Trajectory datasets are very comprehensive and deliver insightful
values, to understand local or border-crossing travelers’ mobility patterns, these datasets do not
provide the number of potential contacts. In order to address this shortcoming, researchers used
another resource called SafeGraph that provides traffic data from cell phone records (33).
SafeGraph data contain aggregated, anonymized, high-frequency geolocation data collected
across thousands of cellular devices that have opted in to location-sharing services. Several
researchers have used these data extensively to measure various effects of the COVID-19
pandemic. For this project, the Patterns dataset is used and provides information on hourly
visitors based on the locations of all points of interest in a region. This dataset is delivered in a
CSV data format with the following information:
 • Placekey: The unique ID tied to the point of interest.
 • Location_name: The name of the place.
 • Street_address: The street address of the place.
 • Brands: If this point of interest is an instance of a larger brand that is identified.
 • Date_range_start: The start time for the measurement period.
 • Date_range_end: The end time for the measurement period.
 • Visits_by_day: The number of visits to the place each day over the covered period.
 • Poi_cbg: The census block group in which the place is located.
Center for International Intelligent Transportation Research
Texas A&M Transportation Institute Page 16
• Visitor_home_cbgs: A mapping of census block groups to the number of visitors to the
 place.
 • Distance_from_home: The median distance from home traveled by visitors.
 • Median_dwell: The median minimum dwell time in minutes.
 • Popularity_by_hour: A mapping of the hour of the day to the number of visits in each
 hour over the course of the date range in local time.

 Due to the availability of the data, researchers succeeded in gathering the SafeGraph data for
El Paso County between January 1, 2020, and November 1, 2020. As of the writing of this
report, SafeGraph does not provide similar data for the Mexican side of the border.

3.2.2 Findings

 Having information on the exact location of each trip, researchers first mapped the points of
border-originated trips. Table 1 lists the number of trips captured in the dataset. The trips ending
in the United States overlap with the parcel-level maps gathered by El Paso County in Texas and
Dona Ana and Otero Counties in New Mexico to illustrate in which land use the trip ended.
Researchers also filtered the POVs to see the sampling success of the INRIX dataset at the
border crossings. The INRIX dataset provided over 4.3 million data points, and among them,
nearly 3.2 million points were POVs that had destinations located in the United States. Using
both the Trips and Trajectory datasets, researchers filtered the trips that originated in Mexico and
finished in the United States. In total, 128,500 trips were captured, and 108,054 (84 percent) of
them were dated between January 20, 2020, and March 20, 2020; the rest were dated between
March 21, 2020, and April 20, 2020. Also, 89.8 percent of the trips ended in one of the selected
counties (El Paso, Otero, and Dona Ana).

 Table 1. INRIX Dataset Number of Data Points.
 Port of Entry Total POV—U.S. All Before After
 Destination Northbound Restrictions Restrictions
 Traffic
 Zaragoza 820,451 622,390 32,560 27,217 5,343
 Santa Teresa 31,499 11,513 4,548 4,419 849
 Paso del Norte 1,703,974 1,263,014 43,692 37,642 6,050
 (PDN)–Stanton
 BOTA 1,763,081 1,279,359 47,700 38,776 8,924
 Total 4,319,005 3,176,276 128,500 108,054 21,166

 The daily number of crossings provided by the INRIX dataset was aggregated and compared
to the reported monthly number of northbound crossings provided by the City of El Paso
International Bridges Department (PDNUno) (32). Since the INRIX dataset only has two full
months (February and March 2020) of data, researchers compared only those months (see
Table 2). The sampling rate of the INRIX data was found between 3.8 percent and 7.1 percent
for different ports of entry, and the overall sampling rate was 5.6 percent for both months.

Center for International Intelligent Transportation Research
Texas A&M Transportation Institute Page 17
Table 2. INRIX Sampling Rate for Northbound Border Crossing Travelers.
 Port of All February 2020 March 2020
 Entry Northbound INRIX PDNUno INRIX PDNUno
 INRIX (Sampling) (Sampling)
 Zaragoza 32,560 13,227 314,023 10,966 248,433
 (4.2%) (4.4%)
 Santa Teresa 4,548 1,817 40,983 1,267 33,718
 (4.4%) (3.8%)
 PDN–Stanton 43,692 18,906 314,228 14,352 250,018
 (6.0%) (5.7%)
 BOTA 47,700 18,518 263,086 16,386 229,429
 (7.0%) (7.1%)
 Total 128,500 52,468 932,320 42,971 761,058
 (5.6%) (5.6%)

 After finding the average sampling rate of the INRIX data for the border-crossing
commuters, researchers estimated the number of daily trips by extrapolating the trips in the
dataset. The land uses of the parcels from El Paso, Otero, and Dona Ana Counties were grouped
under seven categories:
 • Residential.
 • Commercial.
 • Agricultural.
 • Industrial.
 • Church.
 • School.

 Based on the destination choices’ estimated total daily trips, Figure 6 plots all seven
categories with their 7-day averages.

Center for International Intelligent Transportation Research
Texas A&M Transportation Institute Page 18
(a) Total Trips

 (b) Residential Trips

 Figure 6. Estimated Number of Northbound Daily Trips.

Center for International Intelligent Transportation Research
Texas A&M Transportation Institute Page 19
(c) Commercial Trips

 (d) Agricultural Trips

 Figure 6. Estimated Number of Northbound Daily Trips. (Continued)

Center for International Intelligent Transportation Research
Texas A&M Transportation Institute Page 20
(e) Industrial Trips

 (f) Church Trips
 Figure 6. Estimated Number of Northbound Daily Trips. (Continued)

Center for International Intelligent Transportation Research
Texas A&M Transportation Institute Page 21
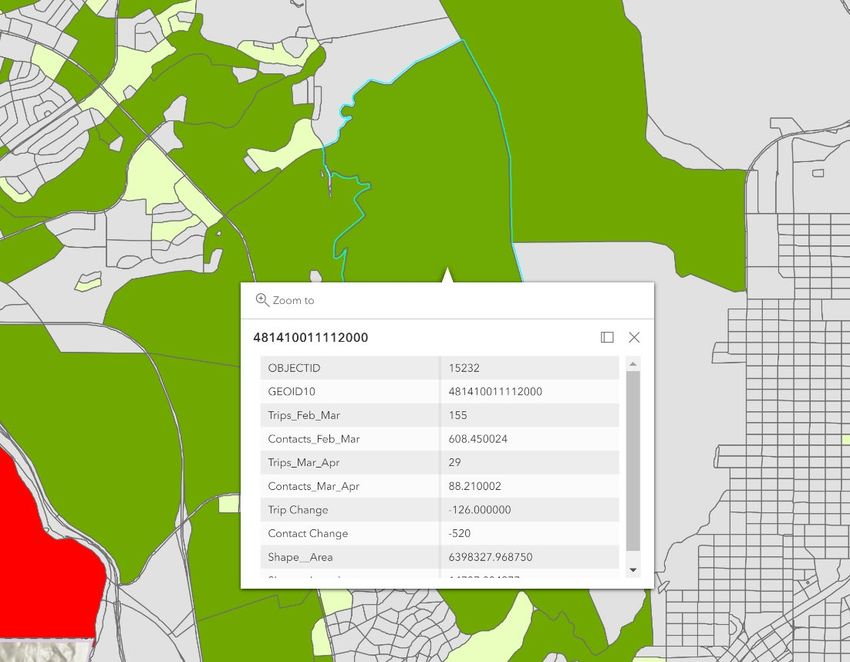
(g) School Trips

 Figure 6. Estimated Number of Northbound Daily Trips. (Continued)

 Table 3 lists the land uses and provides information about the number of trips that ended on
each land use. The dataset covers 2 months before restrictions and 1 month after restrictions;
thus, the number of trips before and after restrictions only has the information of the number of
data points captured for the study. For comparison purposes, researchers extrapolated the
numbers for each land use and found the estimated average daily trips.

 Table 3. Trip Destinations Based on Land Uses.
 Land Use Total Trips Average Daily Trips
 Before After Before After Change (%)
 Restrictions Restrictions Restrictions Restrictions
 Residential 40,517 7,989 11,311 4,449 −61%
 Commercial 52,076 9,460 14,139 5,120 −64%
 Agricultural 100 16 169 135 −20%
 Industrial 638 246 43 25 −41%
 Church 613 42 827 82 −90%
 School 2,837 127 184 39 −79%
 Total 96,781 17,880 26,673 9,850 −63%

 Using the INRIX data, researchers managed to locate the destination of trips. To find the
number of contacts, a second study was conducted using the SafeGraph data. The number of
potential contacts was found for each border-crossing trip by linking the number of other visits
reported by the SafeGraph data. Like the INRIX data, SafeGraph does not provide information
for the entire population. The sampling rate is calculated for each region based on the active
users of data resources and published by the developers. The El Paso County sampling rate was

Center for International Intelligent Transportation Research
Texas A&M Transportation Institute Page 22
You can also read