Content Creation Guidelines updated for SOS 4.2
←
→
Page content transcription
If your browser does not render page correctly, please read the page content below
Content Creation Guidelines                                                 updated for SOS 4.2

New datasets are always welcome for Science On a Sphere®! Here are a few simple guidelines
to assist in the creation of content. The SOS team has significant experience with technical and
aesthetic issues when creating content for spherical display systems, and is happy to provide
feedback and suggestions during production to ensure quality content.
                 Part 1 covers useful information for creating content
                 Part 2 outlines the steps for providing a new dataset to the SOS catalog

Part 1 – Creating New Content
Data Format
There are two basic types of datasets for SOS:
       Texture - Single Image
       Can be displayed on the sphere and animated, as in a planetary rotation. An example of
       this is a global image of the Earth's topography and bathymetry. It’s a static image that
       can be manipulated and rotated in real time from the user interface or remote control

       Time Series - Image Sequence or MPEG4
       Animates through time. An example of this would be a loop of satellite data. For an
       image sequence, SOS will display the images in sequence and play them like a movie
       across the entire sphere surface. Image sequences can be of any arbitrary length,
       limited mainly by disk space and can be animated at frame rates up to 30 frames per
       second. MPEG4's allow for higher resolution and faster frame rates than image
       sequences. Transitions, special effects, and other computer graphics techniques can be
       added to a sequence through the use of off the shelf software like Final Cut Pro.

Map Projection – Equatorial Cylindrical Equidistant Projection
This is a simple latitude/longitude grid with the lines evenly spaced where the image is twice as
wide as it is tall. To be consistent with the SOS Data Catalog, it is recommended that the 0° line
go through the middle of the map, with the +/-180° lines at the edges.

                                                                                                  1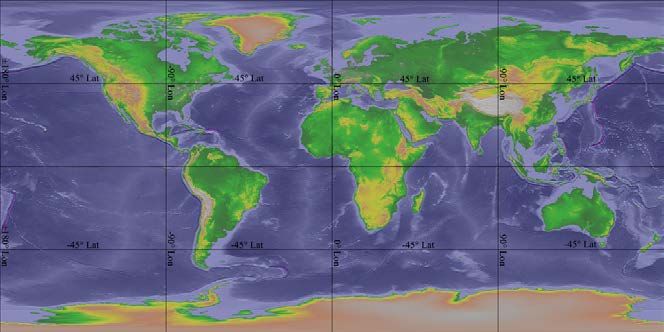
Image Format – JPEG or PNG for single images and image sequences
SOS will accept most common formats (JPEG, PNG, GIF, TIFF, etc.), but JPEG and PNG are
preferred.

Video Format – MPEG4
Render the video with the MPEG4 video codec at a minimum of 25 mbps. Just because a file
has a .mp4 extension does not mean it will play perfectly on SOS. Be sure to check the codec
that was used to render the file. The H.264 codec should not be used because it can cause
errors in the SOS software.

Alternative Format – KML
The software also has the ability to display KML (Keyhole Markup Language) files on Science On
a Sphere. KML is a popular specification and actively used with Google Earth for displaying
data on a sphere. The initial SOS KML capability supports a limited set of the entire
specification, which includes many of the commonly used KML features you would typically
display in Google Earth. An SOS playlist can reference both KML and the compressed KMZ
formats using the layerdata keyword.

Alternative Format – WMS
SOS has an experimental capability to specify and load images directly from an Open GeoSpatial
Consortium (OGC) Web Mapping Service (WMS). This feature requires an internet connection
and will not work unless the SOS system has access to the internet and the referenced WMS
Server. A WMS provides a service allowing users to request data through URLs using specific
key value pairs defining terms such as the width, height, image type, etc... A unique feature of
the WMS standard allows users to request subsets of imagery by defining a bounding box using
a lower left and upper right latitude and longitude coordinates. The combination of these
features allows users to host very large high resolution imagery and users can request smaller
versions or subsets of the original imagery. SOS takes advantage of this functionality through
the magnifying glass, allowing users to see more detail as you increase the zoom level on the
sphere. A tutorial specifically for using WMS with SOS can be found here:
http://sos.noaa.gov/Docs/WMS-tutorial.pdf

Audio Format – MP3, MPEG4, WAV, OGG, AIF…
The audio player for SOS is fairly versatile and most common formats will work with SOS. The
audio file can either be a standalone file or embedded in the same MPEG4 file as the video.

Resolution – 2048x1024 for animations, 4096x2048 for textures
Those are the recommended resolutions, though other 2x1 resolutions, such as 3000x1500 will
work. Higher resolutions are possible for the animations, but not all SOS systems in the SOS
Users Collaborative Network are able to animate at 30 frames per second for higher
resolutions. Make sure to render the videos with square (1:1) pixels for proper playback. If
possible, the highest resolution of the animation that is generated should also be provided, in
addition to the 2048x1024 file, so that it is available in the future as the computers, software
and projectors improve. If an image sequence is provided, it will be rendered into a MPEG4 file

                                                                                               2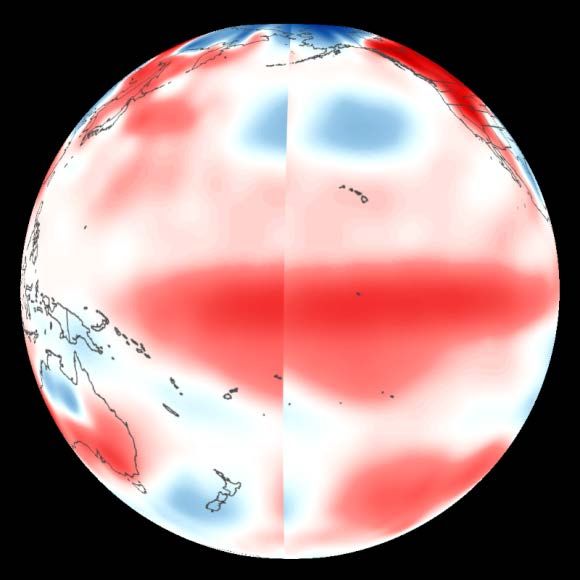
that is 2048x1024 unless there is a specific reason to keep the animation as an image sequence.
For single images, resolutions above 4096x2048 are possible, though load time increases with
resolution size.

Content Considerations
File Names – Based on Resolution, Time Stamp, and Content
Single images are typically named for their resolution, such as 4096.jpg. Image sequences are
kept in folders that are named for their resolution, and the images themselves should be
named to sort in ascending order from earliest to latest. This can either be done with a time
stamp in the file name, or a frame number in the file name with a sufficient number of leading
zeros in ensure proper sorting, shown in the example below. Videos should be named based on
content and resolution, such as hurricanes_2048.mp4. By including the resolution in the file
names, SOS users are able to easily determine what is available and appropriate for their
system. Linux and the SOS software do not handle spaces and special characters in file names
well. Do not use spaces and special characters in file names!

                     Named by date                 Named by frame count
            snow_ice_2048_20110730.png             sos_jpl_4096.0001.jpg
            snow_ice_2048_20110731.png             sos_jpl_4096.0002.jpg
            snow_ice_2048_20110801.png             sos_jpl_4096.0003.jpg
            snow_ice_2048_20110802.png             sos_jpl_4096.0004.jpg
            snow_ice_2048_20110803.png             sos_jpl_4096.0005.jpg
            snow_ice_2048_20110804.png             sos_jpl_4096.0006.jpg
            snow_ice_2048_20110805.png             sos_jpl_4096.0007.jpg

Seams – A problem to be avoided

     The data should take up the whole              The data should match up at the
     image, with no borders or extra space          edges of the image. If it doesn’t, a
     around the edges. Even a pixel                 seam will appear where the mismatch
     border will show up as a seam! In              happens and it won’t look seamless
     most cases, a simple 1% stretch in the         on the sphere.
     horizontal will fix the problem.
                                                                                              3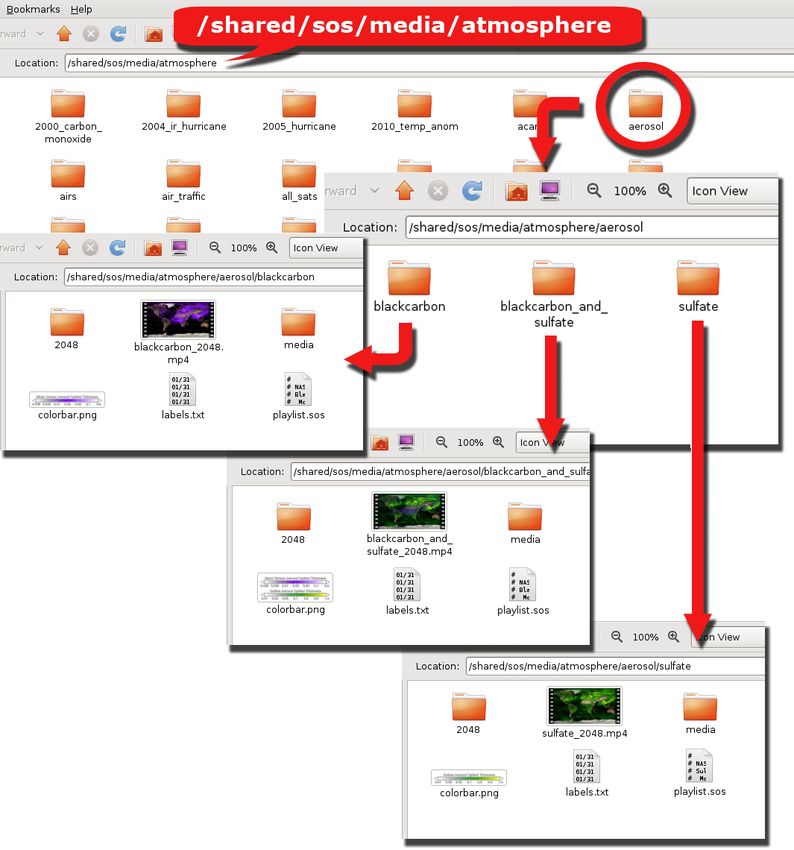
In addition to making sure that the data fills the entire frame, from 180° West to 180° East, also
make sure that the data fills the entire frame from 90° South to 90° North. If there is missing
data at the poles, fill in the area with a solid color or a basic land/ocean background to ensure
that the dataset wraps properly around the sphere without stretching vertically.

Labels – Identifying the dataset
Labels and legends are important. For every dataset that needs a timestamp, a file called
labels.txt should be generated that contains one line for each frame in the animation. A
labels.txt file cannot be used with a single image. Typically the labels include the date, but can
contain any desired information, as seen below.

                   07/24/2004   06:45                 SSEC   08/31/2005   Katrina
                   07/24/2004   07:15                 SSEC   08/31/2005   Katrina
                   07/24/2004   07:45                 SSEC   08/31/2005   Katrina
                   07/24/2004   08:15                 SSEC   08/31/2005   Katrina
                   07/24/2004   08:45                 SSEC   08/31/2005   Maria Katrina
                   07/24/2004   09:15                 SSEC   09/01/2005   Maria
                   07/24/2004   09:45                 SSEC   09/01/2005   Maria
                   07/24/2004   10:15                 SSEC   09/01/2005   Maria
                   07/24/2004   10:45                 SSEC   09/01/2005   Maria
                   07/24/2004   11:15                 SSEC   09/01/2005   Maria
                   07/24/2004   11:45                 SSEC   09/01/2005   Maria
                   07/24/2004   12:15                 SSEC   09/01/2005   Maria

Labels should not be “burned in” the images themselves due to warping. Also, when labels are
“burned in” they can be rotated out of view and tilted at odd angles when a presenter is
interacting with the sphere. The position of the labels that appear from the labels.txt file
remains stationary as the sphere is rotated. While the position and color of the labels can be
adjusted in the playlist.sos file, the font and size cannot be adjusted.

In addition to using the labels.txt file, there are other ways of labeling the content that is on the
sphere. Colorbars and legends can be added using the picture-in-a-picture feature. As with the
timestamps, do not “burn in” colorbars and legends. Make sure to test the size and fonts of
colorbars and legends on the sphere to ensure legibility. It seems that most colorbars and
legends are too small and have to be increased in size when actually displayed on the sphere.
Also make sure to test the size to ensure that the colorbars aren’t so large that they hinder the
audience from seeing the underlying dataset.

The purpose of adding labels to the sphere is to aid the visitor in understanding the dataset.
Consider using pictographs for scales because they have been found to be intuitive and
beneficial for visitor understanding. Also, using country or city labels can help visitors orient
themselves in a global context. Another suggestion is to use vertical temperature colorbars
because that is how most visitors are accustomed to reading thermometers. Size, orientation
and placement of colorbars and legends are important for improving the visitor’s understanding
of the dataset.

                                                                                                     4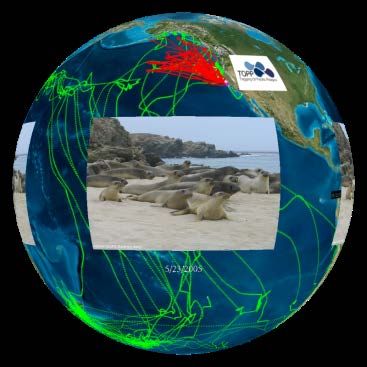
Picture-in-a-Picture – Enhancing the dataset
A Picture-in-a-Picture, or PIP, can be used to enhance an existing dataset or
provide supplementary documentation. Logos, images, colorbars and
legends are added as PIPs. When used for a colorbar, a PIP can help
label a dataset, as seen at right. As with the labels, it is not
recommended to “burn in” the PIPs. Leave it as an additional image file
that can be added in the playlist.sos file. This gives the user complete
control over the position and size of the PIP. In general, nothing should
be “burned in” to the frames for a dataset because PIPs provide a better
way of labeling the dataset.

A PIP can also be used to provide a close-up view of a region or give the
viewer additional context for what they are seeing. In the example at
right, the underlying dataset shows the tracks of elephant seals in red,
and the PIP is a picture of actual elephant seals. Multiple PIPs can be
shown at the same time, or staggered to create a slideshow effect.
Make sure to consider the placement of the PIP in order to not block
information in the underlying dataset, especially if the PIP is displayed
for an extended period of time.

By using PIPs that are PNG’s with a transparent background, many
different shapes can be projected on the sphere with the underlying
dataset as a background. PIPs can be set to display in specific locations
on the sphere as markers, as seen at right. Here each pushpin is a PIP
that identifies the location of a SOS installation.

Standard PIPs shouldn’t be any larger than 1024x1024 in resolution
size. However, PIPs that are set to wrap around the entire sphere can
be up to 4096x2048. Be aware that overlapping and warping can occur if the display size of a
PIP is set too large. Make sure to test each dataset before distributing it to other sites, checking
the PIP size, placement and timing. The display size can be adjusted using pipheight and
pipwidth. PIPs can also be MPEG4 files or image sequences.

A PIP can also be set to be a Shared PIP, which means the PIP will remain active across multiple
datasets in a presentation playlist. In addition, a real-time video feed can be played in a PIP.
This feature may be useful for sites receiving SphereCasts, where, instead of needing a separate
display in the SOS room to show video of the host site’s presenter, the video can be shown
directly onto the sphere. This feature may also be useful if a site wants to show a real-time
video feed of a remote presenter onto their sphere for a particular in-house presentation.

Full documentation of the PIP options can be found in the Playlist Format:
http://sos.noaa.gov/Docs/Playlist.html

                                                                                                  5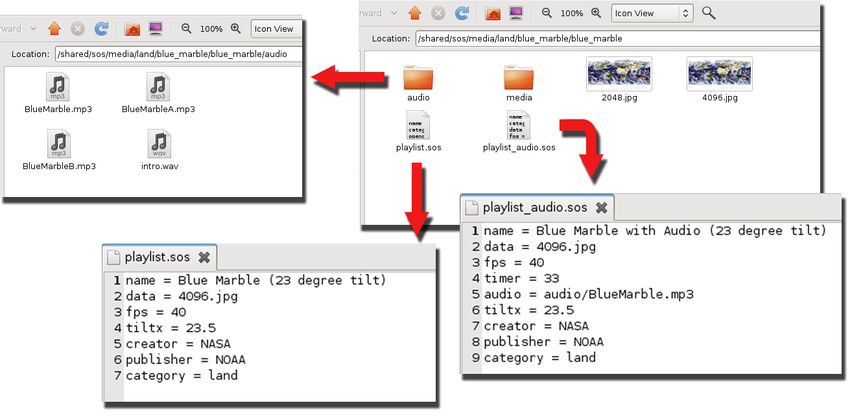
Annotation and Icons – Interactively labeling datasets
The SOS Remote app, through the annotation feature, gives presenters the ability
to draw on the sphere and place icons on the sphere. There is a set of default icons
that come with the SOS Remote app. In addition, sites have the ability to create
custom icons. If you would like to create your own icons, use a transparent PNG
with a minimum resolution of 256x256. To the right is an example of one of the
default icons. Custom icons can either be specified for specific datasets, or made
available in the default icon library.

Layers – Adding flexibility to the dataset
The layering capability in SOS allows presenters to dynamically turn layers on and off. A multi-
layer display can be created either statically in the dataset definition, or interactively using SOS
Remote. By using the new Layers tab in SOS Remote, the user can toggle individual layers on
and off, adjust the level of transparency of each layer, or delete a layer. Any labels or PIPs
associated with a clip are now automatically placed in dedicated layers named Labels and PIPs.
These can be interactively manipulated like any other layer. There is an overlays directory that
includes commonly used layers, such as country borders. Below is an example of adjusting the
transparency between two layered datasets.

Warping – Something to be aware of
When working with a spherical surface, warping is always something to consider. The least
amount of warping occurs near the equator, while the most warping occurs at the poles.
Because of this, it is recommended that any text and labels are placed near the equator.
Supplementary text, labels and images that are displayed as PIPs don’t warp if their position is
set with the PIPcoords keyword in the playlist. Datasets can be tested for warping issues using
CC Sphere in Adobe After Effects or 3D Sphere in Photoshop. There are some plugins for After
Effects such as Cycore Effect’s Sphere Utilities that can also help with spherical warping. In
addition, these programs can be used to check for seams.

Color Suggestions

A color scale can dramatically change the emphasis and message of a dataset. Because of this,
the Science On a Sphere Users Collaborative Network has had many discussions on the color
scales that are used for SOS datasets. The goal is to create datasets with well chosen color

                                                                                                   6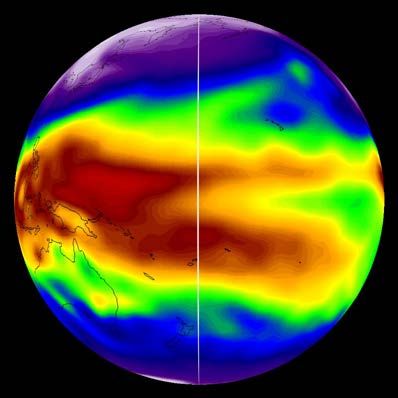
scales that are meaningful, intuitive, and scientifically accurate. Several conclusions are the
result of these discussions:

   1. It can be confusing to users when the same color scheme and their associated color bars
      are used for two completely unrelated datasets.
   2. The same color should not be used to represent more than one thing. i.e. if ice is
      shaded white, then white should not also be used for areas of missing data.
   3. Using rainbow-colored legends and color schemes is often confusing to the audience
      and hard to parse. Instead, consider using shades of green to represent phytoplankton,
      and blue and red gradations to represent temperature anomalies. i.e. use “meaningful”
      colors
   4. Avoid using full sphere backgrounds that are completely or pre-dominantly white. The
      seams between projectors become more apparent when using solid white/bright
      backgrounds. If using bright background colors, consider adding some noise/texture to
      them. Same goes for PIPs, especially those displayed at the seams between projectors.

Tools Used – To create Science On a Sphere visualizations
       •   Because Science On a Sphere® uses basic image formats like JPEG, and PNG as its
           main input format, there are many tools available for creating SOS datasets.
           Common examples are Photoshop®, ImageMagick®, GIMP, etc.
       •   The SOS system comes with a script called “convert2mpeg4” to convert an image
           sequence to an MPEG4
       •   For creating MPEG4 files with transitions, special effects and narration, programs
           such as FinalCut Pro® and Adobe After Effects® are useful.
       •   Tools like IDL, AWIPS, McIDAS, and other image analysis applications are typically
           used to create imagery from scientific data sets. Graphics designers can use a 3D
           modeling applications, like 3D Studio®, to create advanced visualizations.
       •   GIS programs such as ArcGIS or Quantum GIS can be used to create maps. A tutorial
           for creating SOS datasets with Quantum GIS is available here:
           http://sos.noaa.gov/Docs/qgis_tutorial.pdf

                                                                                                  7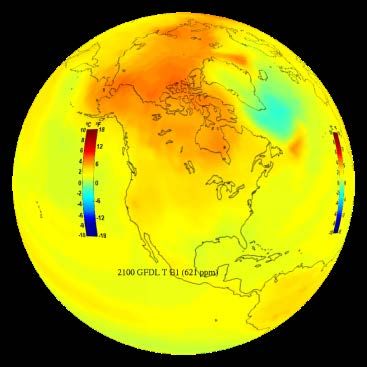
Part 2 – Submitting a Dataset
Content Materials
Every dataset that is added to the SOS Data Catalog should be in its own individual folder that is
stored in appropriate category folder in /shared/sos/media . Complimentary or similar datasets
can be grouped together in a folder that contains individual folders for each dataset. Each
folder, at very minimum should contain a playlist.sos file and either an image, image sequence
or video. In addition to those required pieces, folders can also contain:
    • Image, Image Sequence or Video – required
    • Playlist.sos file – required
    • Labels and colorbars
    • Audio file
    • Picture-in-a-Picture images, image sequences, and/or videos
    • Scripts or supplementary materials
    • Media folder with thumbnails and videos (typically created by the SOS team)

                                                                                                8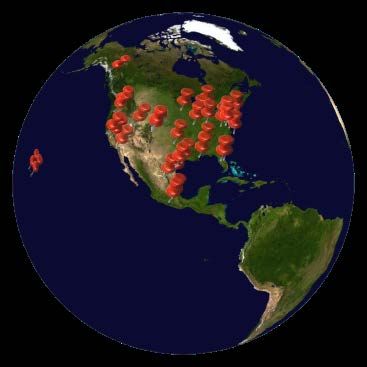
In the above example, there are three datasets that are related and all from the same source.
To keep them together, a folder was created in the atmosphere category called aerosol. In the
aerosol folder, each dataset was given its own folder: sulfate, blackcarbon, and
blackcarbon_and_sulfate. Notice that there are no spaces in the names! In each of the
individual dataset folders there is an image sequence named for the resolution of the frames, a
MPEG4 video, a media folder with thumbnails, a colorbar, labels, and a playlist.sos.

Playlist.sos File
Every dataset must have its own playlist.sos file. Playlist.sos files can be generated using a text
editor, such as Notepad or gedit. There can be multiple playlist.sos files in the same folder,
such as playlist.sos and playlist_audio.sos, as long as they reference the same dataset. When
working with multiple datasets, they should each be in their own folder with their own
playlist.sos file, as shown in the aerosol example. No playlist.sos file should point to multiple
datasets.

In this blue_marble example, there are two playlist.sos files in the folder for the blue_marble
dataset, playlist.sos and playlist_audio.sos. Both playlists point to the same data, and the only
difference is that one includes audio and a timer and the other doesn’t. The playlist.sos
filename must start with playlist and end with .sos, but anything can be added between, such as
_audio or _with_PIPs. Notice that the audio files have been put into their own folder. If there
are multiple audio files or PIPs, a folder can be created in the dataset folder that contains those
files. While this isn’t required, it helps to keep the folder uncluttered.

When files that are referenced in the playlist.sos aren’t in the same directory as the playlist.sos,
the path to the file needs to be included. Take note in the playlist_audio.sos file how the audio
points to audio/BlueMarble.mp3 since the mp3 file isn’t in the same directory as the
playlist.sos. Either relative paths (audio/BlueMarble.mp3) or full paths

                                                                                                   9
(/shared/sos/media/land/blue_marble/blue_marble/audio/BlueMarble.mp3) can be used in
the playlist.sos files. Be careful to avoid typos, as the dataset won’t work if anything is wrong!
There are many optional settings that can be included in the playlist.sos file. At minimum the
playlist.sos file should contain the following elements:
name = Blue Marble
data = 4096.jpg
creator = NASA
publisher = NASA
category = land
keywords = land, Earth, Blue Marble, NASA
The playlist.sos file should be formatted according to the specifications found here:
http://sos.noaa.gov/Docs/Playlist.html. For distribution to the NOAA FTP server, the category
should be one of the existing SOS library categories of land, ocean, atmosphere, astronomy,
models and simulations, extras, and live programs. For local use, the category can be a custom
category for the site. In order for a new dataset to show up in the library on the local SOS
computer, make sure to update the library by clicking “Library” > “Update Library…” in the SOS
Stream GUI.
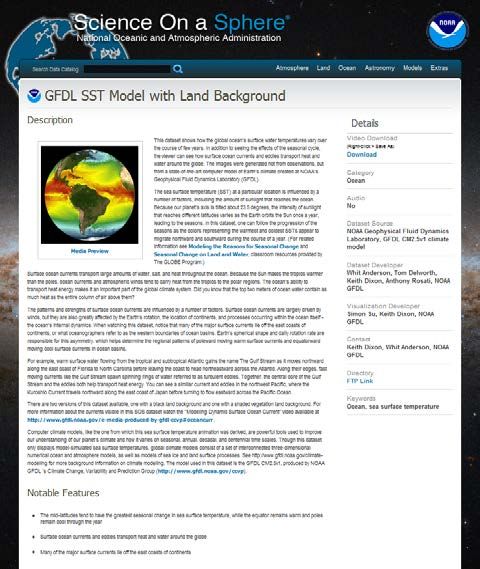
Written Material
In addition to the above material, a written
description of the dataset, a list of “Notable
Features,” and a list of credits are also requested.
All of this documentation is used to create an entry
in the SOS Dataset Catalog, as seen at right. The
written description should be a simple overview of
the dataset that highlights the source of the data,
whether it is modeled or measured, what it shows,
and why it’s important. It should be a non-technical
description that is easily understood. The “Notable
Features” is a bulleted summary of the highlights
from the description that presenters can use when
showing the dataset to viewers. The credits are
used to fill in the table at the bottom of the page.
The credits listed are:
• Dataset Source
• Dataset Developer
• Visualization Developer
These can be the same for each listing, or all
different and can include links to the original
sources. For existing examples, visit the SOS Dataset
Catalog: http://sos.noaa.gov/Datasets/index.html
10Presentation Playlists
To group multiple datasets together, create a playlist, such as hurricanes.sos, that points to
each individual playlist.sos file with the full path included. These playlists are to be stored in
/home/sos/sosrc or /home/sosdemo/sosrc . Here is an example playlist that groups multiple
datasets together:
include = /shared/sos/media/land/blue_marble/playlist.sos
include = /shared/sos/media/atmosphere/carbon_tracker/playlist.sos
include = /shared/sos/media/astronomy/mars/playlist.sos
Playlists that group multiple datasets together can be named anything as long as they end with
.sos. Playlists can either be typed by hand, or created using the Playlist Editor. In order for new
datasets to appear in the Playlist Editor, the library must be updated in the SOS Stream GUI.
More Information on Visualization Considerations
The following article, researching the public understanding of science content, was written by
SOS Users Collaborative Network members:
Phipps, M. and Rowe, S. (2010) Seeing satellite data Public Understanding of Science.
doi:10.1177/0963662508098684
11You can also read